More on our warming World Ocean’s revenge…
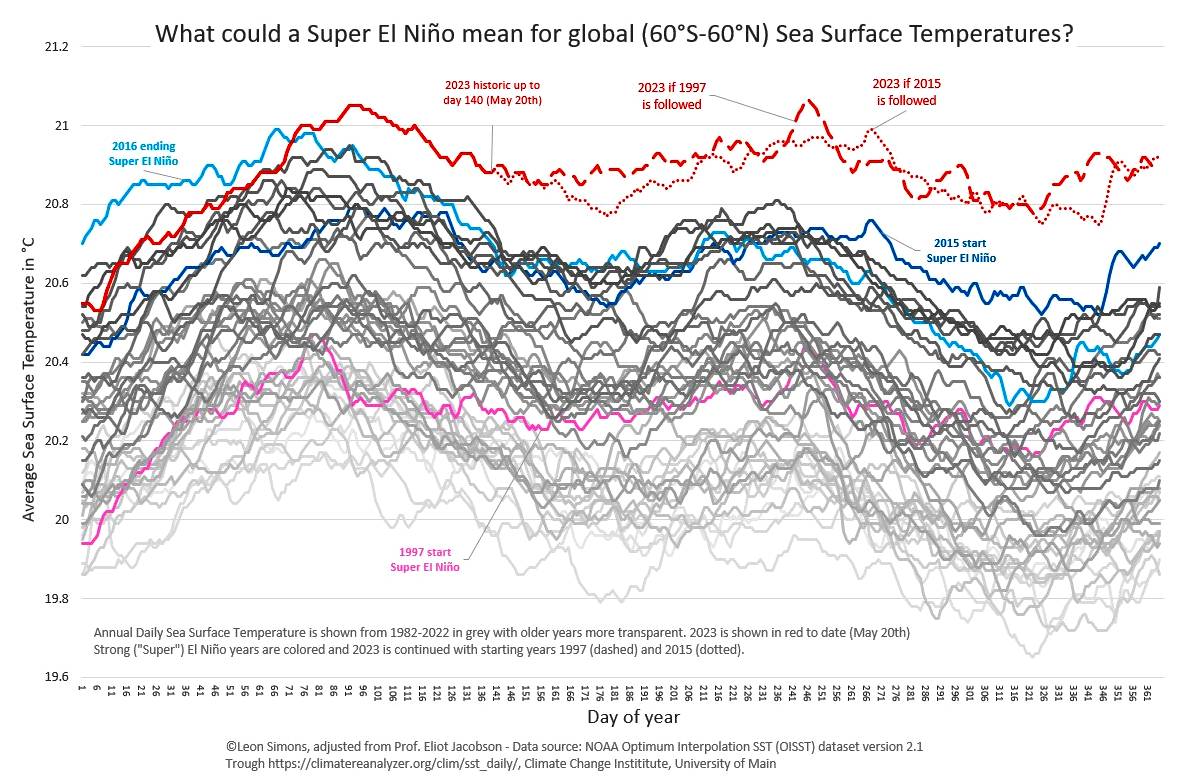
Following on from my May 22 post, the Australian Bureau of Meteorology is raising warning flags that the impending El Niño will be the worst yet.
There is actually a lot more on the front burner than El Niño. There are signs we may have just crossed a catastrophic ocean tipping point over the last three and a half months. The following thread of tweets and news items summarizes a very scary thread of observational data.
We may have broken Earth’s Thermohaline Circulation.
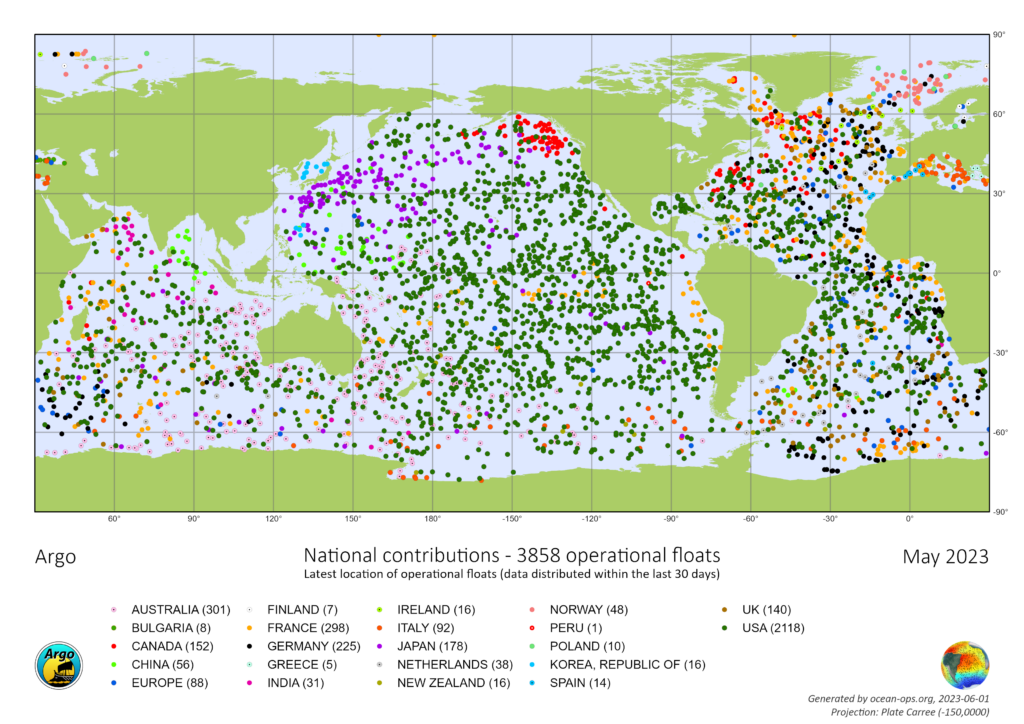
The data based on millions of satellite observations and hundreds of thousands of Argo Float profiles of ocean temperature, salinity and density suggests that the driver of major ocean currents distributing excess heat around the world has stopped working because it is choked with relatively hot and relatively fresh water.
In the past water flowing into the polar regions was quite salty because a lot of moisture evaporated from the surface in tropical and sub-tropical regions, leaving the salt behind to make the water more dense. However, because the water was hot the density was somewhat lowered due to thermal expansion it stayed on the surface because it floated over the surface of cooler but fresher water. As the salty water flowed into polar regions it cooled enough that even though it was being diluted by precipitation and runoff from melting snow and ice on the land, the cooling and increasingly diluted water become dense enough sink under the warm salty waters drawn towards the poles by the sinking polar waters. This circulation also carried oxygen into the depths and nutrients from the depths towards the surface in areas where deep water wells up to replace the surface water flowing towards the poles in tropical and temperate areas.
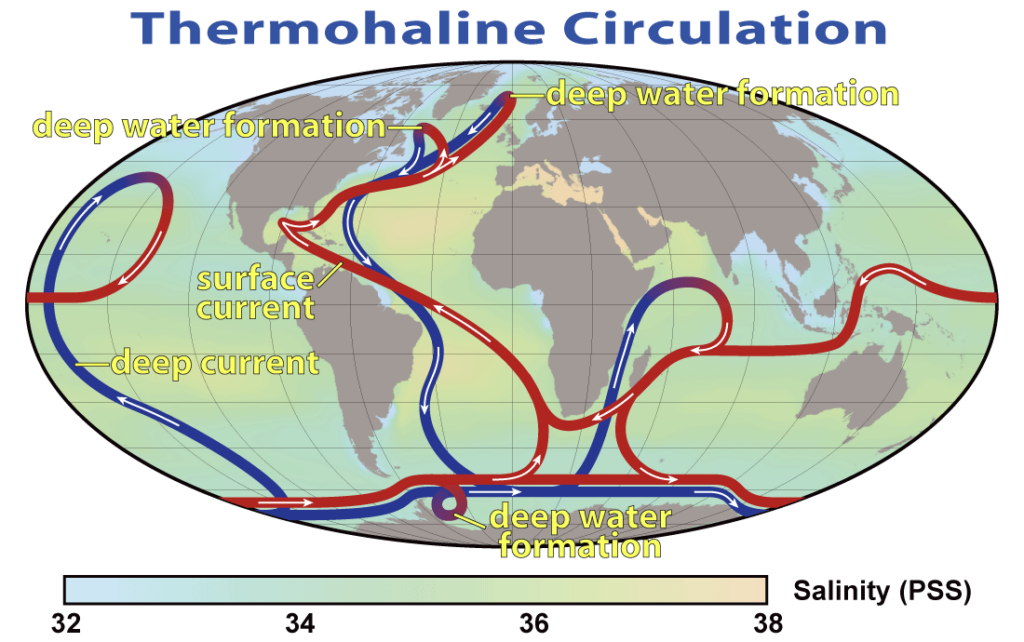
However, as global average temperatures rise and more heat is trapped in the ocean evaporation everywhere puts more moisture into the air that falls as rain in tropical and subtropical areas, diluting the warmer ocean surface waters. In polar and sub-polar areas the increased moisture greatly increasing the runoff from the land from rain and melting snow and ice, that further dilutes the increasingly diluted ocean surface water flowing into polar regions from tropical and subtropical areas.
The result is that the thermohaline conveyors driving the major ocean currents are probably being choked and possibly being completely stopped by masses of water that are too hot and dilute to sink. Even worse, the warm dilute water washing against the ice sheets and glaciers reaching the ocean melts ice at an increasing rate making the surface waters even fresher.

Denmark’s Polar Portal (below) shows the melting of the multi-year Arctic sea ice from its winter peak in June 2004 until now. [Click the picture to load the live site, scroll up to to see the “Sea Ice Thickness and Volume” title. Note the grey slider bar below the map. Click the “Animate Monthly” to load the animation — which will take some time to download the data. You may use the slider to scroll through the series of monthly maps, or you can control buttons below the slider to start and stop the animation or step back or forward one month at a time. The red color represents multi-year ice around 4 meters thick, lavender to blue ice is single year ice less than about 1.5 m thick.]

Note, there is an interesting but deadly physical twist here: As water temperature drops below 4 °C cold/freezing fresh water floats on top of warmer relatively salty water, and freezes-over in the winter at higher temperatures than saltier water. Paradoxically, floating ice and snow accumulating on the surface actually insulates the lower layer of warm salty water from further cooling, where the winter surface temperature may be 20-50 °C below freezing. However, the fronts of large glaciers flowing into the ocean may be grounded hundreds of meters below sea level or floating on even deeper warm water(!). This means they will still be melting rapidly from the bottom up even in the dead of winter when fresh water is freezing. The ice melt dilutes the polar oceans even more – so say nothing of raising sea levels that will, in turn, lead to the floating of glacier fronts, exposing even more areas to melting.
What is happening as I write this warning?
If you follow the threads and commentary attached to these tweets here, the links show what was happening a week ago.
The following Guardian articles highlight the existential risk we are facing.
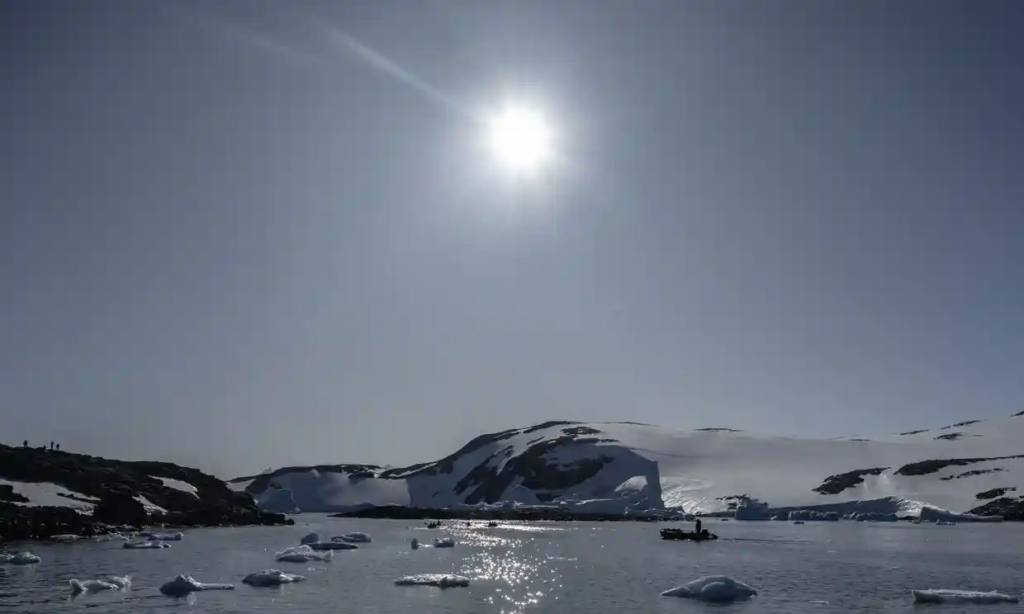
Graham Redfearn – 30/03/2023 in The Guardian
Melting Antarctic ice predicted to cause rapid slowdown of deep ocean current by 2050
New research by Australian scientists suggests 40% slowdown in just three decades could alter world’s climate for centuries.
[Actually, the data presented here suggests that as of the last three months or so this stoppage has already begun!]
Melting ice around Antarctica will cause a rapid slowdown of a major global deep ocean current by 2050 that could alter the world’s climate for centuries and accelerate sea level rise, according to scientists behind new research.
The research suggests if greenhouse gas emissions continue at today’s levels, the current in the deepest parts of the ocean could slow down by 40% in only three decades.
This, the scientists said, could generate a cascade of impacts that could push up sea levels, alter weather patterns and starve marine life of a vital source of nutrients.
Read the complete article….
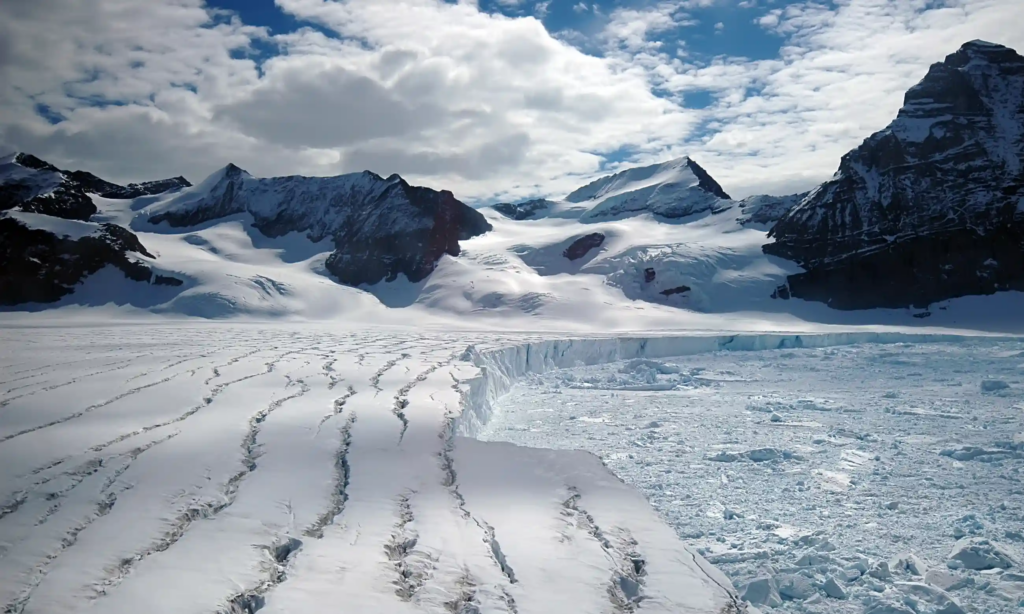
Graham Redfearn – 05/03/2023 in The Guardian
‘Everyone should be concerned’: Antarctic sea ice reaches lowest levels ever recorded
With the continent holding enough ice to raise sea levels by many metres if it was to melt, polar scientists are scrambling for answers.
For 44 years, satellites have helped scientists track how much ice is floating on the ocean around Antarctica’s 18,000km coastline.
The continent’s fringing waters witness a massive shift each year, with sea ice peaking at about 18m sq km each September before dropping to just above 2m sq km by February.
But across those four decades of satellite observations, there has never been less ice around the continent than there was last week.
…
“We are seeing less ice everywhere. It’s a circumpolar event.”
In the southern hemisphere summer of 2022, the amount of sea ice dropped to 1.92m sq km on 25 February – an all-time low based on satellite observations that started in 1979.
Read the complete article….
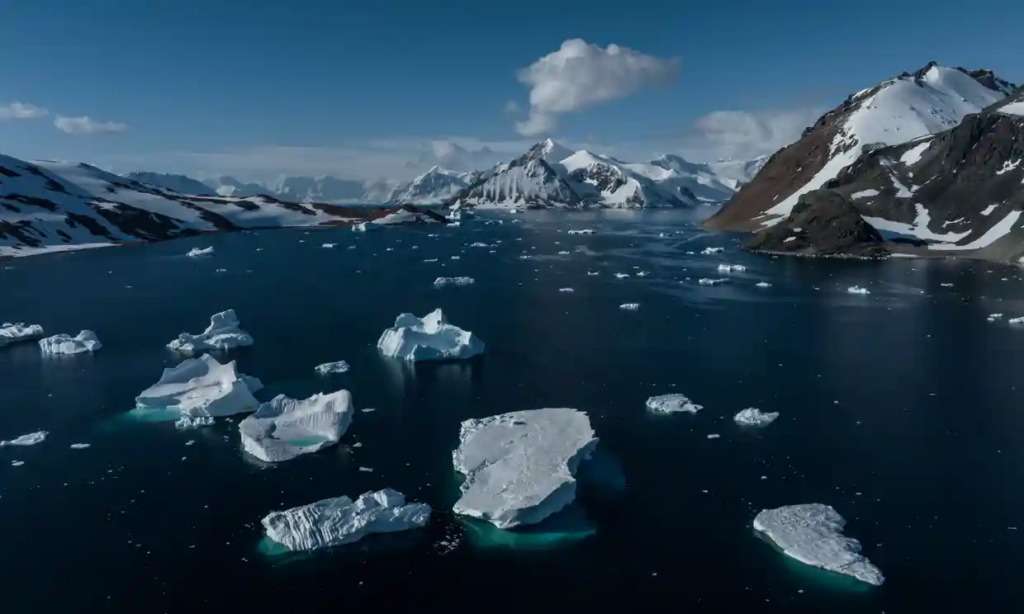
Donna Lu – 26/05/2023 in The Guardian
Slowing ocean current caused by melting Antarctic ice could have drastic climate impact, study says
The Southern Ocean overturning circulation has ebbed 30% since the 90s, CSIRO scientist claims, leading to higher sea levels and changing weather.
A major global deep ocean current has slowed down by approximately 30% since the 1990s as a result of melting Antarctic ice, which could have critical consequences for Earth’s climate patterns and sea levels, new research suggests.
Known as the Southern Ocean overturning circulation, the global circulation system plays a key role in influencing the Earth’s climate, including rainfall and warming patterns. It also determines how much heat and carbon dioxide the oceans store.
Scientists warn that its slowdown could have drastic impacts, including increasing sea levels, altering weather patterns and depriving marine ecosystems of vital nutrients.
Read the complete article….

Markus Noll – 23/05/2023 in EarthArXiv
Exponential life-threatening rise of the global temperature
Global temperatures are rising. This paper demonstrates for the first time that the global temperature increase has not been linear but is exponential with a doubling time of about 25 years. Both the amount of carbon dioxide produced by the combustion of fossil fuels and the amount of carbon dioxide in the atmosphere have also risen exponentially, with a similar doubling time. The exponential trajectories of rising global temperature, carbon dioxide emission, and atmospheric carbon dioxide concentration support the idea that all three are entirely man-made. This analysis shows that during the past 70 years, the increasing use of fossil fuels results more from human activities than population growth, and that reducing the use of fossil fuels by 7.6% each year, the “7.6%-scenario”, can prevent annual global temperatures from surpassing pre-industrial temperatures by 1.6°C, a critical threshold to sustaining life on Earth.
Read the complete article….
Driven by exponentially increasing global temperatures, this process is also very likely to be accelerating at an exponential rate (doubling time of about 25 years).
Or worse!
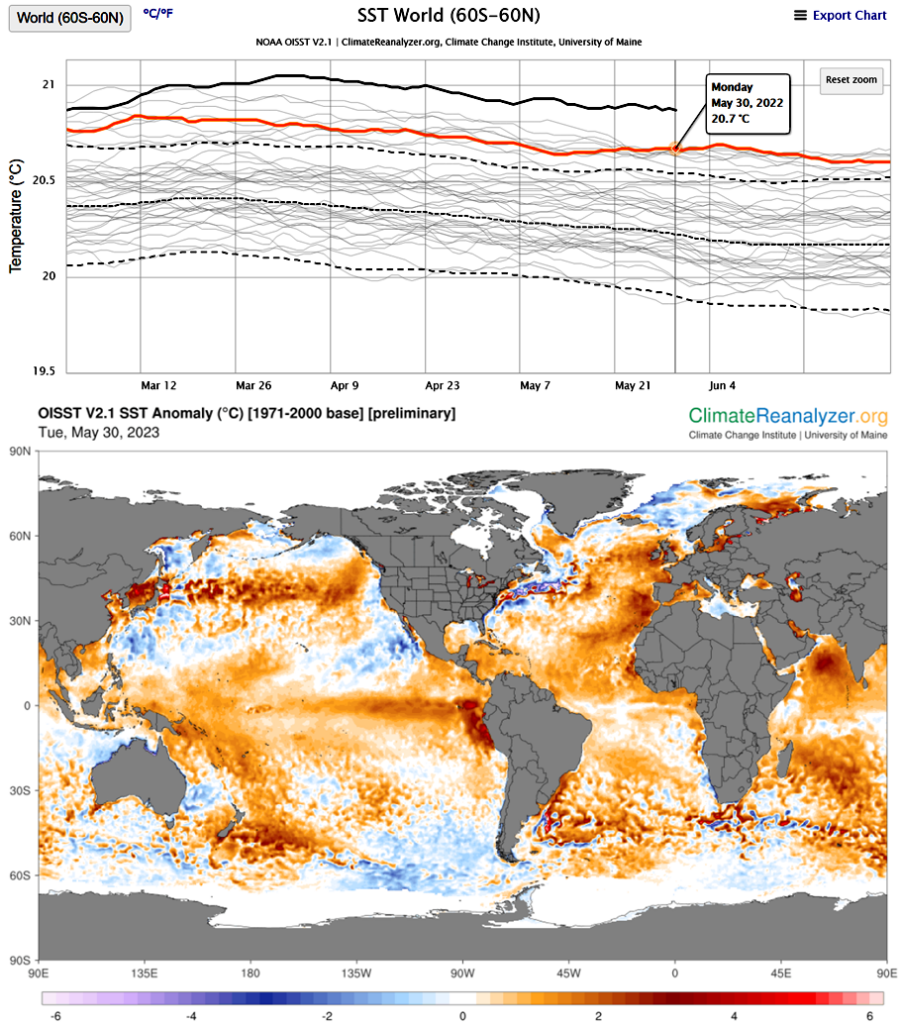
What I think we are seeing in this data is that we have crossed a chaotically discontinuous ‘tipping point’. Prior to March 12, the thermohaline circulation was slowing as surface waters were gradually becoming warmer and more dilute, and thus less dense, decreasing the sinking rate of the cooling warm salty water that was driving the circulation. Around March 12, the surface waters actually became less dense than the deeper waters and thus stopped sinking at all to begin piling up in the polar regions where they would increase the rate of ice melting to be diluted still further.
With no sinking water to keep the the thermohaline circulation working, it has effectively been jammed and we are now in a totally new climate regime that is likely to get a lot hotter, a lot faster.
If this isn’t a climate emergency, I don’t know what is.
As at May 30, the heat anomaly is still growing. The average surface temperature of the World Ocean is a good 0.2 °C hotter than it has been on this day since the satellite records began in 1979; and it is only 0.1 °C cooler than the hottest temperature ever recorded in this era for any time of the year.
Featured Image
Figure from https://twitter.com/LeonSimons8/status/1663936433801887744/photo/1. “Will a Super El Niño materialize like in 1997 and 2015? What will that mean for global Sea Surface Temperatures? And for global and regional weather extremes?” This seems to be answered by https://twitter.com/LeonSimons8/status/1663195220207362048/photo/1

