March & April 2024 climate extremes threaten doom
If we don’t reverse the climate system’s growing energy imbalance it will soon drive us over the lethal fall into global mass extinction
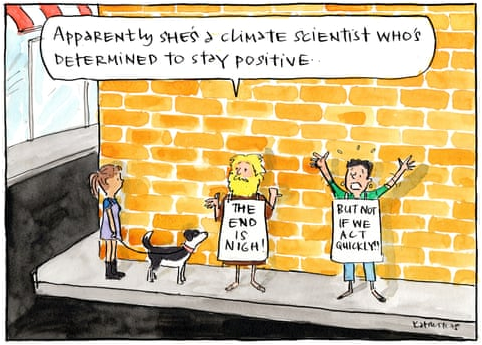
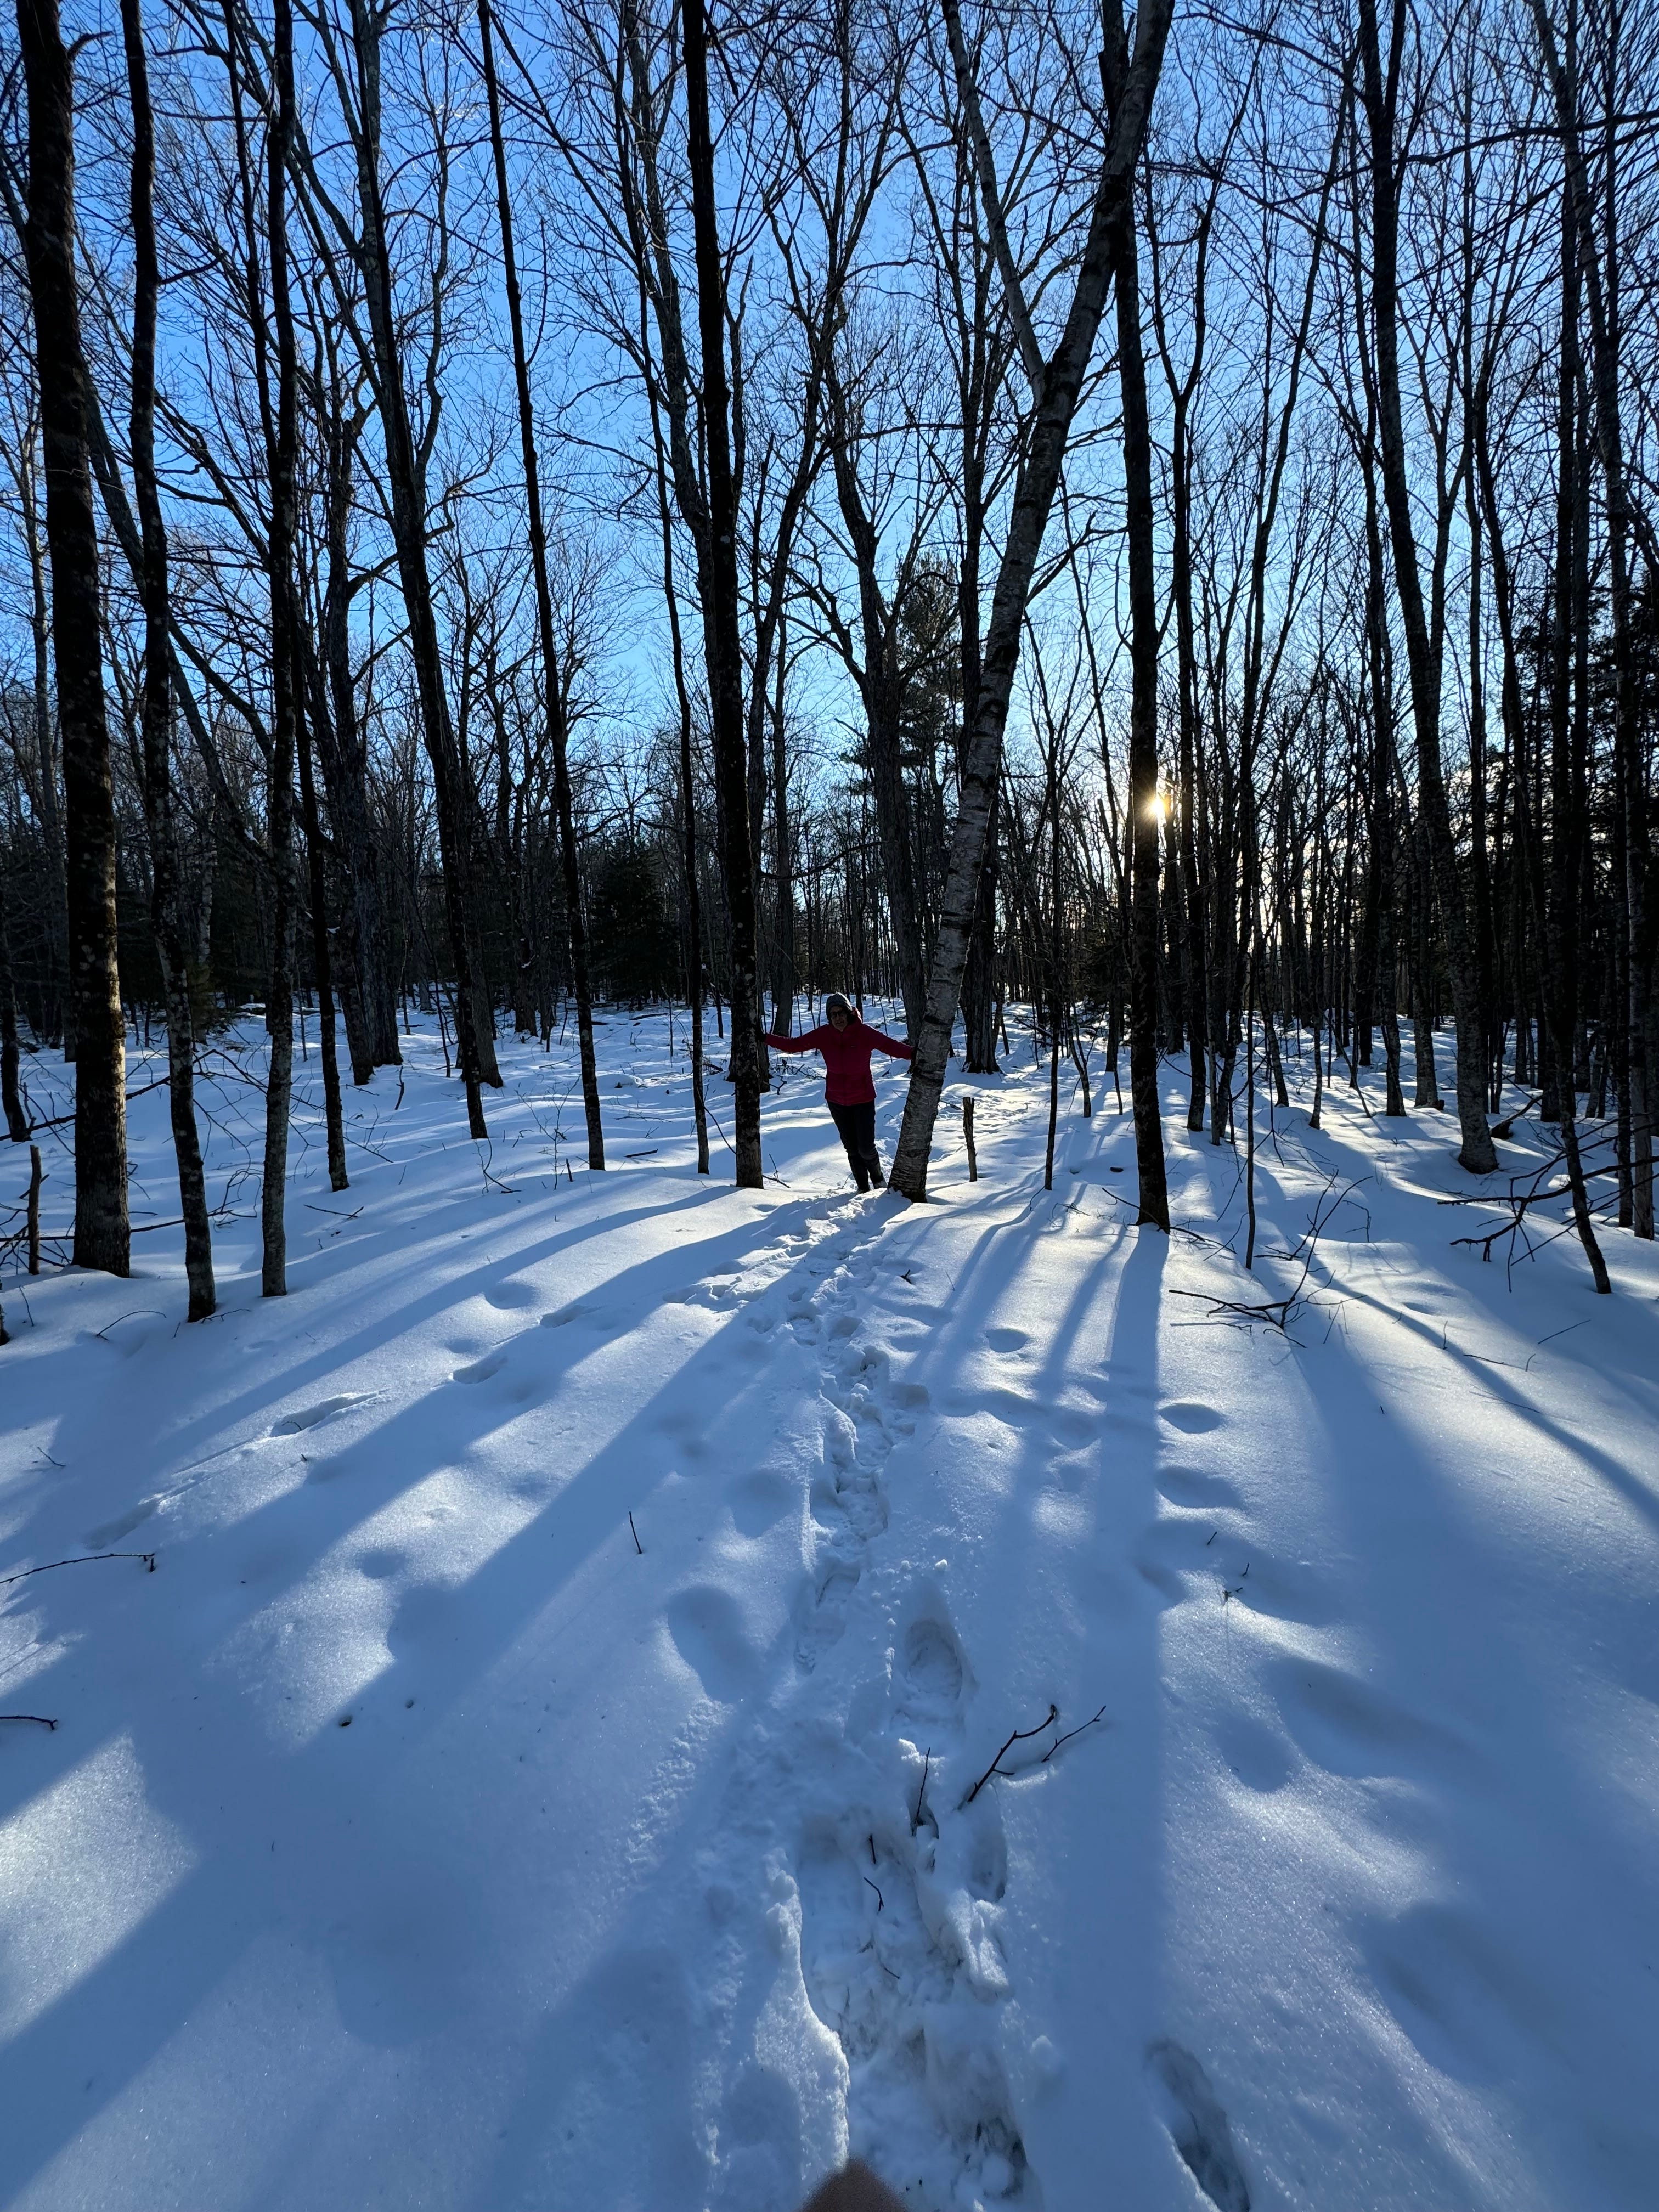
ALL the global climate indicators are at or near all-time records so extreme that by September last year staid climate professionals have called the readings “gobsmackingly bananas.” — a phrase that is now in common usage in the climate science community. To some, the readings spell doom is nigh. But, here, i’m with the Guardian’s Fiona Katsaukas and her friend in the green shirt.
These gobsmacking records bear witness that Earth’s climate system has shifted into a new kind of rapidly evolving climate regime that is not encompassed or anticipated by existing climate forecasting models (at least not before 2050…). Every month since September has set new, still more extreme records.ALL the global climate indicators are at or near all-time records so extreme that by September last year staid climate professionals have called the readings “gobsmackingly bananas.” — a phrase that is now in common usage in the climate science community. These records bear witness that Earth’s climate system has shifted into a new kind of rapidly evolving climate regime that is not encompassed or anticipated by existing climate forecasting models (at least not before 2050…). Every month since September has set new, still more extreme records.
In 1985, the renowned planetary systems scientist and cosmologist (also one of the best communicators of hard science to the public the world has known), Karl Sagan addressed the U.S. Senate Environment and Public Works Subcommittee on Hazardous Wastes and Toxic Substances hearing on the greenhouse effect to explain the then scientific understanding of global warming. The 17 minute video on YouTube of his speech is extracted here by C-SPAN. C-SPAN also has the full 2 hour, 24 min video of the hearing. I mention this to triply underline the fact that the science of global warming and its consequences was already clearly understood four decades ago. The only fault in Sagan’s exposition is that the predicted dire consequences are happening sooner than he anticipated. This is still a common problem in climate science today where most climatologists trained in maths or physics still fail to appreciate the importance of fundamental non-linearity and chaos of complex dynamical systems like climate. The existential emergency Sagan predicted for the latter half of the 21st Century has already started now.
Because the [greenhouse] effects occupy more than a human generation there is a tendency to say that they are not our problem. Of course, then nobody’s problem, not on my tour of duty, not on my term of office… It’s something for the next century. Let the next century worry about it. But the problem is that the greenhouse effect is one of them which have long time constants. If you don’t worry about it now, it’s too late later on; and so in this issue, as in so many other issues, we are passing on extremely grave problems for our children when the time to solve the problems if they can be solved at all is now.
Carl Sagan, 1985, transcribed from C-SPAN video [2:30-3:15]
Today’s screams heard now from continually breaking climate records are the realities anticipated 39 years ago in this address;
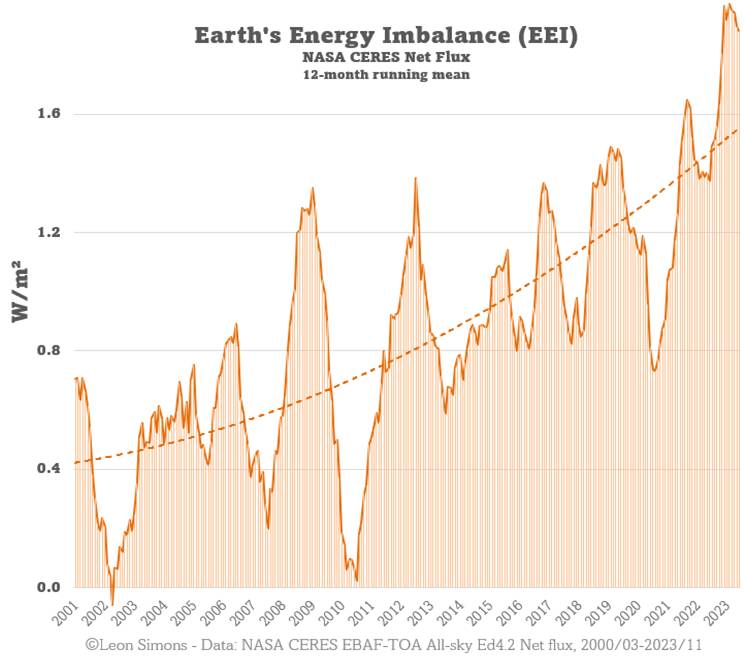
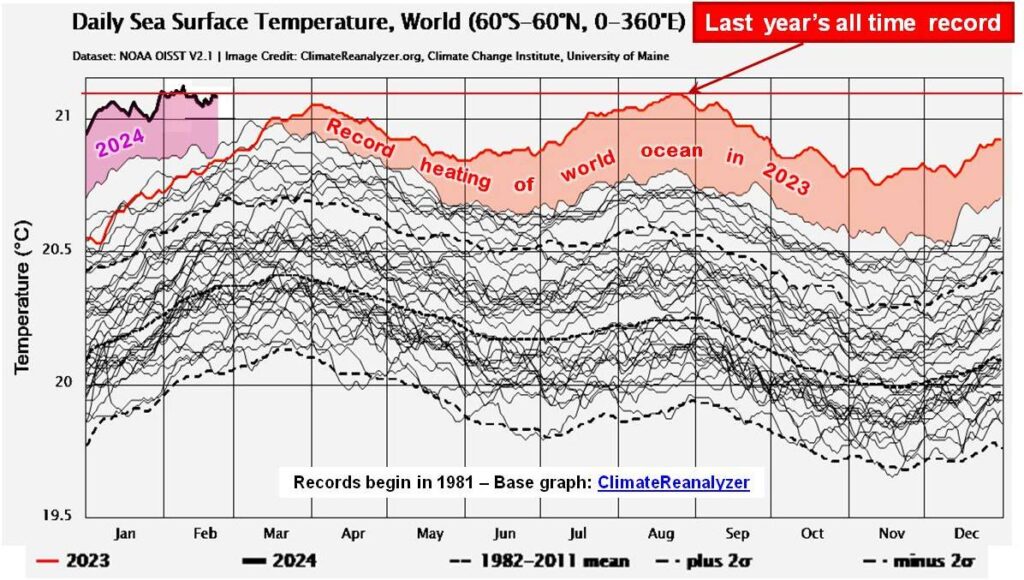
In my “Feb. 2024 climate extremes” report (published March 12) I review the records as they were being broken in the February peak of the global climate cycle. I am currently trying to finish an update on the first anniversary of setting continuous daily record high global sea surface temperatures. detailing the piling up energy flows through the climate system (as described by Sagan) from the time solar energy is absorbed in the climate system and is eventually emitted back to space in the form of infrared emissions leaving the Earth. I have posted the current state of the first part, “Considering the first anniversary of a new climate regime — Accelerating down the road to extinction in Earth’s Hothouse Hell?” in the Google Docs format (that everyone should be able to read). Completing this is difficult because many indicators are literally breaking records faster than I can write about them. The most important of these regularly breaking records is the daily average sea surface temperature (SST), which is the first place excess solar energy piles up in the climate system. On 9 May SST is still more than 0.1 °C above 2023’s 9 May record – the 423 day of continuous daily records. The graph below focuses mainly on the part of the years where this year’s record is on top of last year’s. Note that Sagan also predicted rapidly rising sea levels. Today’s Washington Post describes how the southeastern US is currently being affected by this rise (probably because hot water is being backed up in the slowing Gulf Stream).

However, so people can see the evidence that is driving us here in @VoteClimateOne to do what we can to fight the emergency, I have also been posting to X-Twitter, and I include a couple of samples here:
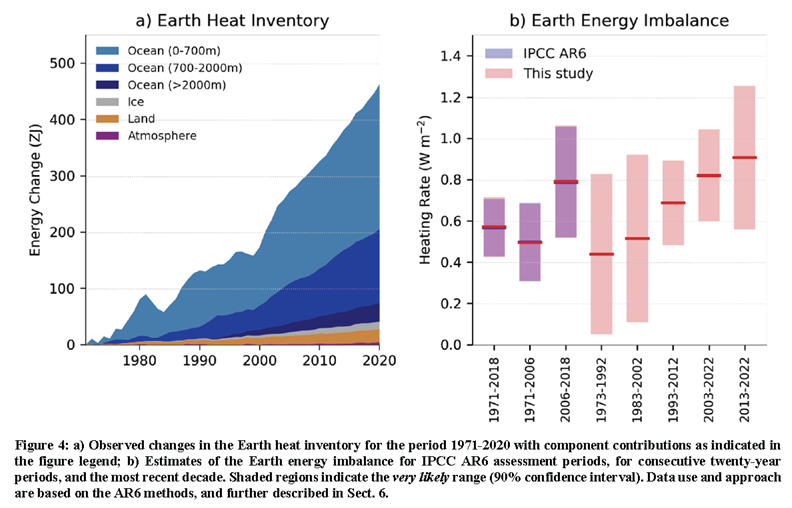
As ever increasing numbers of climate scientists and aware commentators are crying out that it is time to sound the emergency alarms and urgently mobilize to fight the global emergency while there is still some chance that with our far greater knowledge and more powerful science than Sagan knew about (he suggested that by now it would be too late to stop the inevitable catastrophic end), it might still be possible for us reverse the solar energy imbalance that is rapidly driving our planet’s temperatures towards runaway feedbacks that will ensure global mass extinction is truly under way before the end of the 21st Century.
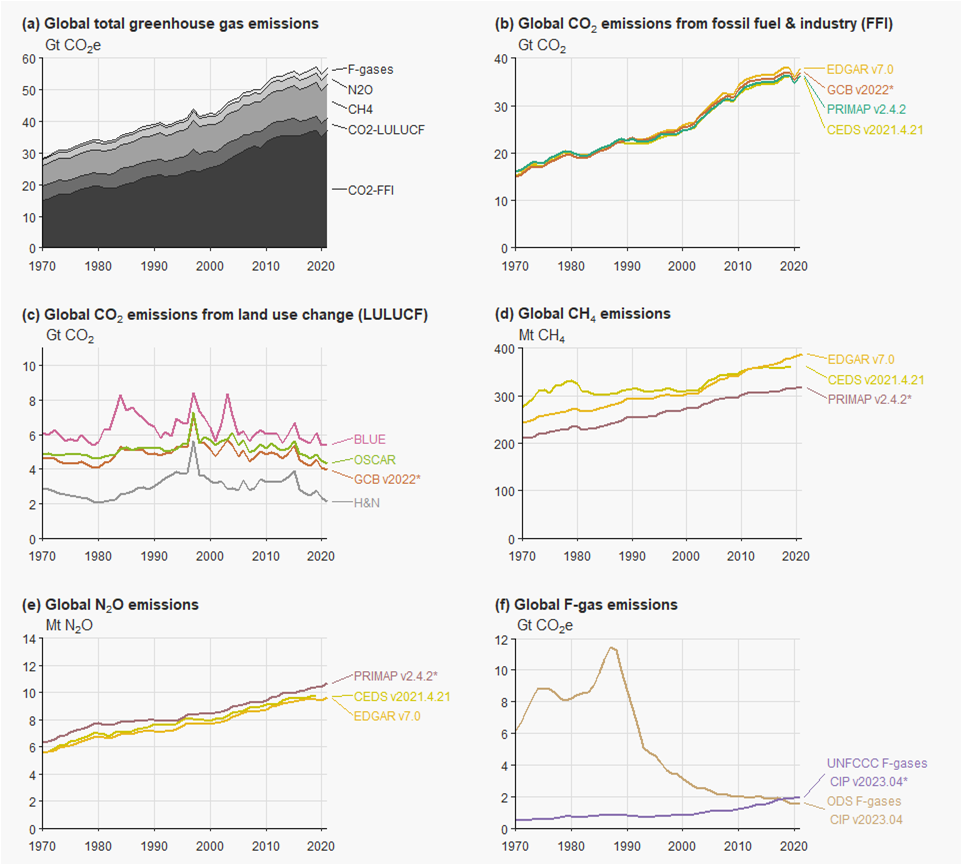
Another new fact in today’s in box hit me in the face. The record high rate of increase in CO₂ causing a majority the backup of the solar energy that is cooking us is still ACCELERATING UPWARDS at a record high RATE OF ACCELERATION. To me this suggests that runaway warming driven by positive feedbacks with temperature has well and truly started. ‘Natural’ emissions are already coming out of the ground, permafrost, wetlands, forests, and oceans faster than we are reducing fossil fuel emissions.
I’m like the girl in the green shirt in Katsaukas’s cartoon. I think it is well and truly time to sound all the emergency alarms and start total global mobilization to fight the crisis. My knowledge and experience tell me that if enough of us are willing to accept the reality of the danger and work together as a disciplined emergency force, we have sufficient knowledge and technological prowess to turn off the road to extinction and find some way to sustain at least some of the living world we know today.
Born in 1939, I’m old enough to remember living in a blacked out house in Los Angeles, and then the successful ending of WWII in 1945 little more than 4 years after America mobilized and joined the war at the end of 1941. At least in 1941-42 Americans managed the kind of mobilization we need today. I think we might still be able to defeat the runaway warming enemy if we start soon enough and fight hard enough to find a place in a still sustainable biosphere. On the other hand, I’m as close to certain that if continue to avoid looking at the grim and (for some) terrifying reality in hopes of continuing with business as usual, we will be burning up in the midst of the worst global mass extinction (i.e., even worse than the End Permian extinction ~ 250 million years ago).
As well as learning about global mass extinction when I learned to read from my father’s university textbooks in geology and paleontology, I grew up in navy towns started university as a pre-engineering student before changing my major to zoology and earning my PhD in evolutionary biology as well as teaching a variety of genetic, organismic, systems and population biology courses. I also worked professionally as a radiation ecologist and for the last 17 years before ‘retiring’ I designed a variety of documentation and knowledge management systems for Australia’s then largest defense engineering company. There, my systems helped ensure the on-time, on-budget completion of the ~7 billion $AU ANZAC Ship Project. (This is one of the very few large defense projects in world history that did not end up years overdue and billions of dollars of cost overruns, thanks in good part to systems I designed specifically to solve the kinds of management and engineering change issues that defeat most large defense projects). Finally in retirement I have spent some 15 years researching and writing on the coevolution of humans and our technologies prior to deciding that doing what I could to address the climate crisis was far more important than finishing a book for a society doing nothing to save itself from extinction.
In @VoteClimateOne.org we have thought a lot about what we can do to help the mobilization. It is clear that most governments in the world today are being run by fools, useful idiots, or puppets owned and led by already insanely rich fossil fuel and other special interests will do or say almost anything to gather more wealth. Political party discipline means that a majority government can be controlled by a handful of ‘strong’ party members and functionaries in leadership roles. For example, in Australia, the supposedly ‘climate friendly’ Labor majority government has just demonstrated its fealty to its puppet masters over effective climate action.
@VoteClimateOne.org has a two-pronged approach to try to change governments into supporters and even leaders of the climate emergency mobilization effort.
Given how urgent the need for action is, we hope to convince the puppets and other blockers that climate action is far more important and urgent than whatever benefits they gain from catering to the desires of their patrons and masters. However, this will take a massive effort – much more than just supplying truthful information that is easily ignored or actively denied. Minds might be changed if enough people piled on each and every recalcitrant parliamentarian – but this would take the concerted action of a large number of climate and environment action groups that has to this point not been forthcoming.
The other prong in the spear, is to actually replace enough of the recalcitrant parliamentarians with progressive community representatives or small party members who truly understand and accept the crisis and the need for action; and who are willing to put in the effort to get elected — to prevent either major party from forming a majority government. Not only will there be more sensible and effective parliamentarians, but any party forming government will have to listen to and compromise with genuine community representatives to do anything, even if this requires them to mobilize an effective climate action.
Our home page, ACT NOW, and TRAFFIC LIGHT VOTING explain how this all works, and provides examples of how we have addressed past elections. Hopefully all voters will have the chance to see and think about what these pages have to offer, and inform their voting decisions with the climate crisis in mind. As elections approach, CLIMATE SENTINEL NEWS will be providing frequent updates on the state of the climate and relevant political news.
Our grandchildren tell us all to “vote climate one” so they can have a happy future rather than the descent into Earth’s hothouse hell (like Sagan and most climate scientists until the last few months, the authors of the referenced paper have overestimated just how much time we have left for effective action).
WE MUST BEGIN ACTION NOW!