On Saturday the Sea Surface Temperature (SST) was less than 0.1 °C below last year’s record set in August. Traditionally the global peak temperature for the year is reached in March. This year will probably be well and truly off this chart, yet humans are still burning fossil fuels at an increasing rate driving us ever faster towards global mass extinction in runaway warming as polar permafrosts and retreating ice-sheets release vast stores of soil carbon as methane and CO2.
Note that about 90% of the excess solar energy absorbed by our planet goes into the upper layers of the oceans before being redistributed via increased atmospheric humidity and heat to fuel increasingly extreme and lethal climates and weather events.
The only hope our species has to stop this apocalypse is to reverse greenhouse emissions (stop new emissions and ‘draw down’ and sequester some of the existing excess) and reflect more solar energy away from Planet Earth.
Isn’t it time we made our governments work towards this rather than increasing the obscene profits of their mates and patrons in the fossil fuel industries?
If you want more evidence in favor of this choice, please read my past posts on Climate Sentinel News. As well as using your vote effectively, Vote Climate One suggests a number of things you can do between elections to pressurize your governments to work with you (rather than against) to solve the climate emergency.
“The Copernicus report said if December records a similar temperature anomaly to November, the average temperature for 2023 will be 1.48 degrees above the pre-industrial reference level.”
Chances are that if December is significantly hotter than November, Earth will break the 1.5 °C ‘barrier’ this year, that COP 28 is supposedly working towards stopping…… See the featured image here from the ABC article (“Global temperatures in 2023 are tracking well above every other year on record. / Supplied: ERA5/C3S/ECMWF)”
ABC gives the facts below. Climate Sentinel News has spent many months reporting how continued warming will result in near term human extinction (i.e., possibly within the currently expected lifetimes of humans living today). We suggest that you review these warnings and take them very seriously indeed, and work collectively to force our governments to immediately force the fossil fuel industry to stop carbon emissions of all kinds.
Yes, we will probably need to implement energy rationing while sustainable resources are ramped up. However, this is better than allowing Fossil Fuel control our governments and condemn Earth life to global mass extinction.
Globally averaged surface air temperature anomalies relative to 1991–2020 for each November from 1940 to 2023. (ERA5/C3S/ECMWF via ABC)
Scientists have confirmed 2023 will be the hottest year on record, with the official declaration from climate change service Copernicus, run by the EU, made with a month to spare.
The startling heat records come as large parts of Australia are set to endure heatwave conditions, with temperatures expected to reach over 40 degrees in some places.
The world can’t stop breaking heat records this year, with each month since June becoming the warmest on record.
The Copernicus data confirmed the trend, with the warmest November on record globally hitting 1.75 degrees above the 1850–1900 pre-industrial reference period….
Storm Daniel’s inundation of Greece’s agriculture (when complete records for gauges knocked off line by flooding were retrieved later, it was reported that Zagora actually received more than a meter of rain from the storm);
and then a couple of days later, the same storm Daniel caused an apocalyptic flash flood that completely erased the heart of the Libyan city of Derna, along with perhaps 13,000 of its ~130,000 inhabitants (the actual counts will never be known because of incessant warfare between the various heavily armed fundamentalist Islamic sects and warlords).
Even worse for me personally, has been the fact that people in general paid virtually no attention to or showed any understanding of the significance of these and many other comparably extreme climate events and situations requiring emergency action.
Also, more specifically, the Derna situation was so extreme that I could not understand how a single overnight flash flood could comprehensively erase the fundamental infrastructure and fabric of a modern city — even given the fact that two earth-fill embankment dams were also almost completely erased in the process. Most people have blamed the cataclysm on the failed dams, making it easy to gloss over the fact that the dams were casualties not causes. Thus, I have felt compelled to spend my time forensically studying the vast array of imagery of the Cyrenaican region of Libya where Derna is located before, during, and after the flood(at resolutions down to 25-50 cm), press photography, drones, and ‘witness’ reports on social media to determine what actually happened.
Briefly summarizing what I have determined so far:
Derna was built on a relatively flat fossil delta whose seaward edge is 7-8 m above sea level, such that all runoff falls over sea-cliffs to reach the Mediterranean sea. The imagery of damage to surviving buildings more than 200 m from the banks of the normally dry wadi running through the city convincingly shows major flood damage up to the 3rd or even 4th floors. On the evening of Sept. 10 when the rain started the wadi reached the ocean via a 6 m drop at the delta’s edge. On Sept. 11 as the flash flooding was receding, the now uniformly sloping wadi floor reached sea level ~ 450 meters inland from where its spout had been the night before.
Making sense of this data has not left me time to continue reporting disasters that have little historical context and no one seems interested in reading about unless they are personally affected by them.
However, Derna’s long history tracing back to its settlement by Greeks around the middle of the 7th Century BC, and some strong geological markers I now understand give some very solid evidence regarding the extreme nature of the recent event. Also, around 650 AD three of the Prophet Mohammad’s followers who were martyred along with ~ 67 fighters in the First Islamic Conquest of North Africa were buried on the bank of Wadi Derna. Their graves have been marked and venerated since then and memorialized with proper shrines and then eventually with Derna’s largest mosque. Overnight on Sept 11, the shrines, the graves, and “meters” of soil below where the graves had been were erased in the cataclysm. That’s evidence that Derna never had a comparable flood in a millennium and a half.
The geological evidence is orders of magnitude more extreme: Deltas form at sea level. The last time the sea level was 7-8 m higher to enable the formation of the present deltas was during MIS 5e in the Eemian era of the Last Interglacial Maximum around 123,000 (or less likely 118,000) years ago. The geological history of Cyrenaica shows that this area has been very stable over this period, suggesting that the three fossil deltas (including Derna’s) found along this part of the Cyrenaican coast could not have been formed any more recently than 118,000 years ago! Until Sept 11, the wadi’s that built the deltas reached the sea via spouts 5-7 m above sea level. As is the case for Wadi Derna, the other two wadis also eroded beds beds to reach sea level significantly inland from the elevated spouts that existed the day before. This is rock solid evidence that the last time weather was this extreme was more than 100,000 years ago, i.e., 100 millenniums ago when the deltas were built!
This work should be published before the year is done, when we’ll be gearing up for more elections.
In any event, if we don’t stop and reverse the still accelerating global warming, we can expect even worse to come as air and ocean temperatures continue to rise to extremes not seen for millions of years.
The farce of COP28 shows that the only way this reversal will happen is if concerned citizens can take back control of our governments from the fossil fuel special interests. To do this a majority of people must convince or replace their elected representatives to actually work for their survival rather than working to feed the greedy special interests.
Notable observations and news items from the Web, with no processing and little in the way of comment. Make of them what you will.
Leading up to this September’s extremes
Firefighters flying over a controlled burn to fight wildfires in Canada’s Quebec Province. Photograph: Genevieve Poirier/Societe De Protection Des Forets/AFP/Getty Images (from the article)
From June to August 2023, a series of extreme weather events exacerbated by climate breakdown caused death and destruction across the globe.
As the world sweltered through the hottest three month spell in human history this summer, extreme weather disasters took more than 18,000 lives, drove at least 150,000 people from their homes, affected hundreds of millions of others and caused billions of dollars of damage.
That is a conservative tally from the most widely covered disasters between early June and early September, which have been compiled in the timeline below as a reminder of how tough this period has been and what might lie ahead.
How much are these extremes costing society. For an idea see the following graphic from Scientific American’s blog. Note: this graphic applies only to the US,
https://www.theguardian.com/environment/2023/aug/28/crazy-off-the-charts-records-has-humanity-finally-broken-the-climate Warning: Data is provided for this article by climate scientists who suffer from the reticence causing academic and institutional scientists to downplay any overly ‘dramatic’ warnings in order to avoid alarming departmental colleagues, administrators, or governments influencing hiring, promotion, financial support for research, etc. Google “scientific reticence” and you will find lots of evidence on how it works.
The current extremely low sea ice will have a range of impacts. Changed ocean stratification and circulation will alter basal melting beneath ice shelves48. Greater coastal exposure will increase coastal erosion and reduce ice-shelf stability49. Changes in dense shelf water production will alter bottom water formation and deep ocean ventilation50. Sea ice changes will also have contrasting influences on Adélie and emperor penguin colonies51,52, and substantially alter human activities along the Antarctic coastline.
Anthropogenic greenhouse gas emissions have been attributed as the primary cause of Southern Ocean warming, and here we suggest a potential link to a regime shift in Antarctic sea ice. While for many years, Antarctic sea ice increased despite increasing global temperatures6, it appears that we may now be seeing the inevitable decline, long projected by climate models53. The far-reaching implications of Antarctic sea ice loss highlight the urgent need to reduce greenhouse gas emissions.
Off the previous chart, again…. In 12 days another ~500,000 hectares have burned! Will the burning stop for winter? What does this portend for Australia’s upcoming El Nino summer?
The record for the 23rd blew the Canadian system’s off the chart! The following chart from Copernicus, the EU’s equivalent of NASA, that operates the satellites, suggests the data from the 23d is probably a real record of what the satellites actually recorded. In most years the wildfires would have been more-or-less through for the year. Yet 23 Sept shows BY FAR the largest number of hotspots recorded for the year so far, previous highs being 9269 for June 22 and 9692 for July 13.
For the latest Natural Resources Canada tabulation, see https://cwfis.cfs.nrcan.gc.ca/maps/fm3?type=arpt. Note 1: the current version of the total burned area chart can be seen by scrolling down to the bottom of the table accessed by this link.
Note 2: the following Guardian chart was PUBLISHED on 22 Sept.
Note: warmer winter temperatures allowed mountain pine beetle populations to grow explosively through this region due to additional reproduction of adult beetles that were normally killed off by hard freezing winters. I did several Facebook posts in 2016 and 2018 on the increasing fire hazard this would create until the dead biomass was removed. This year’s extreme temperatures facilitated this!
The Canadian 🔥 season is not yet done but I have a few URGENT questions we must address. 1. How many of these fires will burn underground overwinter and emerge as spring zombie fires? 2. How much extra permafrost will thaw because of this year’s severe burning? #ClimateCrisispic.twitter.com/Ih0ilRHQ6Q
[Note that 2020- Siberian wildfires plus this years’ wildfires in the Canadian Arctic Zone probably produced massive increases in permafrost GHG emissions beyond what was happening during the years included in this survey.]
Map of northern permafrost extent (data from Obu et al. 2021) overlain with the spatial extent of the permafrost domain included (BAWLD-RECCAP2 regions). The spatial extent of the permafrost region de ned in this study as an overlap of permafrost extent and the Boreal Arctic Wetlands and Lakes Dataset (BAWLD, Olefeldt et al. 2021a,bScheme of annual atmospheric GHGs exchange (CO2, CH4, and N2O) for the ve terrestrial land cover classes (Boreal Forests, Non-permafrost Wetlands, Dry Tundra, Tundra Wetlands and Permafrost Bogs); inland water classes (Rivers and Lakes). Annual lateral fluxes from coastal erosion and riverine fluxes are also reported in Tg C yr-1 and Tg N yr-1. Symbols for fluxes indicate high (x>Q3), medium (Q1<x<Q3), and low (<Q1) fluxes, in comparison the quartile (Q). Note that the magnitudes across three di erent GHG fluxes within each land cover class cannot be compared with each other.
ClimateReanalyzer
Stationary anomaly, somewhat hotter on 23rd than 22nd
https://www.theguardian.com/environment/2023/sep/11/us-record-billion-dollar-climate-disastersNote, as the frequency, extent, and ferocity of climate disasters continue to increase with accelerating global warming, newer disasters will overlap and add to destruction from previous disasters where there has not been enough time to complete repair and remediation leading to the accelerating accumulated climate damage — until society no longer has the resources to continue repairing and replacing what has already been repaired and replaced. At this point social collapse is inevitable…… We must stop and reverse the process of global warming that is causing this or face near-term extinction.
11 September 2023 – Coming out of winter — not a good look for the rest of the year in Australia!
In February 2023, Antarctic sea ice set a record minimum; there have now been three record-breaking low sea ice summers in seven years. Following the summer minimum, circumpolar Antarctic sea ice coverage remained exceptionally low during the autumn and winter advance, leading to the largest negative areal extent anomalies observed over the satellite era. Here, we show the confluence of Southern Ocean subsurface warming and record minima and suggest that ocean warming has played a role in pushing Antarctic sea ice into a new low-extent state. In addition, this new state exhibits different seasonal persistence characteristics, suggesting that the underlying processes controlling Antarctic sea ice coverage may have altered. [my emphasis]
a Antarctic monthly sea ice extent (SIE) anomaly time series from the National Snow and Ice Data Center over the satellite period, November 1978 to June 2023, in millions of square kilometres. Sea ice extent anomalies are calculated relative to the 1979–2022 climatology. Two change points are detected, separating the time series into three periods: November 1978 to August 2007 (grey), September 2007 to August 2016 (blue), and September 2016 to June 2023 (orange). The means of each period are shown by the horizontal lines and are statistically distinguishable. b Antarctic monthly SIE anomaly time series expressed as a percentage of the monthly climatology over 1979–2022. Periods are coloured as in (a). Record minima months occurring since 2016 are noted in (a, b). c Southern Ocean 50–65°S temperature anomaly time series from Argo over January 2004 to May 2023, in degrees Celsius. Ocean temperature anomalies are calculated relative to the 2004-2022 climatology. Dashed vertical lines show the sea ice extent change points. Stippling indicates values outside ± 1 standard deviation, where the standard deviation is calculated independently at each depth level to account for the change in magnitude of the variability with depth. Warm anomalies shown in orange and red are evident below 100 m from 2015, and at the surface from late 2016.Antarctic five-day sea ice extent anomalies in millions of square kilometres for each year from the National Snow and Ice Data Center. Sea ice extent anomalies are calculated relative to the 1979–2022 climatology. Anomalies are coloured by period as in Fig. 1: November 1978 to August 2007 (grey), September 2007 to August 2016 (blue), and September 2016 to June 2023 (orange). January to June 2023 is shown in bold orange, with the largest negative areal extent anomaly of the satellite era observed during June 2023.
Implications
The current extremely low [Antarctic] sea ice will have a range of impacts. Changed ocean stratification and circulation will alter basal melting beneath ice shelves48. Greater coastal exposure will increase coastal erosion and reduce ice-shelf stability49. Changes in dense shelf water production will alter bottom water formation and deep ocean ventilation50. Sea ice changes will also have contrasting influences on Adélie and emperor penguin colonies51,52, and substantially alter human activities along the Antarctic coastline.
Anthropogenic greenhouse gas emissions have been attributed as the primary cause of Southern Ocean warming, and here we suggest a potential link to a regime shift in Antarctic sea ice. While for many years, Antarctic sea ice increased despite increasing global temperatures, it appears that we may now be seeing the inevitable decline, long projected by climate models. The far-reaching implications of Antarctic sea ice loss highlight the urgent need to reduce greenhouse gas emissions. [my emphasis]
Key facts from CDR (Center for Disaster Recovery):
As of Sept. 15, the Libyan Red Crescent said the death toll had reached 11,300 people in Derna alone. Officials expect this figure to continue to rise, possibly as high as 20,000. About 170 people were also killed in other parts of eastern Libya, including in Susa, Marj, Bayda and Um Razaz. More than 7,000 people were injured and at least 10,100 people are still reported to be missing. Because of the lack of telecommunications, some may be displaced and unable to reach family, but due to the large-scale destruction, it is hard to confirm these figures.
According to Floodlist, Libya’s National Center of Meteorology reported, “in a 24 hour period to Sept. 10, a staggering 414.1 mm [16.2 inches] of rain was recorded in Bayda, while 240 mm [9.5 inches] of rain fell in Marawah in the District of Jabal al Akhdar, and 170 mm [6.7] fell in Al Abraq in the Derna District.”
I used publicly available satellite imagery to try assess the damage attributed largely due to the failure of two dams. My conclusion is that the dams were no more than momentary and relatively insignificant barriers to to the flow of an inconceivably large volume of water. The following satellite images from Google Earth, and Sentinel Hub’s EO Browser clearly demonstrate the power of our planet’s increasingly extreme weather events driven by global warming. As the oceans and atmosphere warm, the atmosphere is able to transport increasingly stupendous volumes of water (in the form of water vapor) over the land to be dropped when the air cools for any reason.
The following image is what appears to be the center of the city of Derna (pop ~100,000) immediately before Storm Daniel dropped part of its load of water in the watershed of Wadi Derna. The very dry stream bed of Wadi Derna crosses the center of the image. If you have access to Google Earth, you can zoom in to see shadows of the few individual people out in the mid-day sun.
Zooming in, note the large building on the NE side of the Wadi 3 blocks downstream from the bridge on the lower left corner of the picture. It is a high-rise, where the tallest part is 9 stories above the ground floor, and the rest five. I determined the number of floor by counting the sun shades visible on the downstream side of the building. This is one of the few structures left in this part of town that can be identified in the next image.
Immediately after it looked like this:
Note the conspicuous high-rise (10 stories) easily marked by its long shadow in this image. The image below images this building from the down-stream side. The image here is relatively low resolution, but the three lowest floors (facing AWAY from the flood) have clearly been gutted by the flood. The bridge referred to in the previous picture has vanished leaving only two supports (aligned with the stream flow) to show where it was. Rows of 4-6 story buildings (and even some 8 story buildings just off the left edge of this image) extending 3-4 and even more rows back from the Wadi have totally vanished or are only memorialized by a bit of concrete slab or trace of a foundation wall.
The next two pictures zoom in on the area between the vanished bridge in the above images and the next bridge upstream (just off the edge of the above).
The three buildings to the left of the Wadi at the bottom of the image were respectively 7, 4, and 7 stories high
The next two pictures show the site of the lower dam – 250 meters upstream from the inland edge of the city.
Note: the dam has no spillway. Overflow protection is provided by the flared drain pipe (circular structure) in the lower left of the picture. Using Google Earth’s measuring tool, the diameter of the drain as approximately 6m. On the upstream side the surface of the reed bed is ~24 m above sea level, and the level of the road over the top is 45 m, giving the dam height of 21 m. On the downstream side the base of the dam is at 26 m, with the outlet for the overflow drain at approx 22 m. The length of the dam across the top is ~115 m, across the bottom (at reed level) is 50 m; thickness at the bottom is ~74 m, 8.5 m at the roadway.
The next Google Earth image is of the upper dam (12.5 km upstream from the lower dam) from immediately before Storm David’s rain. There is no high resolution image available from after the flood.
The drain tube (right side upstream) seems to be 7m in diameter. The dam is ~10 m high and 270 m long. 143 m thick at the base and 6.5 m thick at the top.
The last composite graphic gives an impression of the amount of water held behind both dams in the days immediately prior to Storm David. All are sourced via Sentinel Hub’s EO Browser and all are at the same scale – close to the maximum resolution available. The left four images are of the upper dam and its lake, while those on the right are of the lower dam and its lake. The upper three images of each dam use the Normalized Difference Moisture Index NDMI – that basically highlights any moisture in the otherwise barren landscape. The bottom picture is the same view as the one immediately above, except that it displays “true colors”. On the left in the top picture, on 10/01/2023 there was some water backed up behind the dam, perhaps 2 m deep at the dam wall given that most of the upstream face is still dry. The second picture, on 02/09/2023 shortly before Storm Daniel shows essentially zero moisture behind the dam, except there is a tiny blue streak in the bottom of the bright yellow area that is too small to be resolved at the magnification shown here. The blue areas below the dam are well watered orchards and fields – not standing water. The dam is visible in both of the above pictures. The third picture, from 12/09/2023 immediately after Storm Daniel shows the Wadi Derna has been scraped clean of any sign of a dam or the well watered agricultural area below the dam save the blue area off to the side. Inspection of the area just downstream from the pictures here in the before and after show the complete obliteration of farms and vegetation together with the road to a height of 20+ meters above the bottom of the wadi. A little further upstream – a bit closer to the dam, the landscape has been scraped up to a height of 38 m! above the wadi bottom, where the width of the wadi is approximately 200 m across. The height of this point is ~215 m above sea level (at least 10 m higher than the top of the dam!).
A similar story can be constructed for the pictures of the lower dam in the right column. The dams were minor inconveniences to the flow of the total volume of the storm water.
The Wadi Derna drains a large and relatively barren plateau with some of the weirdest landforms I have seen, and could possibly be organized so it receives large volumes of water from a number of subsidiary drainages at the same time. Or, more likely, the insanely hot Mediterranean air was supersaturated with water, and the storm dynamics led to rapid cooling that squeezed all of the water out over a very short period of time….. And the barren plateau lacked soil and vegetation to slow the flow of the water once it hit the ground, and simply demonstrated what can happen when the Earth System has too much energy to dissipate all at once in the form of climate catastrophes.
Consequently….
Our planet is progressively becoming uninhabitable!
Not yet getting back to anything as cool as last year’s near record highs after more than 3 months! – https://climatereanalyzer.org/clim/t2_daily/?dm_id=world3+ months and the anomaly is still trending ever more extreme as the sub-solar point moves towards the Southern Hemisphere!Global Average Sea Surface Temperature still above previous years ALL TIME RECORD HIGH TEMPERATURE with trend line still widening the gap. 90% of excess solar heat is first absorbed into the oceans to heat the globe as a whole. – https://climatereanalyzer.org/clim/sst_daily/Southern Hemisphere anomaly also in record extreme territory and rising rapidly. Antarctic rising and ~1 day from record daily high.Sept. 13 and Antarctic sea ice already beginning to melt after 4+ months of record low freezing rate, to create a global average record low amounts of sea ice. At the southern summer low to come will there be ANY sea ice left around Antarctica? What does this mean for ice shelves and glacier fronts exposed to warm pounding waves and tides? – https://nsidc.org/arcticseaicenews/charctic-interactive-sea-ice-graph/Sept. 19 and the ice is rapidly melting into ever more extreme low sea ice for the date.Sept 19 and rapid Antarctic melting keeps global coverage more than 4 σ below any previous low for the date. Not good news for southern summer! https://seaice.visuals.earth/ Record high temperatures & reduced temperatures between polar and ‘temperate’ zones lead to crazy, weak and chaotic jet streams; in turn allowing stalled extreme heat domes, droughts and wildfires; lethally moist air masses, biblical flooding, and catastrophic storms. OUR GOVERNMENTS ARE STILL PROMOTING AND SUBSIDIZING FOSSIL FUEL BURNING!
It’s truly astonishing how hot the North Atlantic was this summer. 2.3F above normal (+1.3C) and about 1F or .5C above records. It may not sound like much but it’s tremendous – This is for a huge area from the equator to the southern tip of Greenland and from Florida to the UK. https://t.co/M6Wapdbo5jpic.twitter.com/D2mj0iKBRy
Leon Simons [Mission: To understand & protect the home planet. Innovator, climate researcher, social entrepreneur. Board member Club of Rome NL], who works outside the ‘reticence’ imposed by the usual academic and institutional employers considers the significance of recent reports on the Earth’s energy imbalance. Note: Simons is a coauthor on at least two peer reviewed scientific reports in this area.
Simons puts the previous graphs in a geological context based on Shackleton et al’s reconstruction of variations of Earth’s energy balance determined from measurements of Oxygen isotope ratios in sediment cores from the seabeds.
The thread from https://twitter.com/LeonSimons8/status/1698413266421096893 explains in some detail how the following graph was inferred and extrapolated from the above. At first I found it difficult to make sense of this graph until I grasped that the vertical line defining the right-hand side of the graph was data, comparing the imbalance observed directly over the last 50 years, with the variation recorded over the last 150,000[!] years, not the border….
Simons was one of the coauthors of the above paper.
ERA5 September 2023 monthly data are out.
I'm still struggling to comprehend how a single year can jump so much compared to previous years.
Just by adding the latest data point, the linear warming trend since 1979 increased by 10%. pic.twitter.com/AnNAbyUQwY
Note that the following X-Tweet is limited to the United States – based on a Scientific American article. The rest of the world is suffering at least as much! Total costs are adjusted for inflation. It isn’t clear whether this also applies to the individual “billion dollar” events in the graph below.
Given the rapidly growing accumulation of excess heat in Earth’s oceans, if we cannot stop and reverse global warming within the next few years the inevitable result will be ecological and social collapses, within a few decades, and likely global extinction of most complex organisms — including humans within a century or so….
We must act before it is too late!
Featured Image
Based on an image by Leon Simons, https://twitter.com/LeonSimons8/status/1698410404693594417 depicting the urgent existential problem facing humanity today: If we cannot reverse the heating spike forming the right-hand border of the graph and force it below the neutral line forming the graph’s X axis within a few years, most complex life on Earth will be extinct in a century or so.
Views expressed in this post are those of its author(s), not necessarily all Vote Climate One members.
G20 nations broke records in 2022 subsidizing fossil fuel: $1.4 TN in 2022 — more than twice what they have invested in sustainable energy.
Clearly, fossil fuel subsidies help the greedy special interests whose carbon emissions are smothering our planet drag us towards mass extinction from the ‘runaway greenhouse‘. Equally clearly, members of governments approving and providing these subsidies must be getting something in return.
Public money still flowing into industry despite agreement to phase out ‘inefficient’ subsidies, thinktank says
The G20 poured record levels of public money into fossil fuels last year despite having promised to reduce some of it, a report has found.
The amount of public money flowing into coal, oil and gas in 20 of the world’s biggest economies reached a record $1.4tn(£1.1tn) in 2022, according to the International Institute for Sustainable Development (IISD) thinktank, even though world leaders agreed to phase out “inefficient” fossil fuel subsidies at the Cop26 climate summit in Glasgow two years ago.
The report comes ahead of a meeting of G20 countries in Delhi next month that could set the tone for the next big climate conference, which takes place in the United Arab Emirates in November.
It is crucial that leaders put fossil fuel subsidies on the agenda, said Tara Laan, a senior associate with the IISD and lead author of the study. “These figures are a stark reminder of the massive amounts of public money G20 governments continue to pour into fossil fuels – despite the increasingly devastating impacts of climate change.”
Scaling back subsidies would reduce air pollution, generate revenue, and make a major contribution to slowing climate change.
Fossil-fuel subsidies surged to a record $7 trillion last year as governments supported consumers and businesses during the global spike in energy prices caused by Russia’s invasion of Ukraine and the economic recovery from the pandemic.
As the world struggles to restrict global warming to 1.5 degrees Celsius and parts of Asia, Europe and the United States swelter in extreme heat, subsidies for oil, coal and natural gas are costing the equivalent of 7.1 percent of global gross domestic product. That’s more than governments spend annually on education (4.3 percent of global income) and about two thirds of what they spend on healthcare (10.9 percent).
…
As the Chart of the Week shows, fossil-fuel subsidies rose by $2 trillion over the past two years as explicit subsidies (undercharging for supply costs) more than doubled to $1.3 trillion. That’s according to our new paper, which provides updated estimates across 170 countries of explicit and implicit subsidies (undercharging for environmental costs and forgone consumption taxes). Download detailed data for different countries and fuels here.
The longer this evil cycle continues the less likely our escape from the dead-end road ending in Earth’s hothouse hell becomes. Seemingly, the only way we can find a side-road to a sustainable future is by replacing our present puppet governments with people committed to representing the interests of those who voted for them.
The only for them to know they will be replaced if they don’t do this is if for everyone who thinks this to tell their government representatives by post, email, phone, or old-fashioned knocking on the electoral office door. Only if enough people do this to convince special interest supporters that they really will be out of a job, will they begin to take the climate emergency seriously.
It is in your hands to start this action. VoteClimateOne.Org has the addresses and information you need to do this, and many other climate or energy action groups can also help you to power your tangible demands for action.
If you want to understand the climate crisis, see what VoteClimateOne.Org is telling our federal and state governments, and Climate Sentinel News for the real evidence of what is going on with the climate:
If you reference any of our evidence in your petitions to government member, they will know that a lot more people than you will be working to remove them from office if they don’t respond with serious climate action. See ACT NOW! and Traffic Light Voting.
Views expressed in this post are those of its author(s), not necessarily all Vote Climate One members.
A climatologist telling how difficult it is for a scientist to actually tell the full horror of the accelerating climate crisis forecast by the science:
Western Sydney University researcher Thomas Longden says heatwaves are a “silent killer”; they are responsible for about 2 per cent of deaths in Australia, but that toll goes largely unnoticed. Heatwaves are also set to get more frequent and more intense with climate change.
A Bureau of Meteorology map showing sea surface temperatures. The Bureau of Meteorology expects a patch of the Tasman Sea off Tasmania and Victoria will be at least 2.5C above average from September to February.
🧵 Historic heat in France with 44.4C at Salindres and 44.2C at Siran,hottest in August in French history. 223 MONTHLY RECORDS today (nearly half were all time records) with a total of nearly 500 RECORDS broken so far LONG POR ALL TIME HIGHS Thread:
— Extreme Temperatures Around The World (@extremetemps) August 23, 2023
Authorities in Hawaii released a list late on Thursday naming 388 people who are still unaccounted for in the aftermath of the deadliest wildfires in America in more than a century, which killed at least 115 people.
The fires devastated the coastal town of Lahaina on the island of Maui, as well as other areas of the island, more than two weeks ago. Search-and-rescue teams are still sifting through the last patches of ash and rubble looking for human remains.
In publicizing the names, the authorities hope to narrow the tally of the missing. In a statement, Maui’s police chief, John Pelletier, asked anyone who survived the fire to come forward and remove their name from the list. Officials had said earlier on Tuesday that 1,000 to 1,100 people remained unaccounted for.
The list released on Thursday, Mr. Pelletier said, includes anyone for whom officials have a first and last name and contact information for the person who reported them missing.
Officials have been bracing the public for the likelihood that the number of confirmed dead from the fires — which stands at 115 — will rise substantially.
Atmospheric methane continues to accelerate, likely due to increased rainfall & warming causing greater emissions from wetlands (particularly in the tropics).
https://www.nature.com/articles/d41586-022-00312-2 – Scientists raise alarm over ‘dangerously fast’ growth in atmospheric methane. As global methane concentrations soar over 1,900 parts per billion, some researchers fear that global warming itself is behind the rapid rise. [paywall]
Has Termination Zero begun? Rising methane could be a sign that Earth's climate is part-way through a 'termination-level transition' https://t.co/PFubUD8b20
Finally, what seems to be a rational way to use computational methods to assess to predict tipping points in realistic models of complex dynamical systems where the input data does not (yet) include any observed tipping points!!
M Liu-Schiaffini, CE Singer, N Kovachki, T Schneider… – arXiv preprint arXiv …, 2023
Tipping points are abrupt, drastic, and often irreversible changes in the evolution of non-stationary and chaotic dynamical systems. For instance, increased greenhouse gas concentrations are predicted to lead to drastic decreases in low cloud cover, referred to as a climatological tipping point. In this paper, we learn the evolution of such non-stationary dynamical systems using a novel recurrent neural operator (RNO), which learns mappings between function spaces. After training RNO on only …
Cites: Permafrost carbon emissions in a changing Arctic
Everything you need to know about Australia's bid to host the 2026 COP31 jointly with Pacific island nations from @thejuicemedia
I wonder if Australia understands 000s of climate civil society will be there?
Scientists worldwide fear that research tracking how climate change is affecting Antarctica will be disrupted, after it was reported that the Australian Antarctic Division (AAD) will cancel, postpone or strip back several of its research projects this summer because of a looming Aus$25-million (US$16.2-million) budget cut. The cut comes hot on the heels of the news that Antarctica’s sea ice has hit a drastic and surprising new low.
Among the projects on the chopping block are studies investigating how sea ice is changing in the warming climate. “It’s just a terrible blow for the science,” says Nerilie Abram, a palaeoclimate scientist at the Australian National University in Canberra who chairs the Australian Academy of Science’s National Committee for Antarctic Research.
…
In July, AAD management told staff by e-mail that it needed to reduce its annual operating budget for the next year by 16%. AAD staff have confirmed to Nature that several projects scheduled to be conducted from Davis and Mawson will not be supported this season, including surveys on sea-ice thickness and landfast sea ice — large ice sheets that are ‘fastened’ to the shoreline or sea floor.
Nathan Bindoff, a physical oceanographer at the University of Tasmania in Hobart, Australia, says he was “astonished” when he learnt about the cuts. “That’s a lot of money — even in a very big programme — to absorb,” says Bindoff, who leads the Australian Antarctic Program Partnership, which collaborates with the AAD to understand the role Antarctica has in the global climate system and the implications of this relationship on marine ecosystems.
On 27 June, data from the US National Snow and Ice Data Center showed that the sea ice surrounding Antarctica had reached a record low winter extent of 11.7 million square kilometres, more than 2.5 million square kilometres below the average for the same time of year between 1981 and 2010. Although researchers expect sea ice to dwindle as climate change intensifies, its drastic fall this year came as a surprise, says Abram.
Now, more than ever, researchers need to be on the ground in Antarctica to gain a better understanding of what’s driving the sudden decline in sea ice, she says. “We really need to get there to make those physical measurements.” Abram adds that gaps in long-term monitoring data will make it difficult for researchers to understand how Antarctic systems are changing as temperatures rise, particularly on the relatively understudied eastern side of the continent, where the Australian division is based.
Atmospheric methane’s rapid growth from late 2006 is unprecedented in the observational record. Assessment of atmospheric methane data attributes a large fraction of this atmospheric growth to increased natural emissions over the tropics, which appear to be responding to changes in anthropogenic climate forcing. Isotopically lighter measurements of
are consistent with the recent atmospheric methane growth being mainly driven by an increase in emissions from microbial sources, particularly wetlands. The global methane budget is currently in disequilibrium and new inputs are as yet poorly quantified. Although microbial emissions from agriculture and waste sources have increased between 2006 and 2022 by perhaps 35 Tg/yr, with wide uncertainty, approximately another 35–45 Tg/yr of the recent net growth in methane emissions may have been driven by natural biogenic processes, especially wetland feedbacks to climate change. A model comparison shows that recent changes may be comparable or greater in scale and speed than methane’s growth and isotopic shift during past glacial/interglacial termination events. It remains possible that methane’s current growth is within the range of Holocene variability, but it is also possible that methane’s recent growth and isotopic shift may indicate a large-scale reorganization of the natural climate and biosphere is under way.
Flood risk from #Hilary in SE California deserts is genuinely alarming. Widespread & possibly destructive flash flooding is possible. This has high potential to be a historic flood event in this region. See attached screenshot of @NWSPhoenix forecast discussion from this AM.#CAwxhttps://t.co/zgj3tG3mr4pic.twitter.com/Oj9881gJUP
California, Nevada, Oregon and even a sliver of Idaho in a tropical cyclone probability cone in 2023 before Florida. Totally normal. pic.twitter.com/EjUKBgKMdO
Synoptic setup 🧵 of high-profile rainfall event for the SW US in association with #Hurricane#Hilary.
Offshore upper-level trough helps steer Hilary towards California, but will also provide forcing for ascent leading to heavy rains beginning well before the TC arrives.#CAwxpic.twitter.com/8OJB785Lor
1. Horror paper of the week. @Keir_Starmer "Greenland's temperature rose by around 10°C within a few decades," supporting the prospect of 5m plus of sea level rise and global average temperature rise of around 5C by 2100.
Should be headline news. Won’t be, of course. The most iconic climate scientist of modern times – Dr James Hansen – says things are far worse than the mainstream science suggests – but that we can still solve the problem – but only if the public demands it 🚨👇@bbcnews@Reutershttps://t.co/FGis2Wqxznpic.twitter.com/ZZLza9K6Zo
July 2023 was the hottest month on record, according to our global temperature analysis. Overall, July was 0.43°F (0.24°C) warmer than any other July in @NASAEarth's record, and it's likely due to human activity. Details: https://t.co/2DTIfL8S1Qpic.twitter.com/qs8YPnVx1y
"Look again at that dot. That's here. That's home. That's us. On it everyone you love, everyone you know, everyone you ever heard of, every human being who ever was, lived out their lives. The aggregate of our joy and suffering, thousands of confident religions, ideologies, and… pic.twitter.com/SlHeu4JBIK
Charlotte asks “The world keeps turning to scientists & higher institutions to fix climate change, yet no one listens to/acts on the answers. Is the real crisis we are facing a communication crisis”? #QandApic.twitter.com/UHHXDGe3ec
For ocean_heat to dissipate req's raising oceanic pH or the frogs boil aka an extinction #seasurface goes #anoxic a bacteria takes over emits #hydrogen_sulfide we die above 200ppm
More than 120k views in 18 hours! Seems a lot of people are confused why a government that’s so committed to building new gas & coal mines is so keen to host a UN conference on how to tackle climate change. Watch it if you haven’t already#auspol#climatehttps://t.co/VeBTECEWyu
I think humans have reached the point where we have to unite to mobilize a global war against global warming or accept near-term human extinction. Just from today’s evidence there are strong reasons to think we have gone over the threshold of a cascade of tipping points into temperature raising positive feedbacks that seem to have no off switches — and we are still doing our best to continue increasing the concentrations of greenhouse gases.
The Hunga Tonga–Hunga Haʻapai eruption was unusually water rich (& sulfur poor), injecting ~150 million tonnes of water into the stratosphere, increasing global upper atmosphere water mass by ~15%.
As a powerful greenhouse gas, this water may have contributed to recent warming. pic.twitter.com/9WNkPe3BYE
Beijing just experienced its worst rainfall event since records began 140 years ago in 1883.
The city recorded an astonishing 744.8 mm (29.3 inches) of rain between Saturday and Wednesday morning as the remnants of Typhoon Doksuri moved through the region. pic.twitter.com/V02jPawGDm
Temperature has been in record territory since March 15.with the deviation of the anomaly increasing fairly steadily since then.
Crazy mad jetstreams in the Southern Hemisphere. Basically no jetstreams in the Northern…. (Wind speed needs to be more than 60 kt to be considered a jetstream)
Except for parts of the Amundsen Sea, nearly all regions observed large areas of open water that would normally be sea ice covered around #Antarctica in July 2023.
Following is a US Navy product: https://www7320.nrlssc.navy.mil/GLBhycomcice1-12/arctic.html presumably in aid of submarine navigation. Shows Arctic ice melting fast – not a record yet, but what is left doesn’t look like it will last too many more days before the usual late September minimum. If open ocean extends to the North Pole that will be a decade or more earlier than predicted from past warming trends. I have not watched these animations in previous year – but to me the following four graphics seem to be heading for a cataclysmic train wreck. A blue Arctic Ocean exposed to 24 hour solar heating is not good news for the planet.
20-30% open water at the North Pole! SSS = Sea Surface Salinity. Here you can clearly see relatively fresh cold water flowing out into the North Atlantic east of Labrador making saltier water less dense (that is already too hot and light to sink into the depths to drive the deep water return flow of the AMOC / Atlantic Conveyor / Atlantic branch of the global thermohaline circulation work. In other words there is currently a total stoppage of the AMOC. Southern branches also seem to be mostly plugged judging by the water around Antarctica being too hot for anything like normal amounts of Antarctic sea ice to form in the southern winter.
Mixed layer depth. Note that vertically insolated regions (northern hemisphere summer) have very shallow mixed layer. Antarctic subpolar regions with little or no solar heating have deep mixed layers (i.e., with little thermal stratification) presumably facilitating the formation of sinks for cold mixed water into the global thermohaline circulation.
See also: https://journals.ametsoc.org/view/journals/phoc/51/4/JPO-D-20-0179.1.xml
Around 90% of the extra heat trapped by the greenhouse layer warms our Ocean to slow rising temperatures. We’ll pay the price.
The climate scientist, Bill McKibben reminded me of this fact in his regular newsletter, The Crucial Years, in his 18 May post, Maybe we should have called this planet ‘Ocean’. His post on ocean warming begins with an earlier version of the graphic here from ClimateReanalizer. These are updated daily, so the record here is only a day or two behind the current reality:
The page provides time series and map visualizations of daily mean Sea Surface Temperature (SST) from the NOAA Optimum Interpolation SST (OISST) dataset version 2.1. OISST is a 0.25°x0.25° gridded dataset that estimates temperatures based on a blend of satellite, ship, and buoy observations. The OISST data product includes SST anomalies based on 1971–2000 climatology from NOAA. The datset spans 1 January 1982 to present with a 1 to 2-day lag from the current day. OISST files are preliminary for about two weeks until a finalized product file is posted by NOAA. This status is identified on the maps with “[preliminary]” showing in the title, and applies to the time series as well. The time series chart displays area-weighted means of the selected domain. For example, if World 60S-60N is selected, then the SST values shown are area-wieghted means for all ocean gridcells between 60°S and 60°N across all longitudes.
Something very troubling is happening on and under the 70 percent of the planet’s surface covered by salt water. We pay far more attention to the air temperature, because we can feel it (and there’s lots to pay attention to, with record temps across Asia, Canada and the Pacific Northwest) but the truly scary numbers from this spring are showing up in the ocean.
If you look at the top chart above , you can see “anomaly” defined. [His chart was for 11 May. Mine, here, is the temperature on 19 May.]That’s the averaged surface temperature of the earth’s oceans, and beginning in mid-March it was suddenly very much hotter than we’ve measured before. In big datasets for big phenomena, change should be small—that’s how statistics work, and that’s why the rest of the graph looks like a plate of spaghetti. That big wide open gap up there between 2023 and the next hottest year (2016) is the kind of thing that freaks scientists out because they’re not quite sure what it means. Except trouble. [My emphasis]
… A little-noticed [but quite important] recent study headed by Katrina von Schuckmann found that “over the past 15 years, the Earth has accumulated almost as much heat as it did in the previous 45 years,” and that 89 percent of that heat has ended up in the seas. That would be terrifying on its own, but coming right now it’s even scarier. That’s because, after six years dipping in and out of La Nina cooling cycles, the earth seems about to enter a strong El Nino phase, with hot water in the Pacific. El Nino heat on top of already record warm oceans will equal—well, havoc, but of exactly what variety can’t be predicted.
McKibben’s second graphic (the up to date version is my “Featured Image”) shows a global plot of temperature anomalies (also compared to the same 1971-1980 baseline) for every ¼° – ¼° square of ocean surface. “Area weighting” is applied because ¼° of latitude (the width of the ‘square) becomes much narrower as either pole is approached, reducing the physical surface area encompassed by the lines on the globe.
In any event, this data doesn’t just freak me out. It suggests that the door to Earth’s Hothouse Hell is beginning to open to suck us in.
Is this data reliable enough to support action?
Where the climate record is concerned, From the beginning of the satellite era, our oceanic temperature record is very good indeed, and not just because satellite remote sensing measures virtually every square degree of most of the globe every day, but the satellites’ measurements are calibrated every day against the ‘ground truth’ measurements from many hundreds of Argo floats surfacing each day from their 9-10 days probing the ocean depths. The graphic below shows the physical locations sampled by Argo floats over the previous month. Added to these are more detailed measurements collected by fleets of oceanographic ships and a few special moored buoys that continuously record measurements from the ocean surface to the abyssal ocean bottom.
Supercomputers amalgamate the raw input data and assemble the kinds of human readable outputs that you and I can understand at a glance. Thanks to the exponential growth of measuring technologies and data processing power the accuracy and detail of our scientific understanding of climate and weather extends far beyond anything we could know in past decades.
How is all the additional heat in the warming ocean likely to affect the planet we live on?
Melting ice
As the atmosphere and oceans absorb more solar energy, some of this excess energy will inevitably be absorbed melting ice in the cooler regions of the planet where ice has existed more-or-less in an equilibrium state, e.g., in the form of glaciers, ice sheets, and sea ice. The energy drives the equilibrium states towards more water and less ice.
One very obvious measure of ice melting is the rapidly shrinking area of the Earth’s surface covered by sea ice around the N and S Poles. Since the beginning of the satellite era this has been able to be measured accurately. The Australian Antarctic Program Partnership and the ARC Australian Centre for Excellence in Antarctic Science’s 2023 Science Briefing: On Thin Ice explains what is happening around our local polar ocean
Record minimums or maximums are updated annually. Therefore, a newly-set record may not be reflected in the chart until after the annual update. View additional years by clicking the dates in the legend. Roll your cursor over the line to see daily sea ice extent values. Zoom in to any area on the chart by clicking and dragging your mouse. To see a corresponding daily sea ice concentration image, click on a line in the chart. Sea ice extent is derived from sea ice concentration. Images are not available for the average or standard deviation. When reusing Charctic images or data, please credit “National Snow and Ice Data Center.” Currently, some functions do not work in Internet Explorer. We recommend using a different browser. For more information about the data, see About Charctic data. If you have questions or problems, please contact NSIDC User Services at [email protected].
What is currently happening in the Antarctic Ocean is also freakish and worrisome!
Uh, the #Antarctic sea ice anomaly continues to grow and is really a pronounced outlier for this time of year in our satellite record… 🥴
— Australian Antarctic Program Partnership (@Ant_Partnership) May 18, 2023
Rising sea levels
Of course, all the melt water released by melting ice has to go somewhere — i.e., adding to the volume of the World Ocean. As this wasn’t enough, as water warms it also expands to raise the sea levels even more. The graph below from the EU’s Copernicus Climate Change Service, plots the rising tide of the swelling ocean since 1993 through June 2022. The US National Oceanic and Atmospheric Administration’s Climate.Gov site’s Climate Change: Global Sea Level also plots the rise, and considers its implications in more detail.
Daily change in global mean sea level, as measured by satellite altimetry, from January 1993 to June 2022 (solid line), the associated uncertainty at 90% confidence level (shading) and the trend (dashed line). The data have been adjusted for glacial isostatic adjustment and have been corrected for the TOPEX-A instrumental drift during 1993–1998. Data source: CMEMS Ocean Monitoring Indicator based on the C3S sea level product. Credit: C3S/ECMWF/CMEMS. https://climate.copernicus.eu/climate-indicators/sea-level
Help! We’re sliding down the slope to Earth’s Hothouse Hell! Sound the sirens and mobilize for WW III against global warming and the existential climate crisis!
As is usual for the UN’s climate pronouncements driven by the UN’s IPCC findings that absolutely establish the dangers we face from global warming/heating, even this klaxon warning understates and downplays the magnitude of the crisis we face.
If we fail to mobilize genuinely effective action over the next decade to stop and reverse the warming crisis, our families will have their lives shortened due to increasing climate catastrophes and we will have condemned our entire species to death in Earth’s 6th global mass extinction within a century or two. We don’t have time to take more election cycles to elect new governments. Our existing governments must wake up, smell the smoke, and immediately begin acting to put out the fire before it destroys us all. If you are in government, read Guterres’ message in mind. YOU must act now!
Planet Hurtling towards Hell of Global Heating, Secretary-General Warns Austrian World Summit, Urging Immediate Emissions Cuts, Fair Climate Funding
Following is the text of UN Secretary-General António Guterres’ video message to the seventh Austrian World Summit, in Vienna today:
I thank the Austrian Government and Arnold Schwarzenegger for this opportunity. The climate crisis can feel overwhelming. Disasters and dangers are already mounting, with the poor and marginalized suffering the most, as we hurtle towards the hell of 2.8°C of global heating by the end of the century.
But, amidst all this, I urge you to remember one vital fact: limiting the rise in global temperature to 1.5°C remains possible. That is the clear message from the Intergovernmental Panel on Climate Change (IPCC). But, it requires a quantum leap in climate action around the world.
To achieve this, I have proposed an Acceleration Agenda. This urges all Governments to hit fast-forward on their net-zero deadlines, in line with the principle of common but differentiated responsibilities and respective capabilities in the light of national circumstances. It asks leaders of developed countries to commit to reaching net zero as close as possible to 2040 — as Austria has done. And leaders in emerging economies to do so as close as possible to 2050.
The Acceleration Agenda also urges all countries to step up their climate action, now. The road map is clear: phasing out of coal by 2030 in OECD [Organisation for Economic Co-operation and Development] countries and 2040 in all others; net-zero electricity generation by 2035 in developed countries, and 2040 elsewhere; no more licensing or funding of new fossil-fuel projects; no more subsidizing fossil fuels; and no more fake offsets, which do nothing to cut greenhouse-gas emissions, but which are still being used to justify fossil-fuel expansion today.
We can only reach net zero if we make real and immediate emissions cuts. If we embrace transparency and accountability. Relying on carbon credits, shadow markets, or murky accounting means one thing: failure. That is why I have asked CEOs to present clear net-zero transition plans, in line with the credibility standard presented by my high-level expert group on net-zero pledges.
And the Acceleration Agenda urges business and Governments to work together to decarbonize vital sectors — from shipping, aviation and steel, to cement, aluminium and agriculture. This should include interim targets for each sector to pave the way to net zero by 2050.
The Acceleration Agenda also calls for climate justice, including overhauling the priorities and business models of multilateral development banks, so that trillions of dollars in private finance flow to the green economy.
Developed countries must also make good on their financial commitments to developing countries. And they must operationalize the loss and damage fund, and replenish the Green Climate Fund. I commend Austria for increasing its pledge to the Green Climate Fund by 23 per cent and urge others to deliver their fair share.
On climate, we have all the tools we need to get the job done. But, if we waste time, we will be out of time. Let’s accelerate action, now. Thank you.
Featured Image
Note that about half the surface of Earth’s Ocean is a good 2 °C hotter than the baseline average temperature for this day of the year
Views expressed in this post are those of its author(s), not necessarily all Vote Climate One members.
As if a planetary system is going to pay an iota of attention to what Iowa thinks. New law says state regulations must ignore climate change!
The only people who will suffer will be those harmed by and dying from increasingly extreme weather events as a consequence of global warming from the fossil fuel industry’s continued contributions to Earth’s greenhouse layer.
Blind stupidity driven by boundless greed! You have to read the article to understand just how stupid and greedy some American legislators can be…
Meteorologists are being threatened and abused for forecasting and reporting record high temperatures and weather extremes.
Last week Spain recorded the highest April temperature on record (38.8 °C) following on from last year, 2022, its hottest year since records began.
Nearly 75 percent of Spain is susceptible to desertification due to climate change. Water reservoirs are at half their capacity and farmers unions say 60 percent of agricultural land is “suffocating” from lack of rain. Spain has asked Brussels to help by activating the EU’s agriculture crisis reserve funds (when many other areas of Europe are also suffering from drought).
Long drowned villages emerging from bottoms of desiccating reservoirs: The ruins of the Sant Romà church, exposed due to historically low water levels in the Sau reservoir, Spain in April. Photographer: Angel Garcia/Bloomberg
Spain’s government on Friday came to the defence of the AEMET weather agency, which has suffered threats and abuse from climate conspiracy theorists over its forecasts during a record drought.
“Murderers”, “Criminals”, “You’ll pay for this” and “We’re watching you” are just some of the anonymous messages sent to AEMET in recent weeks on social media, by email and even by phone.
The threats were responding to forecasts and reports published by AEMET, notably over last week’s early heatwave, when Spain registered its hottest-ever temperature for April, reaching 38.8 degrees Celsius (101.8 degrees Fahrenheit) in Cordoba.
Where the European/Mediterranean region is concerned, Spain is not the only country facing water crises. Even before the end of winter, the Guardian’s article of 4 March, ‘Very precarious’: Europe faces growing water crisis as winter drought worsens, Austria, Germany, France, Italy and Switzerland were all suffering problems from shortages of rain and runoff from the small amount of accumulated winter snow.
Australia has already lost a lot of agricultural productivity because of three years of La Niña flooding. For several months we couldn’t even buy frozen french fries (shades of the Irish Potato Famine). This may well be followed by even more damaging droughts when the next major El Niño surpasses the last two to reach 1.5 °C above the pre-industrial baseline, as seems likely given past trends.
As a target for those with an often visceral distrust of the established science of human-caused global heating, the Bureau of Meteorology’s temperature record might be seen as ground zero. Photograph: Bill Bachman/Alamy / from the article.
Former Bureau of Meteorology staff say claims they deliberately manipulated data to make warming seem worse are being fed by a ‘fever swamp’ of climate denial.
For more than a decade, climate science deniers, rightwing politicians and sections of the Murdoch media have waged a campaign to undermine the legitimacy of the Bureau of Meteorology’s temperature records.
Those records say Australia has warmed by 1.4C since 1910, the year when the bureau’s main quality-controlled climate dataset starts.
Extremely hot days come along more often than they used to, and the warming trends are happening everywhere, at all times of the year.
As a target for those with an often visceral distrust of the established science of human-caused global heating, the bureau’s temperature record might be seen as ground zero.
“This has frankly been a concerted campaign,” says climate scientist Dr Ailie Gallant, of Monash University. “But this is not about genuine scepticism. It is harassment and blatant misinformation that has been perpetuated.”
Attacking messengers because you dislike or fear the messages only impedes circulating knowledge that might help to solve real-world problems and save your life or the lives of your family members. That global warming causes record temperatures and droughts is a fact that causes problems…. Denying the fact does not make the problems go away! It only keeps the problem from being solved until it is too late to do anything effective.
When there are too many crop failures over too wide an area for too long, famine is the consequence, and can lead to. Continuing famine leads to starvation and, eventually, mass deaths.
International group of climatologists launch a set of annually updated climate indicators to track human induced global warming through time.
This decade is absolutely critical for climate action if we are to avoid climate catastrophe. However, up to now we have lacked a standardized set of measures of the level of human-induced warming for tracking our progress over times as short as a year.
So far, the gold standard against which progress can be measured has been the IPCC’s cycle of Assessment Reports (e.g., the latest being AR6, completed this year). These have been published on cycle times of 6 to 7 years.
A team of 50 authors from major climate science institutes and universities around the world under lead author, Piers Maxwell Forster of the Priestly Centre University of Leeds, have set out to publish annually updated reliable global climate indicators in the public domain. This is based on the assessment methods used in the IPCC Sixth Assessment Report (AR6) Working Group One (WGI) report, to update the monitoring datasets and to produce updated estimates for key climate indicators. These include emissions, greenhouse gas concentrations, radiative forcing, surface temperature changes, the Earth’s energy imbalance, warming attributed to human activities, the remaining carbon budget and estimates of global temperature extremes. As these measurements are traceable and consistent with IPCC report methods, they can be trusted by all parties involved in UNFCCC negotiations and help convey wider understanding of the latest knowledge of the climate system and its direction of travel.
Although still unreviewed, this work certainly provides the most up to date data on our progress towards reversing global warming while that might still be possible.
The news is bad. Although there are a few improvements in isolation, nothing we have done through the end of 2022 has been enough to perceptibly the rate of global warming.
Piers Maxwell Forster, et al. – 02/05/2023, Earth System Science Data
Abstract. Intergovernmental Panel on Climate Change (IPCC) assessments are the trusted source of scientific evidence for climate negotiations taking place under the United Nations Framework Convention on Climate Change (UNFCCC), including the first global stocktake under the Paris Agreement that will conclude at COP28 in December 2023. Evidence-based decision making needs to be informed by up-to-date and timely information on key indicators of the state of the climate system and of the human influence on the global climate system. However, successive IPCC reports are published at intervals of 5–10 years, creating potential for an information gap between report cycles.
We base this update on the assessment methods used in the IPCC Sixth Assessment Report (AR6) Working Group One (WGI) report, updating the monitoring datasets and to produce updated estimates for key climate indicators including emissions, greenhouse gas concentrations, radiative forcing, surface temperature changes, the Earth’s energy imbalance, warming attributed to human activities, the remaining carbon budget and estimates of global temperature extremes. The purpose of this effort, grounded in an open data, open science approach, is to make annually updated reliable global climate indicators available in the public domain (https://doi.org/10.5281/zenodo.7883758, Smith et al., 2023). As they are traceable and consistent with IPCC report methods, they can be trusted by all parties involved in UNFCCC negotiations and help convey wider understanding of the latest knowledge of the climate system and its direction of travel.
The indicators show that human induced warming reached 1.14 [0.9 to 1.4] °C over the 2013–2022 period and 1.26 [1.0 to 1.6] °C in 2022. Human induced warming is increasing at an unprecedented rate of over 0.2 °C per decade. This high rate of warming is caused by a combination of greenhouse gas emissions being at an all-time high of 57 ± 5.6 GtCO2e over the last decade, as well as reductions in the strength of aerosol cooling. Despite this, there are signs that emission levels are starting to stabilise, and we can hope that a continued series of these annual updates might track a real-world change of direction for the climate over this critical decade.
The first set of observations shows that most human carbon emissions have not slowed, although, although the slowing economy over COVID have somewhat slowed overall growth (although this appears to have resumed in 2022). The only area where have actually significantly slowed emissions is for regulated fluorinated gases (F-gas).
Figure 1: Annual global anthropogenic greenhouse gas emissions by source, 1970-2021. Refer to Sect. 2.1 for a list of datasets. Starred datasets (*) indicate the sources used to compile global total greenhouse gas emissions in panel a. CO2 equivalent emissions in panels a and f are calculated using GWPs with a 100-year time horizon from the AR6 WGI Chapter 7 (Forster et al., 2021). F-gas emissions in panel a comprise only UNFCCC F-gas emissions (see Sect. 2.1 for a list of species). Not shown in panels d and e are biomass combustion emissions from GFED (Van Der Werf 2017), which are included in the aggregate estimate in panel a.
The next set of figures shows how effective the various gases in greenhouse layer in the atmosphere are at capturing solar radiation (i.e., “effective radiation forcing”). In 2a right facing bars represent a net positive forcing of higher temperatures, while the left facing bars represent the reflection of extra energy away from Earth. 2b shows a fairly abrupt increase in the forcing between 1960 and 1970, presumably due to the increasing annual rates of greenhouse gas emissions. Note: if the Earth is to have any chance to begin cooling the anthropogenic forcing (grey) needs to trend down, not to continue rising higher as it does here!
Figure 2: Effective radiative forcing from 1750-2022. (a) 1750-2022 change in ERF, showing best estimates (bars) and 5-95% uncertainty ranges (lines) from major anthropogenic components to ERF, total anthropogenic ERF, and solar 610 forcing.
Figure 2: Effective radiative forcing from 1750-2022. (b) Time evolution of ERF from 1750 to 2022. Best estimates from major anthropogenic categories are shown along with solar and volcanic forcing (thin coloured lines), total (thin black line) and anthropogenic total (thick black line). 5-95% uncertainty in the anthropogenic forcing is shown in shaded grey. Note solar forcing in 2022 is a single-year estimate.
Because Earth currently suffers an imbalance between the solar energy it receives and what it radiates away to outer space as heat energy, the difference between energy received and energy radiated is stored as heat by raising the temperature of various components of planet’s mass (i.e., as the heat inventory). Figure 3a shows that the vast bulk is being stored at different water levels in the ocean, with virtually all of the remained represented by melted ice and the surface layer of soil. Again, if we are to even begin to reduce the rate of global warming, the graph of energy change must be changed to a down slope rather than the continuously rising one show here.
Figure 3b compares the IPCC’s estimates with the somewhat higher estimates presented in this paper.
Conclusion
There is absolutely no good news in the vast array of evidence assembled into these few graphs (assuming the work stands up to peer review, which it almost certainly will). Nothing humans have done to date has had a visible impact on the ominous trends into the climate crisis of the 6th global mass extinction in a ‘Hothouse Earth’ that will simply be too hot for many keystone species to survive physiologically. Beginning with Steffen et al’s, “Trajectories of the Earth System in the Anthropocene” and “Tripping down the road to Earth’s Hothouse Hell and Global Mass Extinction“, a series of articles in Climate Sentinel News explains that falling into the hothouse hell will be as easy as falling off a cliff.
As noted herein above, if we are to get off that road to Hell before it is too steep for that to be possible, we basically have to turn the graphs shown above upside down, so the trends are back towards where they were in the first half of the last century. We won’t be able to do this as long as our governments continue protecting and subsidizing the fossil fuel industries that are still making things worse from one year to the next. Basically our governments will have to work together and mobilize a global war against the climate emergency. Individually, as is the case in global war, we’ll probably have to accept rationing of critical or polluting resources and some curtailment of our usual freedoms to make things worse….
It will be hard, but consider this: It took us more about 100 years from beginning in 1927 with 2 bn people and steampunk technology to accidentally warm the planet to its present state. Starting now, with 2023’s highly advanced and incredibly more powerful technologies and scientific knowledge, we should be able cool the planet back to a sustainable temperature.
The first step has to be fixing our political systems so they work for all humans rather than working to make a few vested special interests become insanely wealthy and powerful individuals at the expense of the planetary biosphere.
Featured Image:
Summary from the Copernicus ESDD article bringing reported values from IPCC AR6 report up to date at the end of 2022. The causal chain from emissions to resulting warming of the climate system. Emissions of GHG have 1190 increased rapidly over recent decades (panel a). These emissions have led to increases in the atmospheric concentrations of several GHGs including the three major well-mixed GHGs (panel b). The global surface temperature (shown as annual anomalies from an 1850–1900 baseline) has increased by around 1.15°C since 1850–1900 (panel c). The human-induced warming estimate is a close match to the observed warming (panel d). Whiskers show 5% to 95% ranges. Figure is modified from AR6 SYR (Figure 2.1, Lee et al., 2023).
Views expressed in this post are those of its author(s), not necessarily all Vote Climate One members.
Closeup of long chain of Salp zooids (tunicate / feeds on phytoplankton). Photo by Larry Madin, Woods Hole Oceanographic Institution
Confetti squid. Photo by Paul Caiger, Woods Hole Oceanographic Institution.
Bobtail squid (order Sepiolida) are a group of cephalopods closely related to cuttlefish. Bobtail squid tend to have a rounder mantle than cuttlefish and have no cuttlebone. Photo by Paul Caiger, Woods Hole Oceanographic Institution.
The twilight zone is home to more fish than the rest of the ocean combined. Most of these fish—and other organisms that live in the zone—are tiny, measuring just a few inches long or less. But some, like gelatinous siphonophores, can form chains that extend as much as 130 feet, making them among the biggest animals on Earth. Even the smallest twilight zone inhabitants can be powerful through sheer number, however. A tiny but fierce-looking fish called a bristlemouth is the most abundant vertebrate on the planet—for every one human, there are more than 100,000 bristlemouths.
…
How does life in the twilight zone affect global climate?
By migrating to and from the surface, eating, being eaten, dying—and even by pooping—organisms in the twilight zone transport huge amounts of carbon from surface waters into the deep ocean. That process, called the biological pump, plays an important role in regulating Earth’s climate.
Abstract: Paleontological reconstructions of plankton community structure during warm periods of the Cenozoic (last 66 million years) reveal that deep-dwelling ‘twilight zone’ (200–1000 m) plankton were less abundant and diverse, and lived much closer to the surface, than in colder, more recent climates. We suggest that this is a consequence of temperature’s role in controlling the rate that sinking organic matter is broken down and metabolized by bacteria, a process that occurs faster at warmer temperatures. In a warmer ocean, a smaller fraction of organic matter reaches the ocean interior, affecting food supply and dissolved oxygen availability at depth. Using an Earth system model that has been evaluated against paleo observations, we illustrate how anthropogenic warming may impact future carbon cycling and twilight zone ecology. Our findings suggest that significant changes are already underway, and without strong emissions mitigation, widespread ecological disruption in the twilight zone is likely by 2100, with effects spanning millennia thereafter. [my emphasis]
Ocean fertilization to stimulate algal growth over the surface of the abyssal ocean offers a means to capture CO₂. A food chain of pelagic consumers ranging from the twilight creatures harvesting the algae and their larger predators up to whales can then capture and package the carbon capturing algae into a range of parcels from fecal pellets to dead whales that will drop to the ocean floor.
The nature of biological systems is that they are self-reproducing and can grow exponentially under suitable conditions. ‘farming’ these consumers to optimize the carbon capture and transport it to the bottom is something that might realistically have the capacity to actually reduce atmospheric CO₂ on a fast enough timescale to slow, stop and reverse global warming.
However, the articles above show that a warming ocean substantially reduces the viability of the twilight organisms that provide the packaging service. Thus, if we don’t implement this biological sink before significantly more warming occurs, this opportunity to reverse the warming process may be lost.
Featured image: Antarctic krill Euphausia superba (copyright Uwe Kils, Institute of Marine and Coastal Sciences, RUTGERS University). Along with bristlemouth fish, krill are major components in the food chain of the twilight zone’s biological carbon pump potentially sequestering carbon in the abyssal depths of the world’s oceans. The world oceans’ surfaces, away from the shallows, are comparatively sterile because the water lacks micro nutrients (e.g., iron, manganese) required to support phytoplankton. Thus, vast areas of the oceans lack effective biological pumps to sequester carbon. Fertilizing these sterile areas of the oceans with trace nutrients and farming the twilight zone (i.e., seeding with appropriate species to provide the biological pumping mechanism) may establish a sufficiently extensive mechanism to sequester globally significant amounts of carbon in the abyssal depths.
.
Views expressed in this post are those of its author(s), not necessarily all Vote Climate One members.

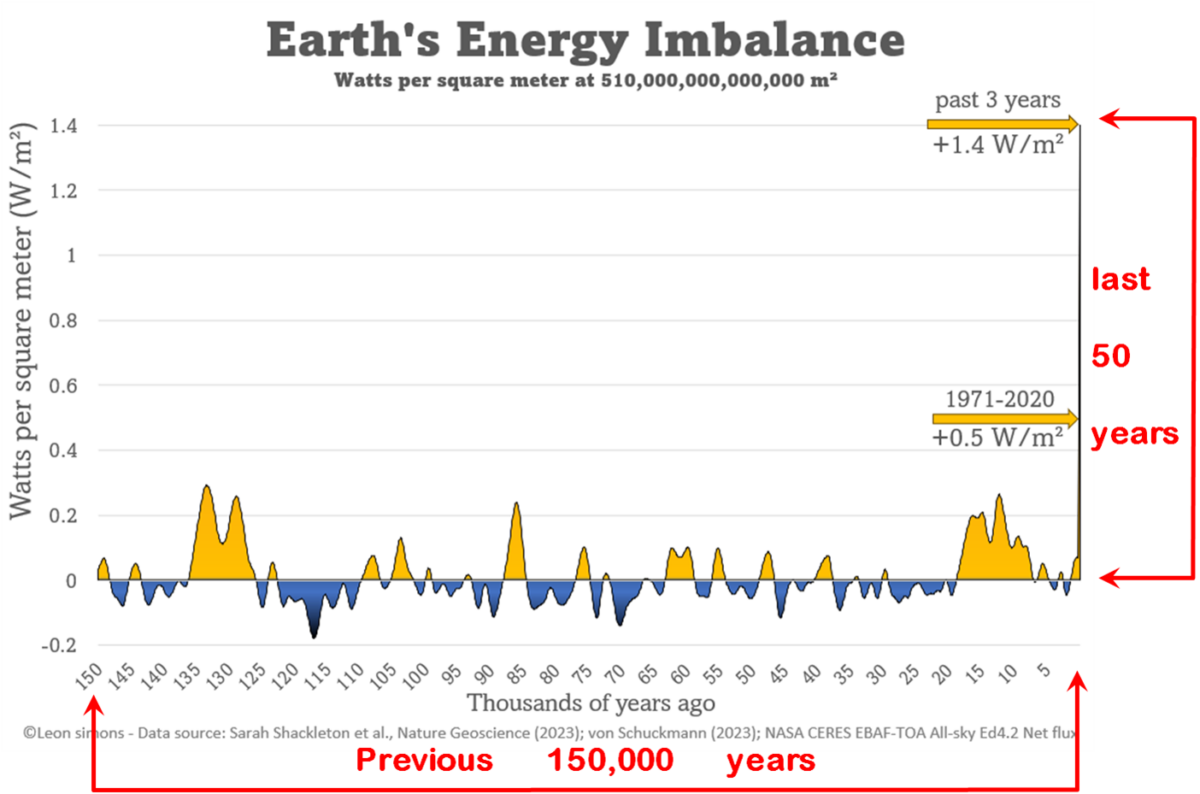
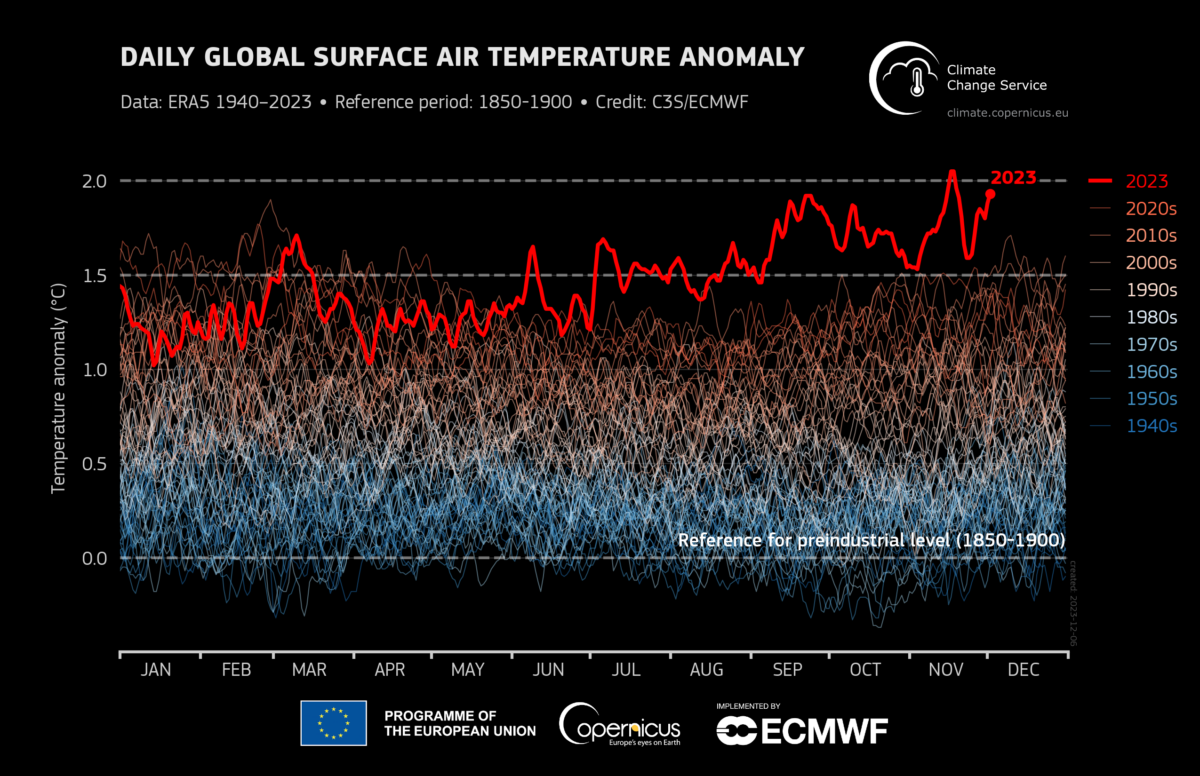
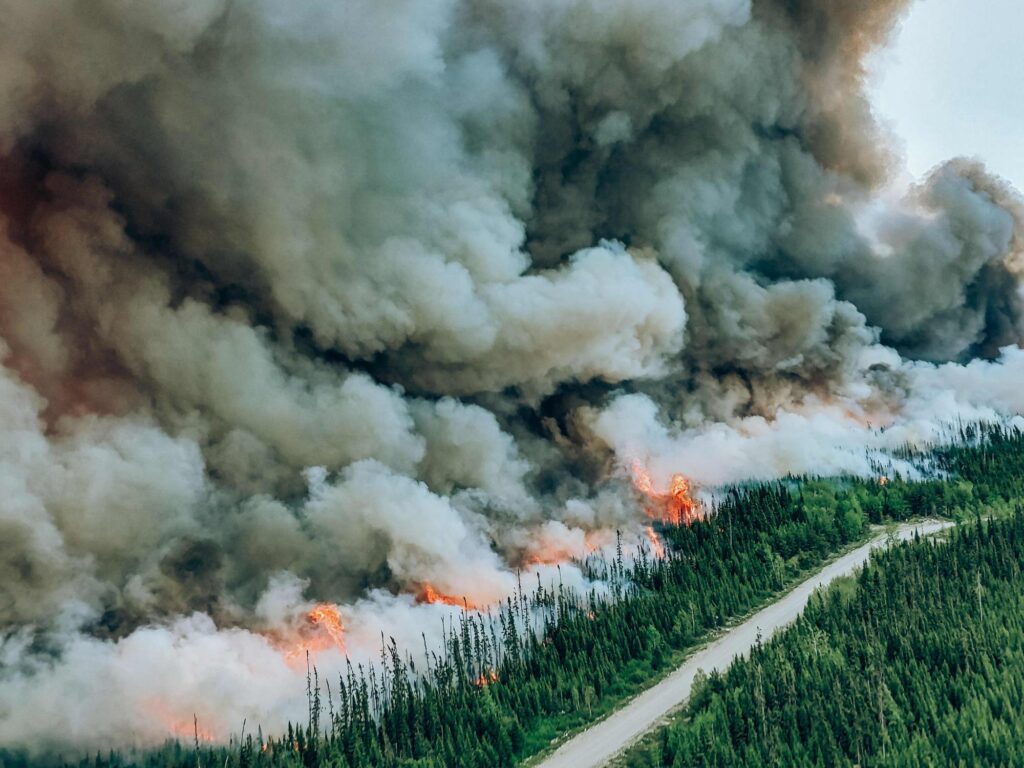
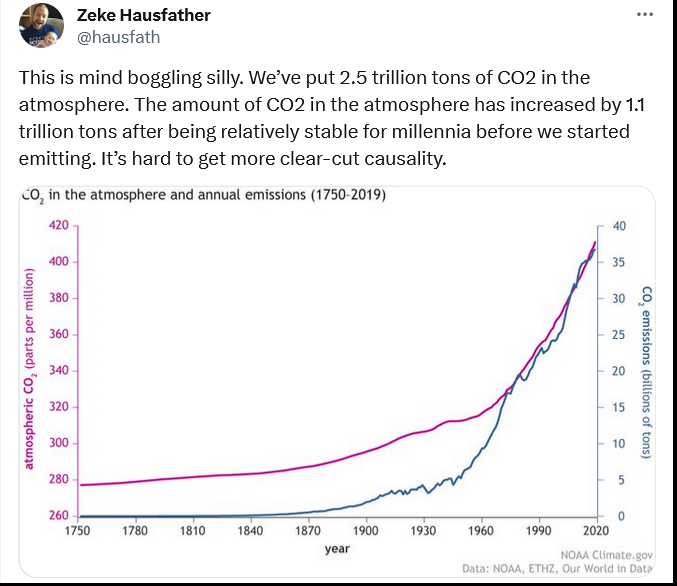
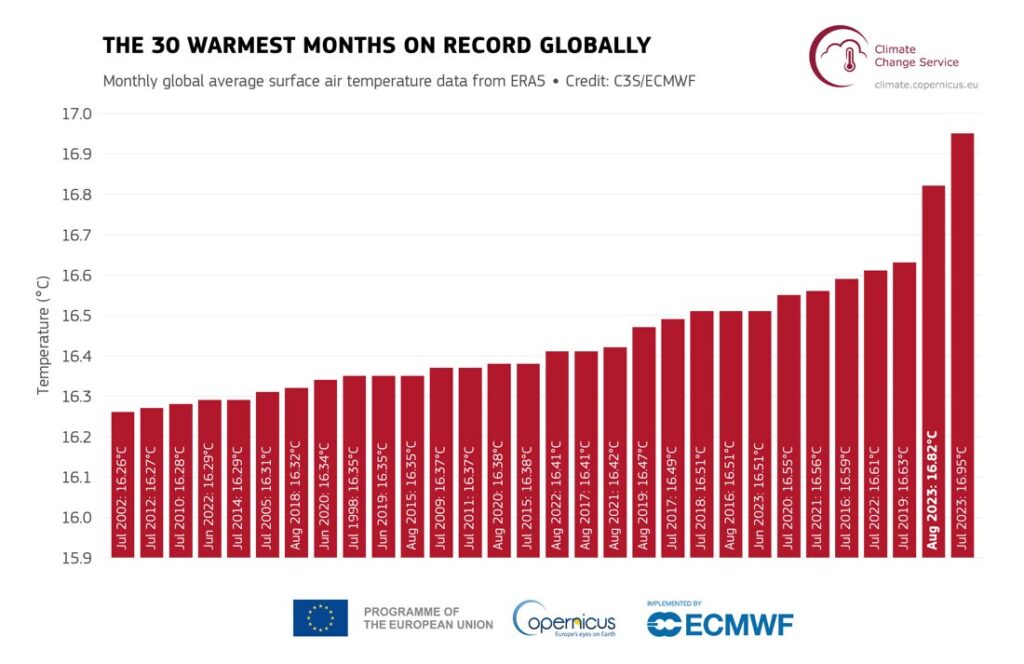
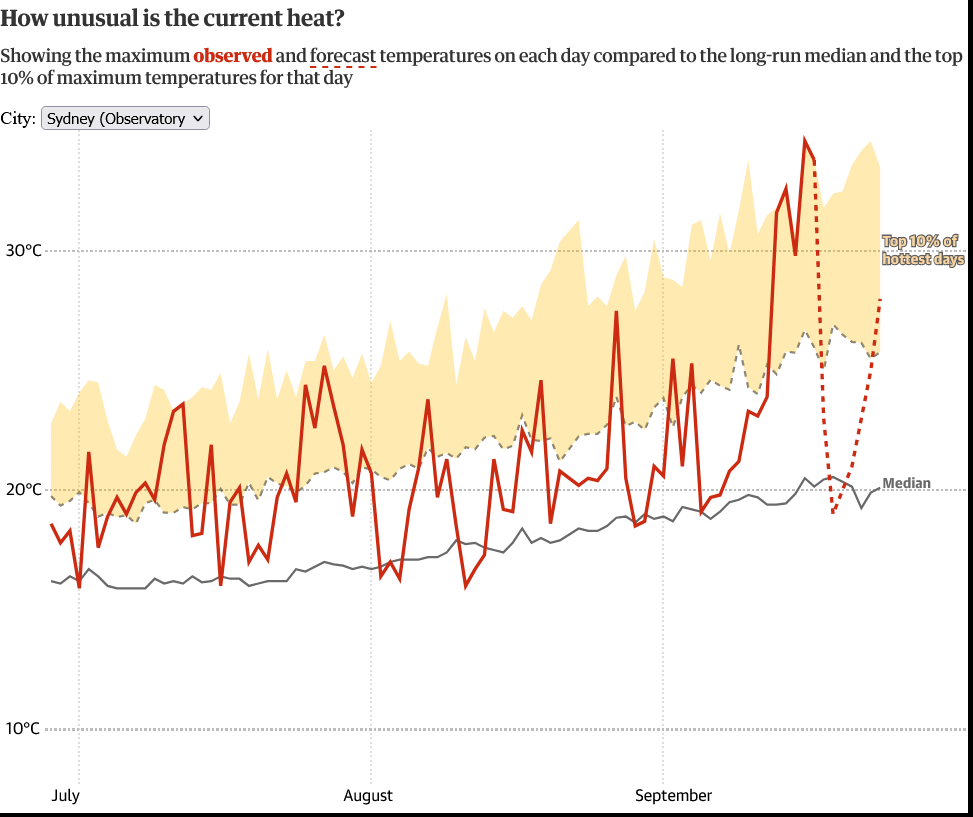
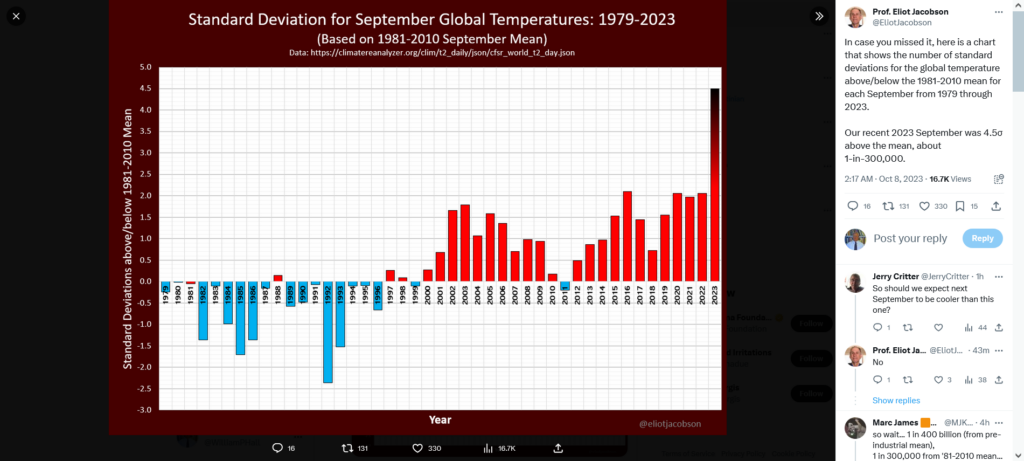
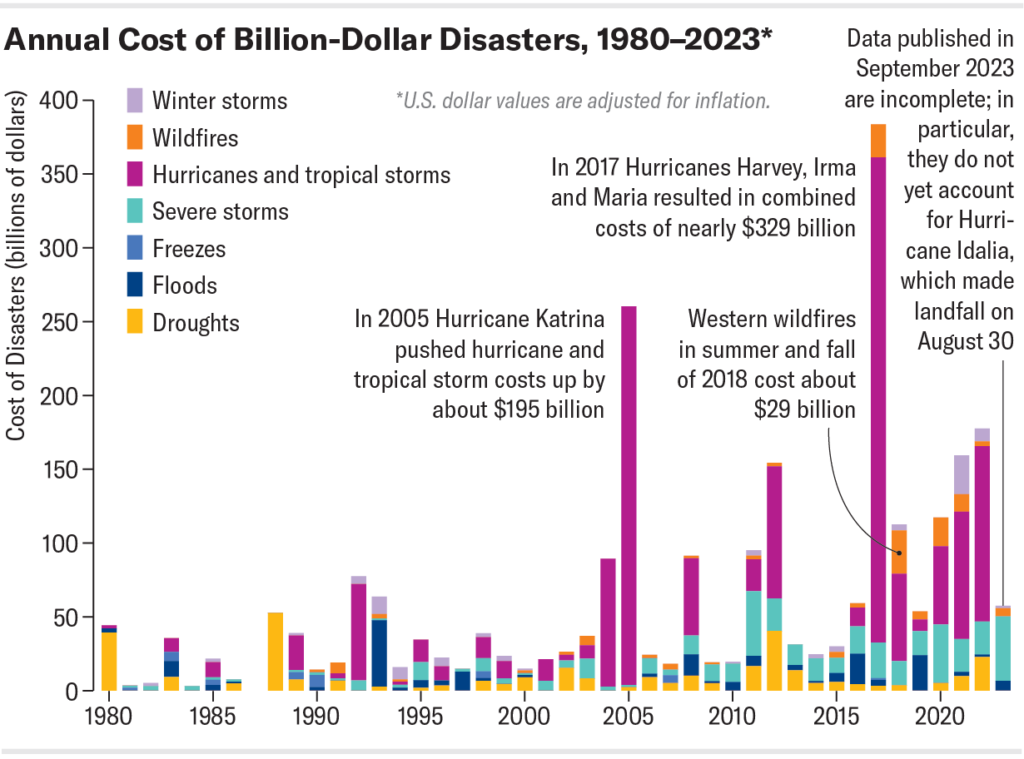

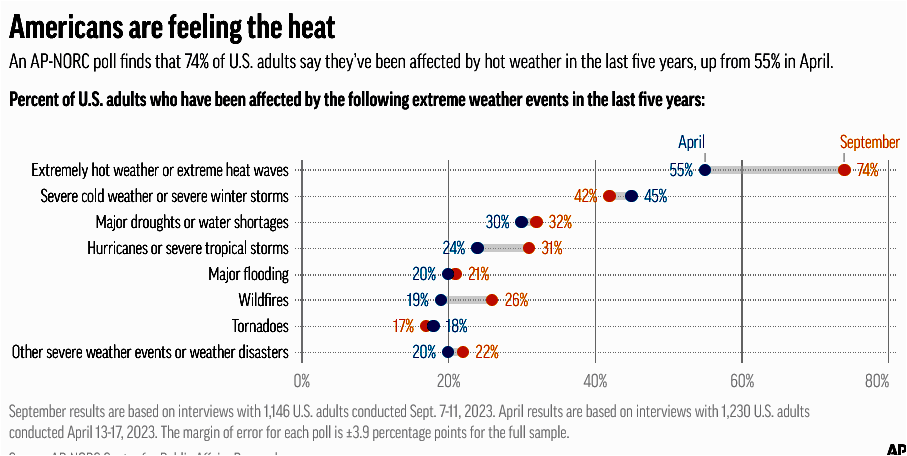
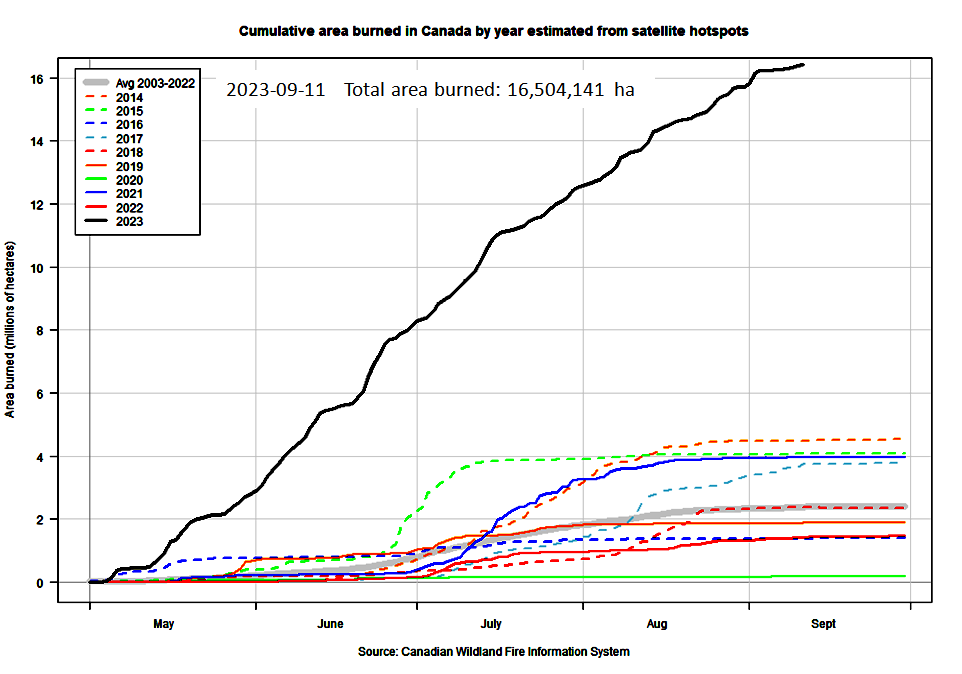
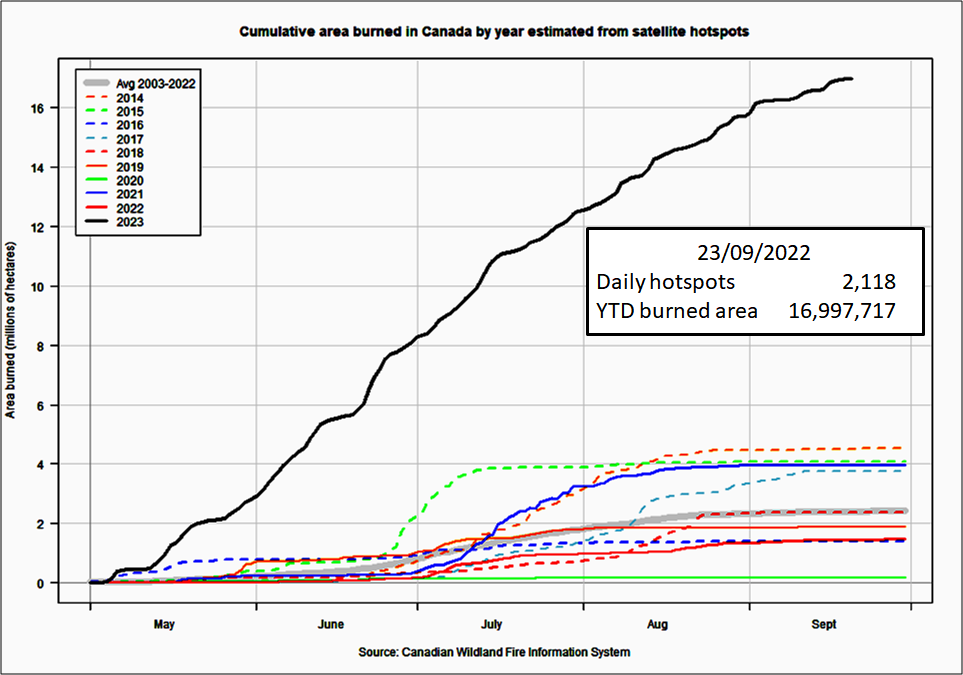
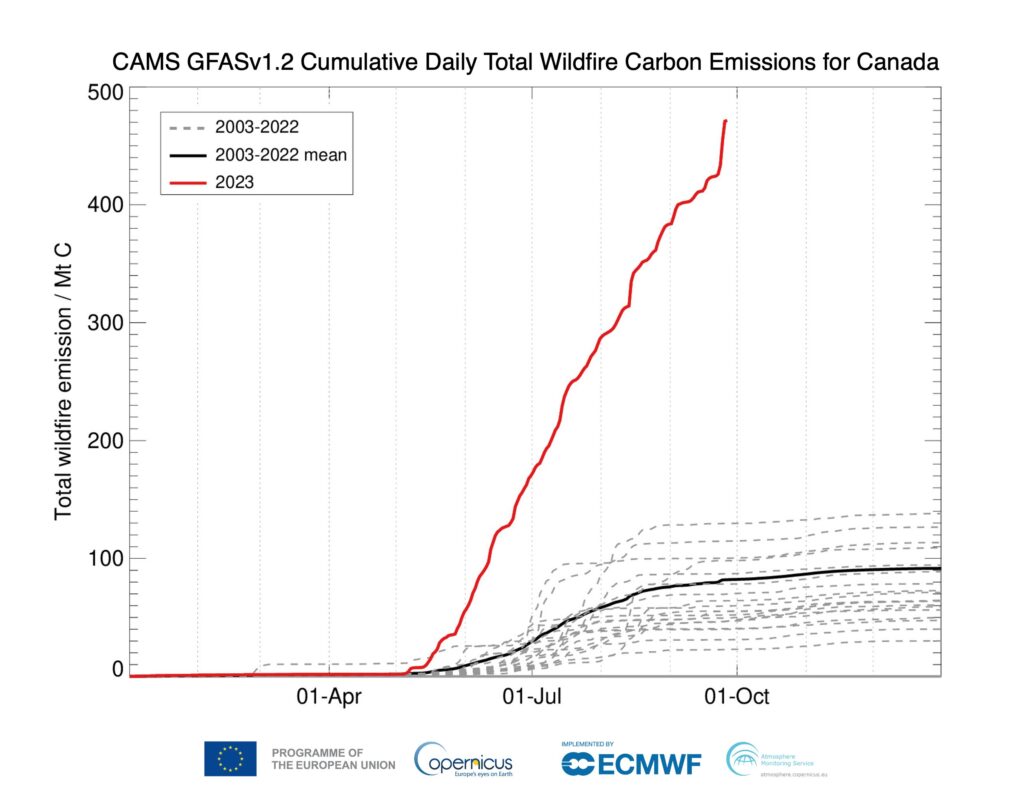
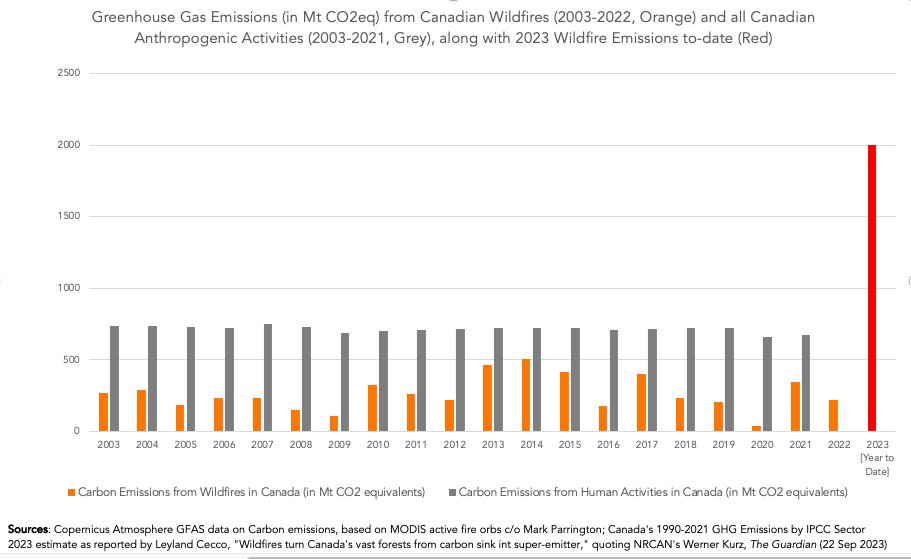
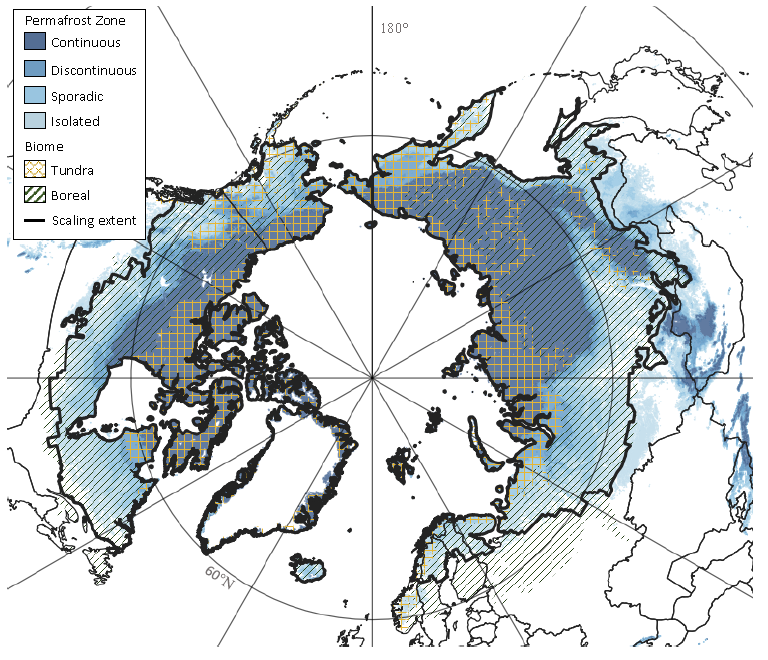
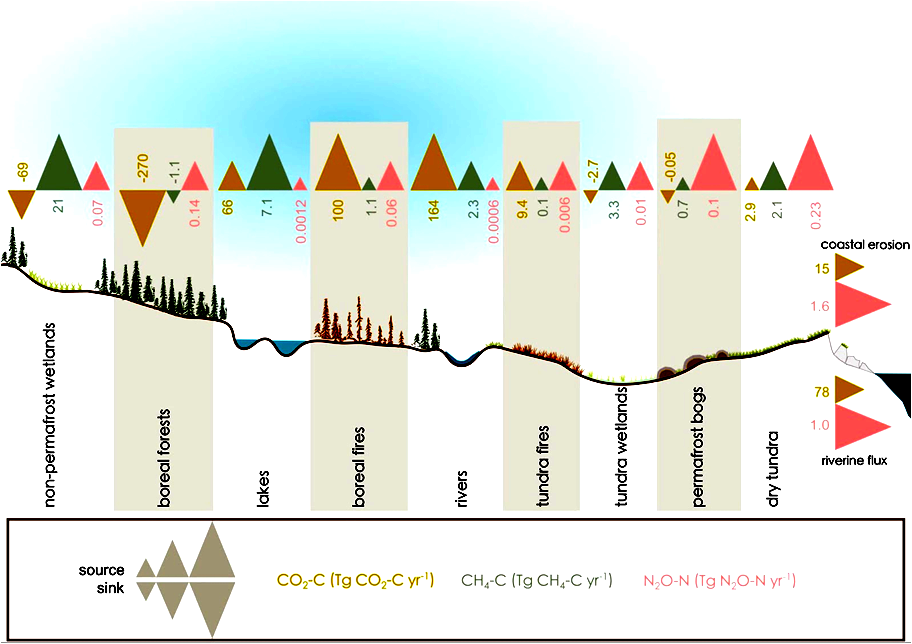
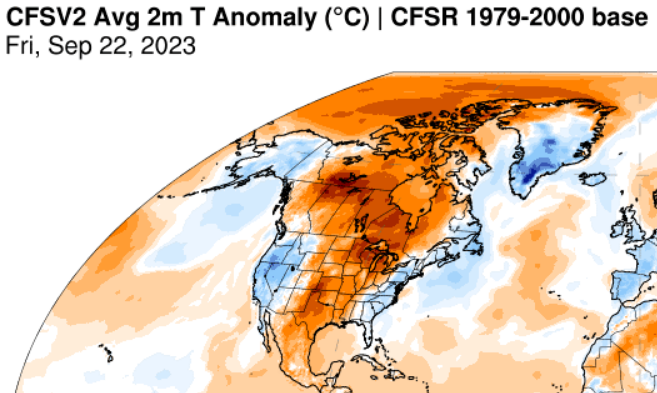
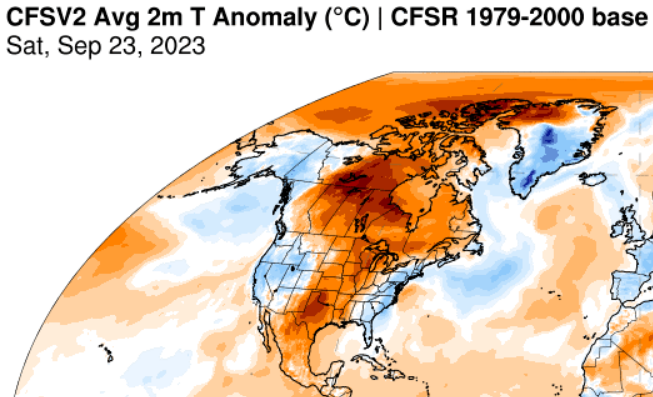
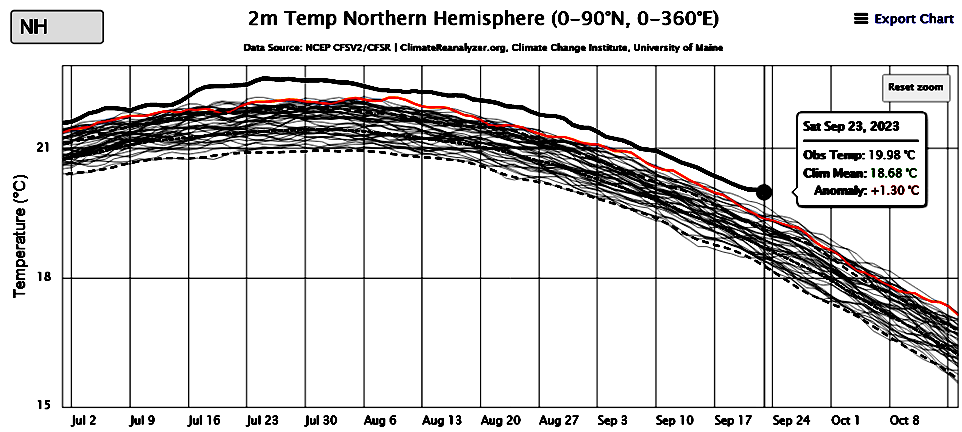
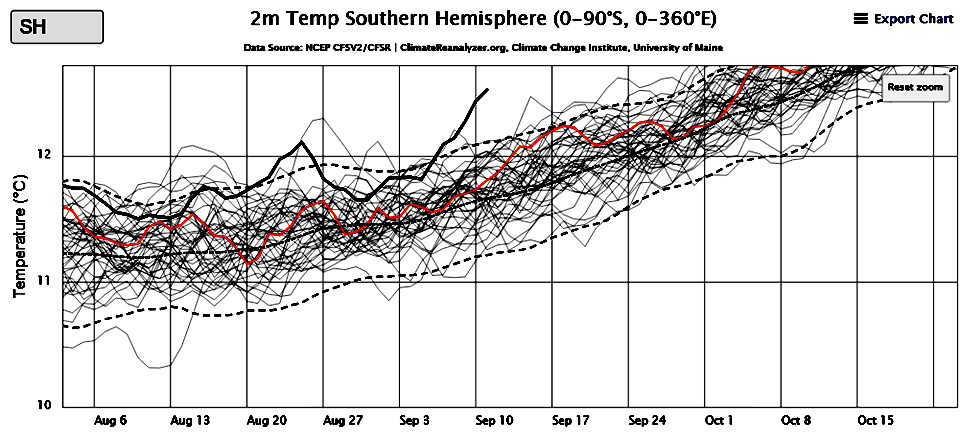
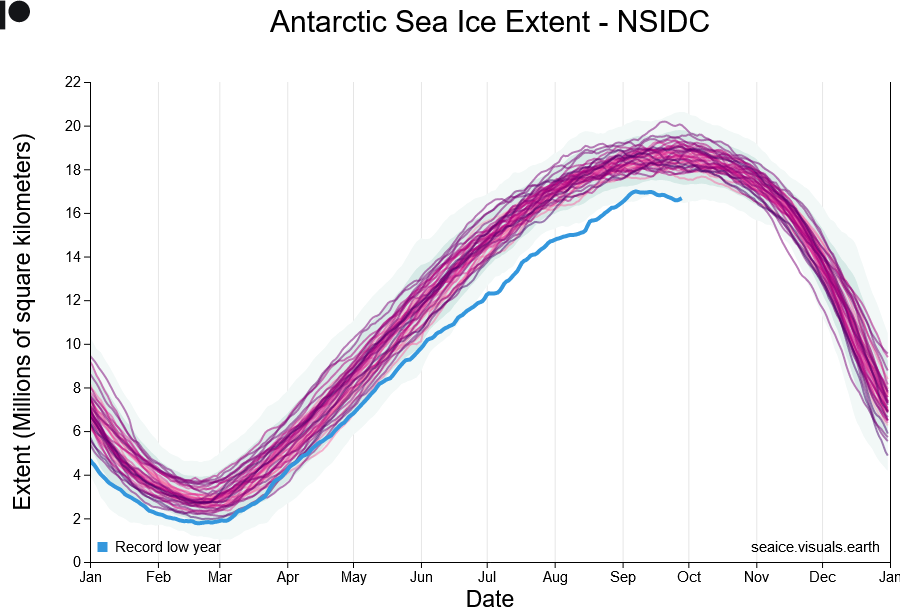
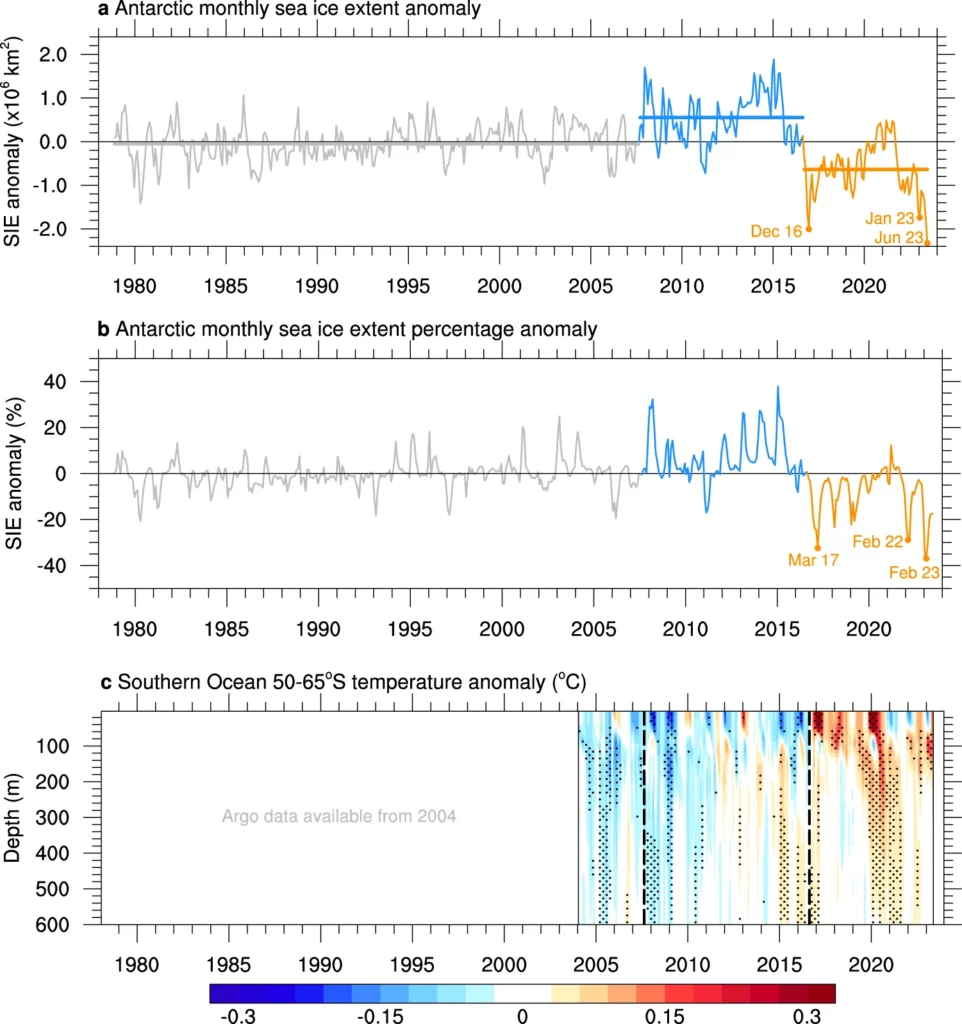
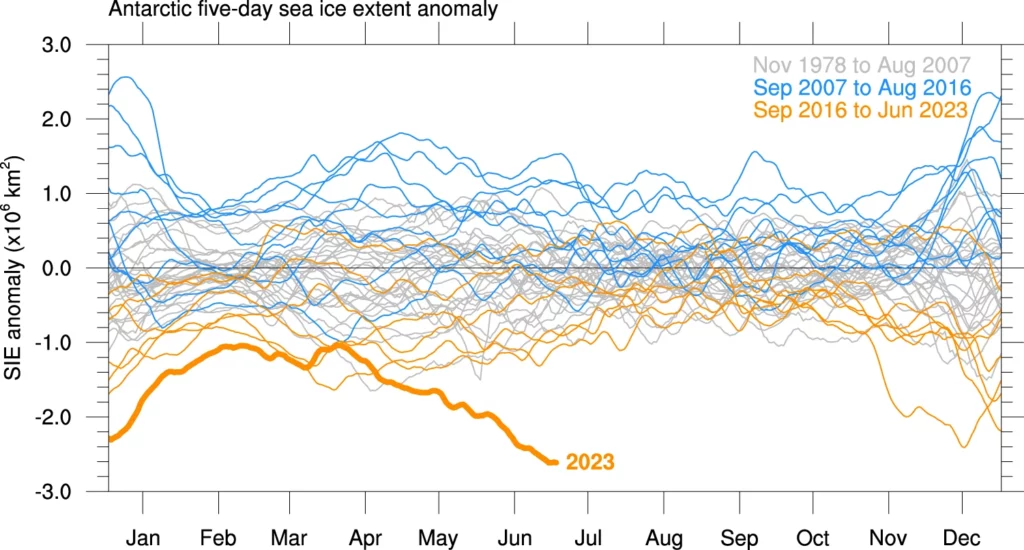
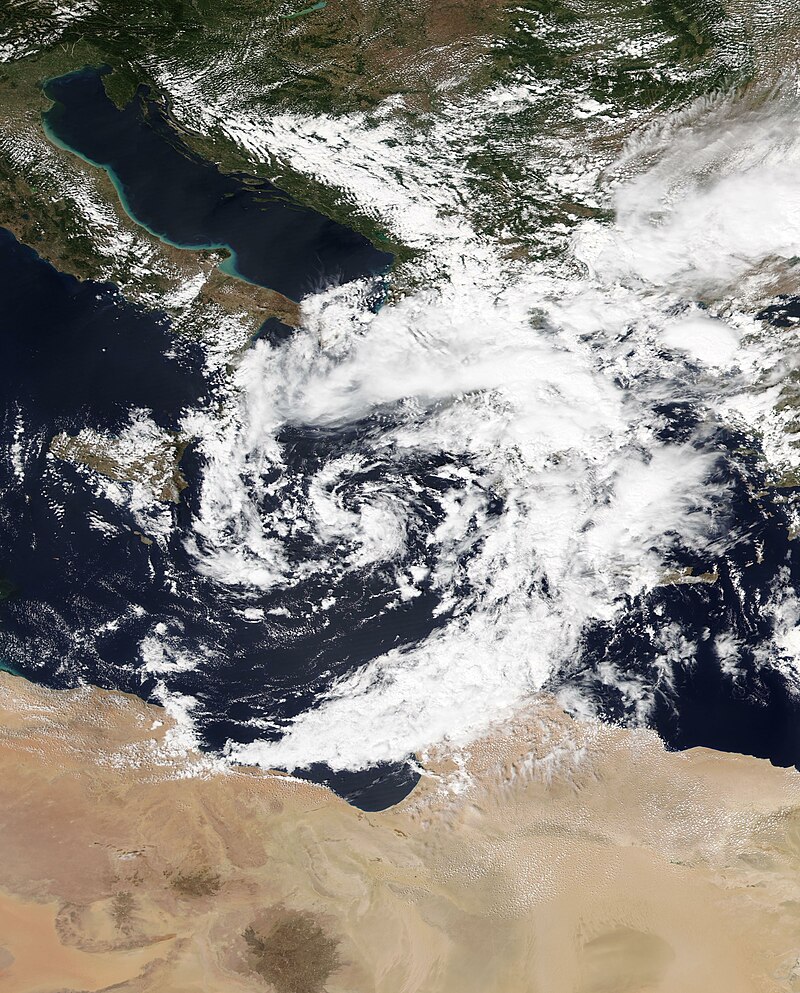
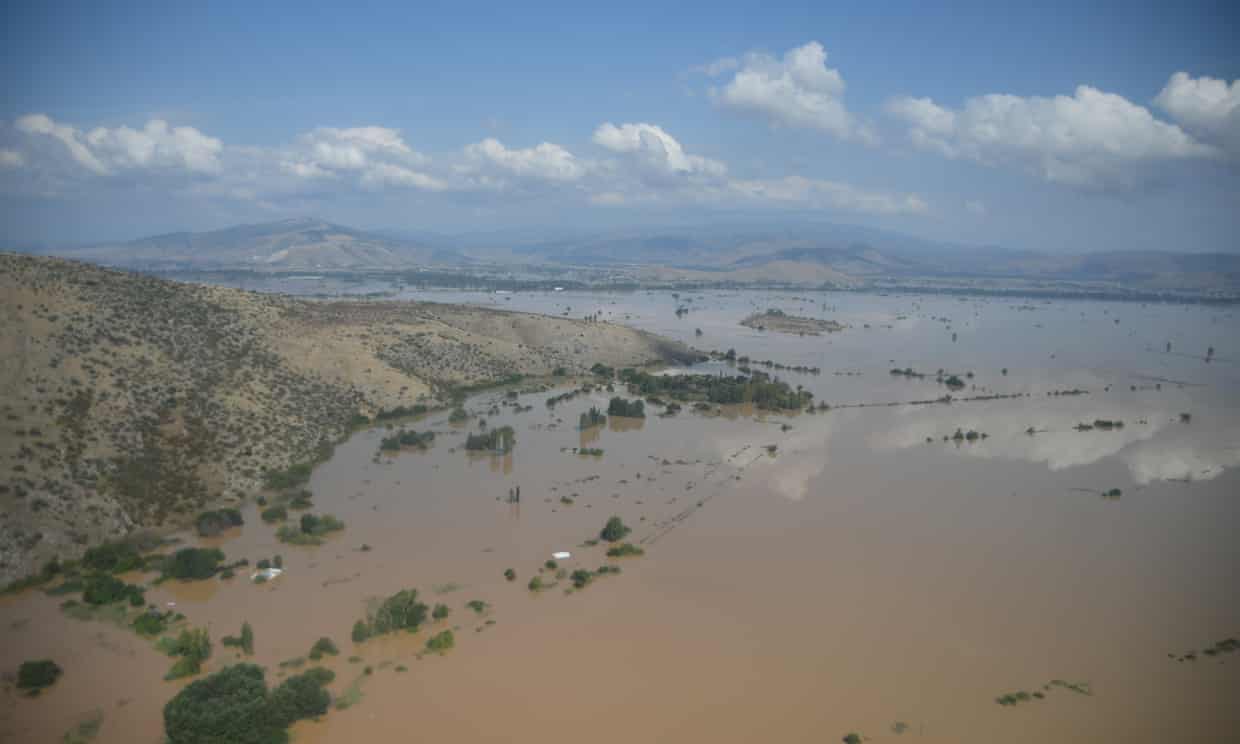
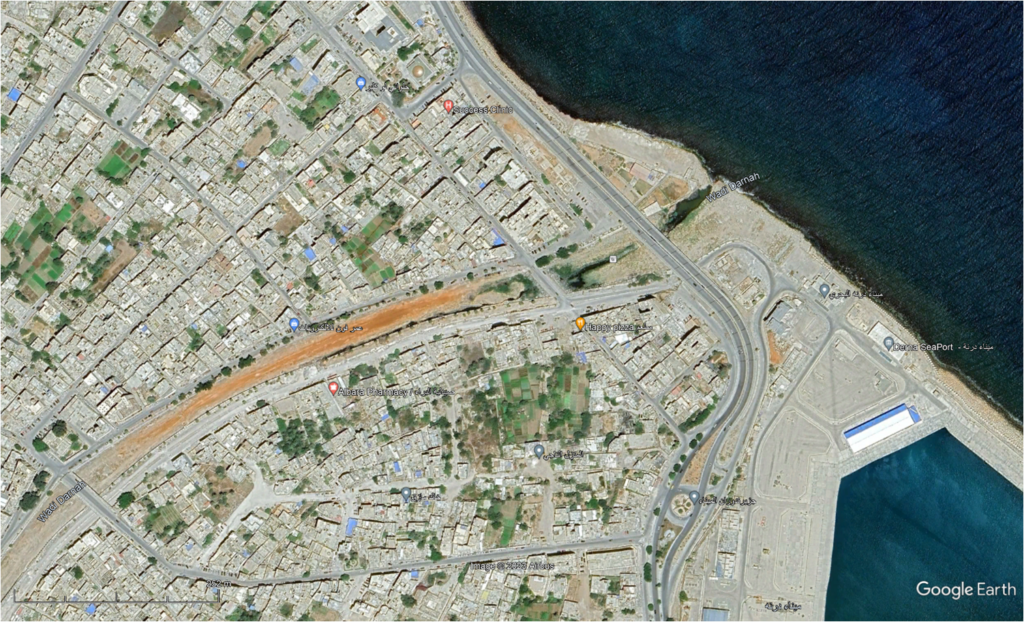
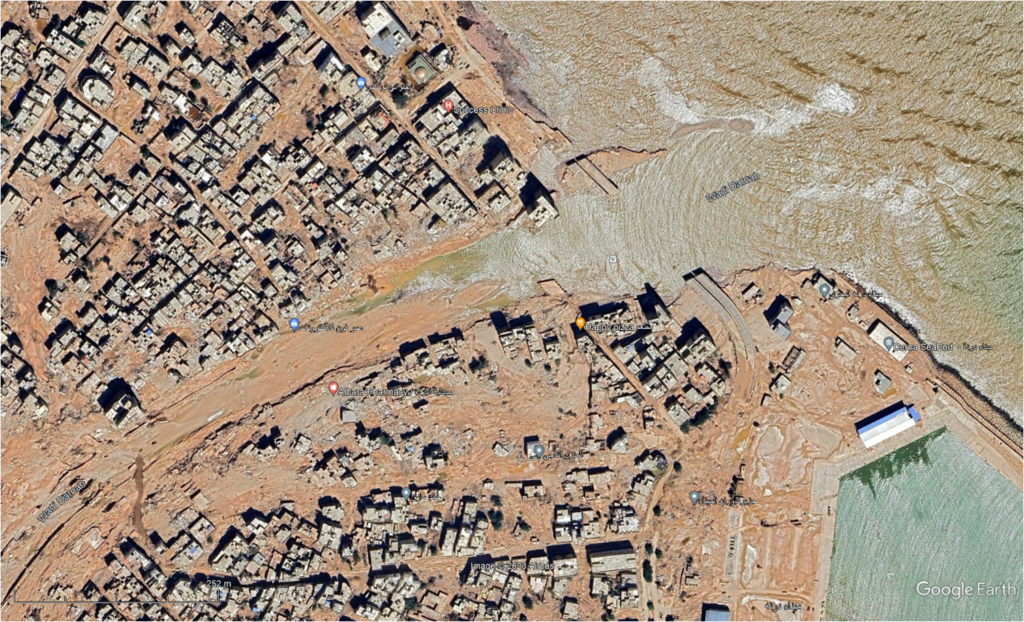
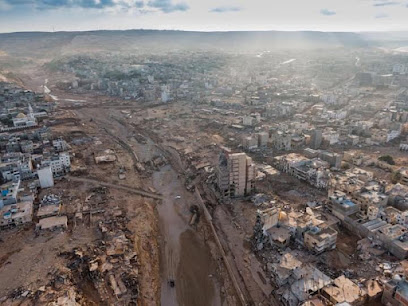
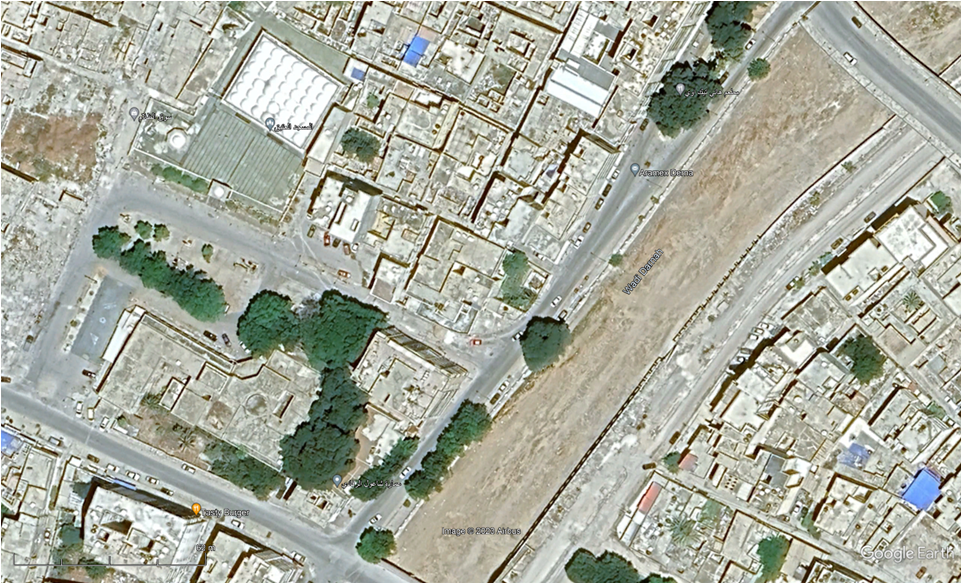
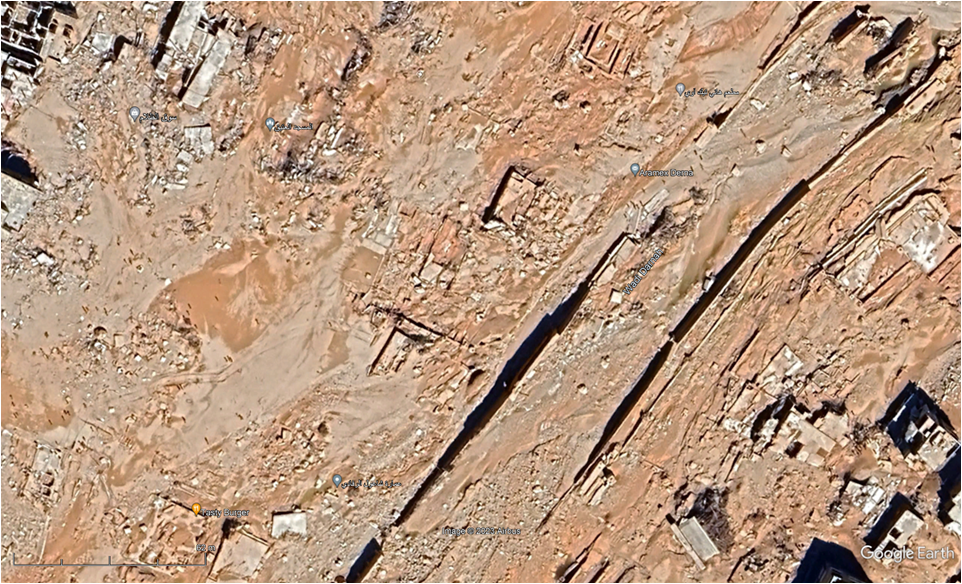
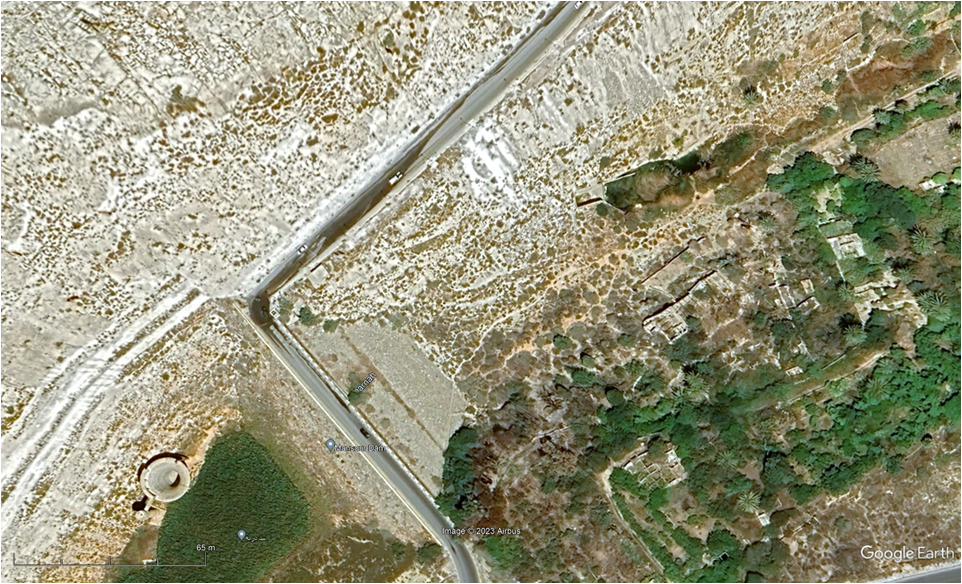
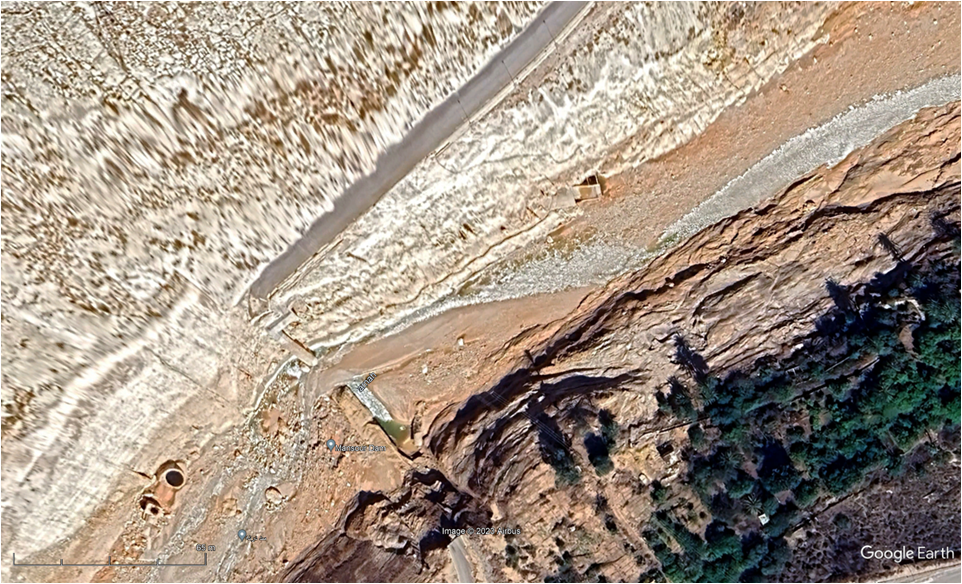
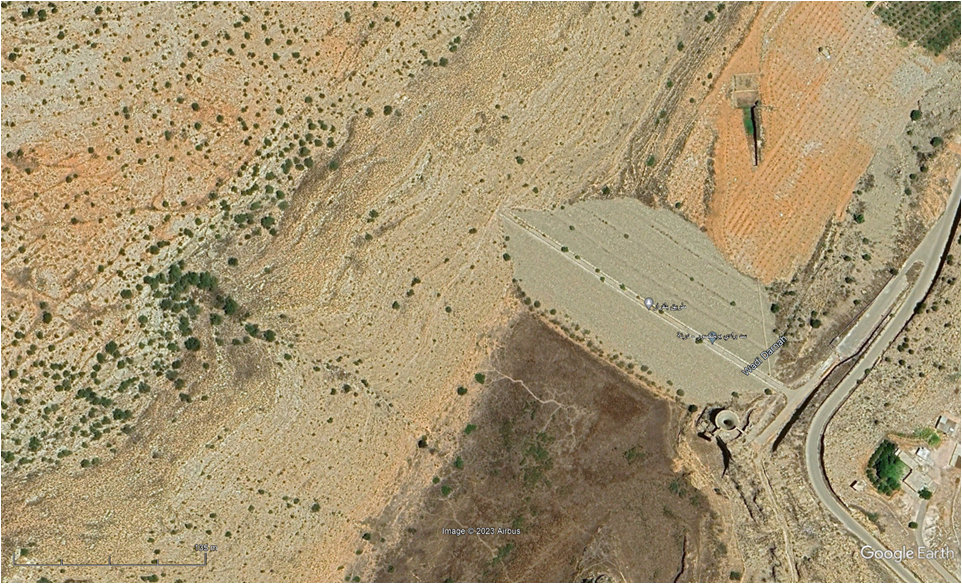
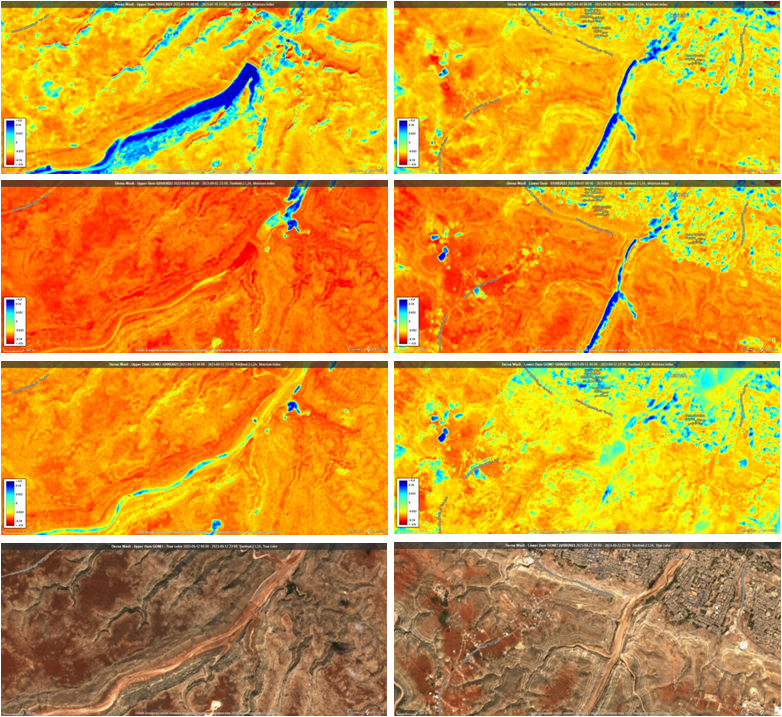
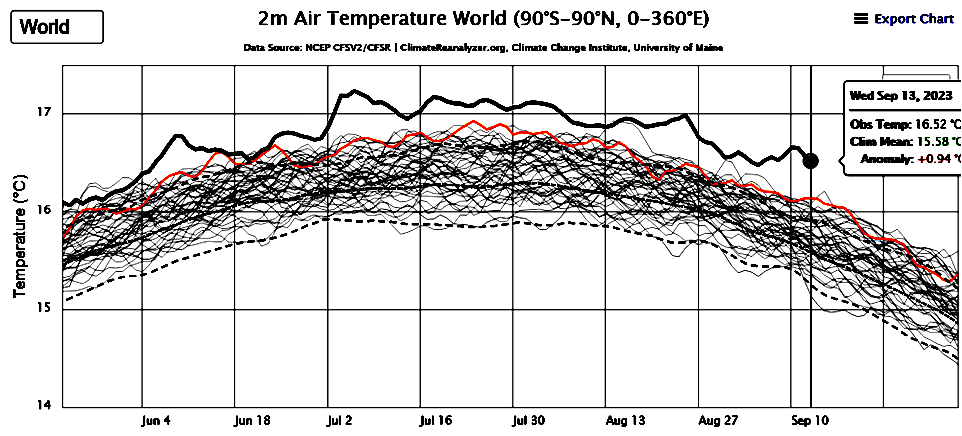
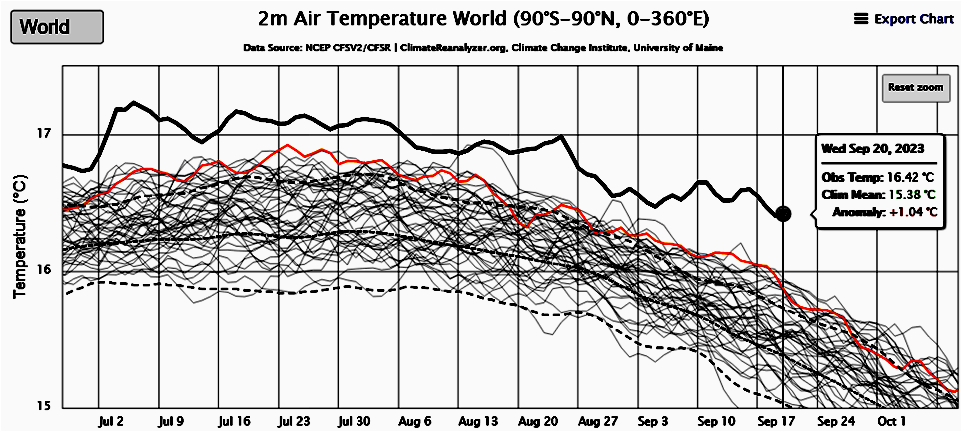
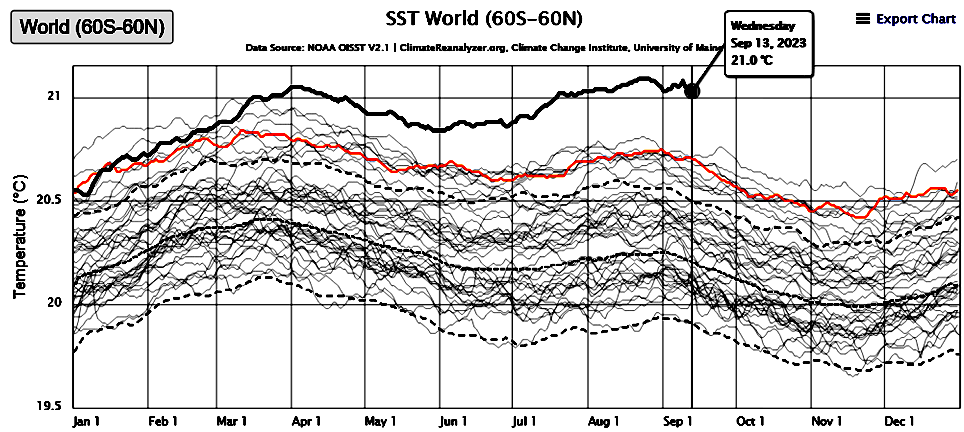
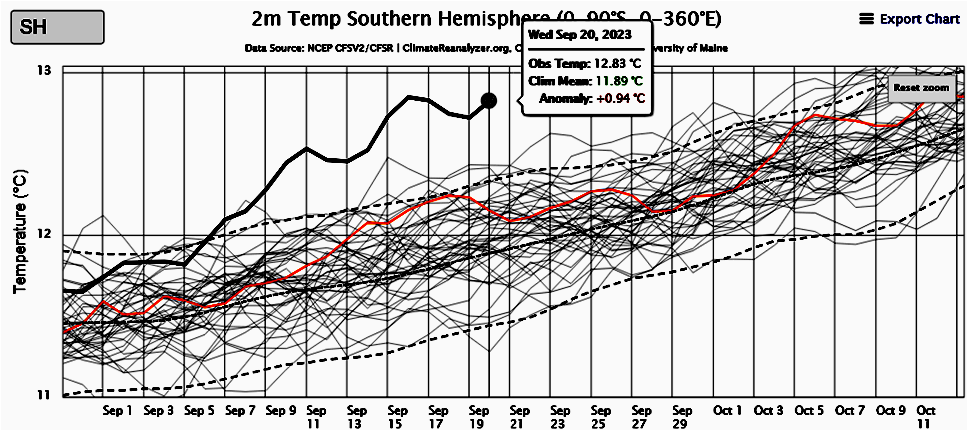
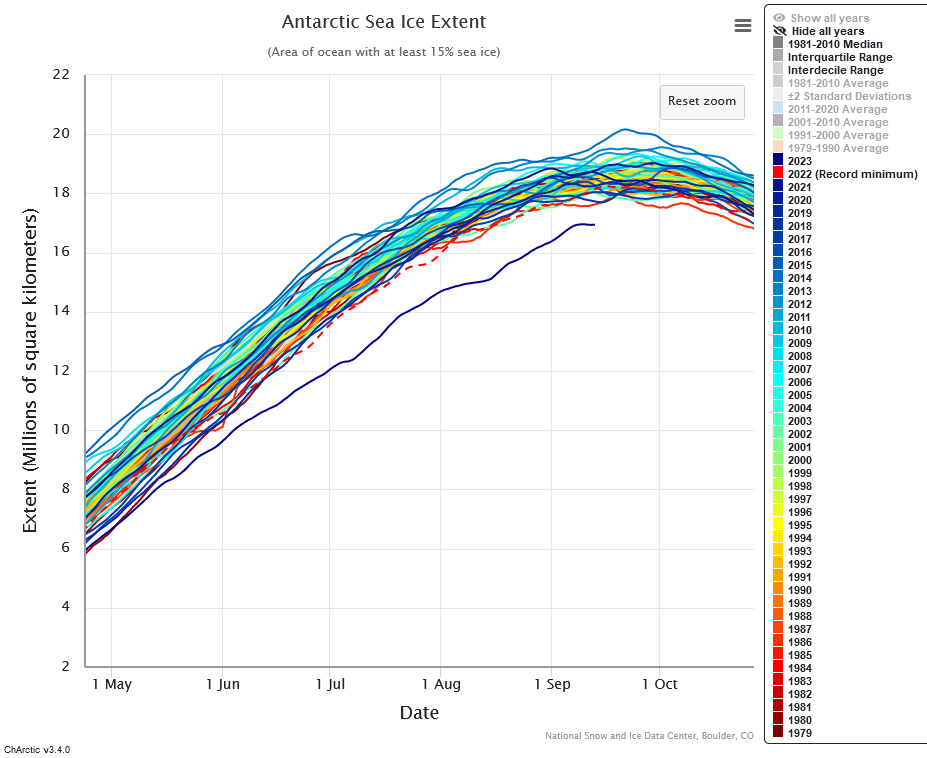
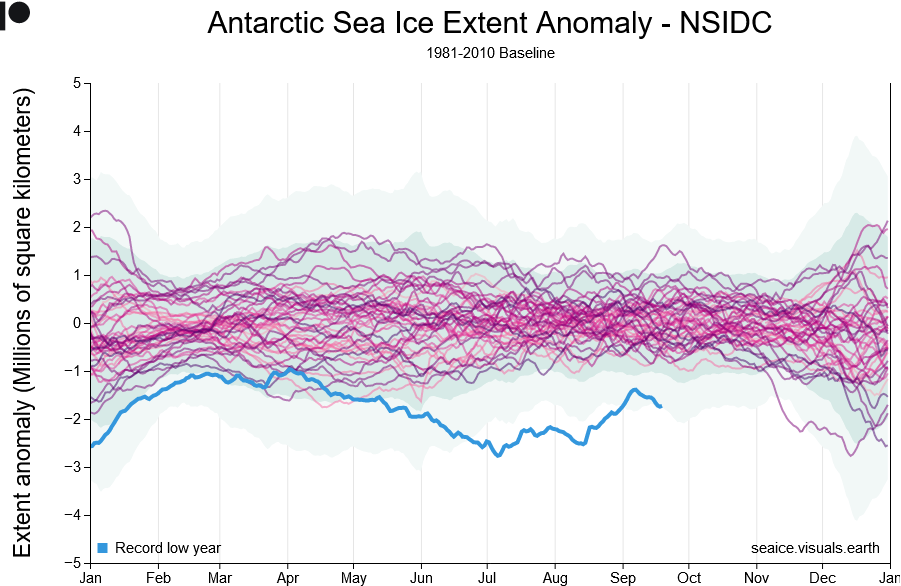
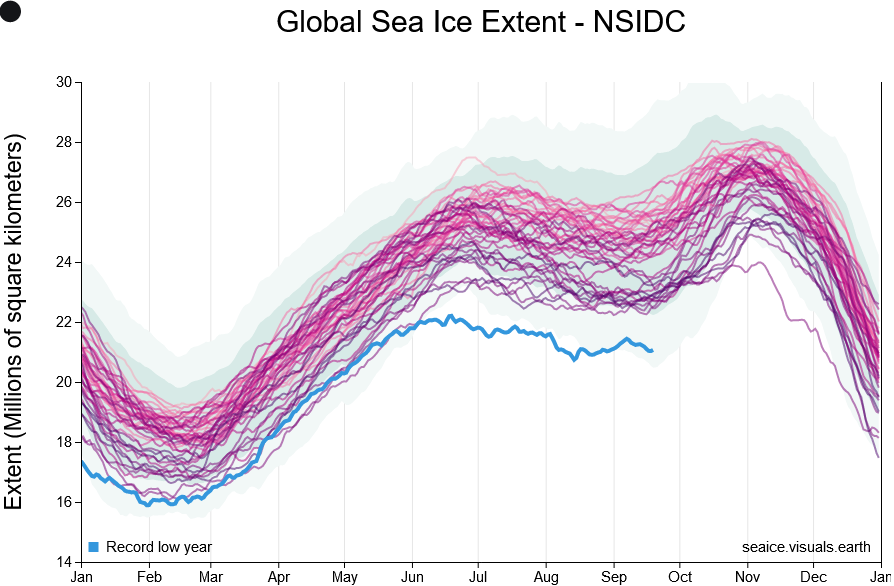
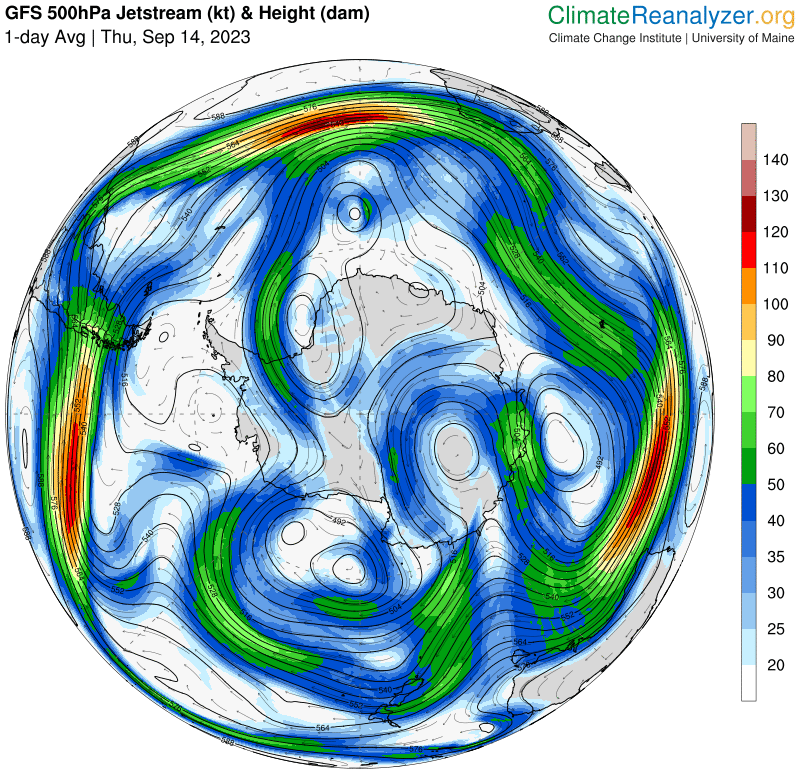
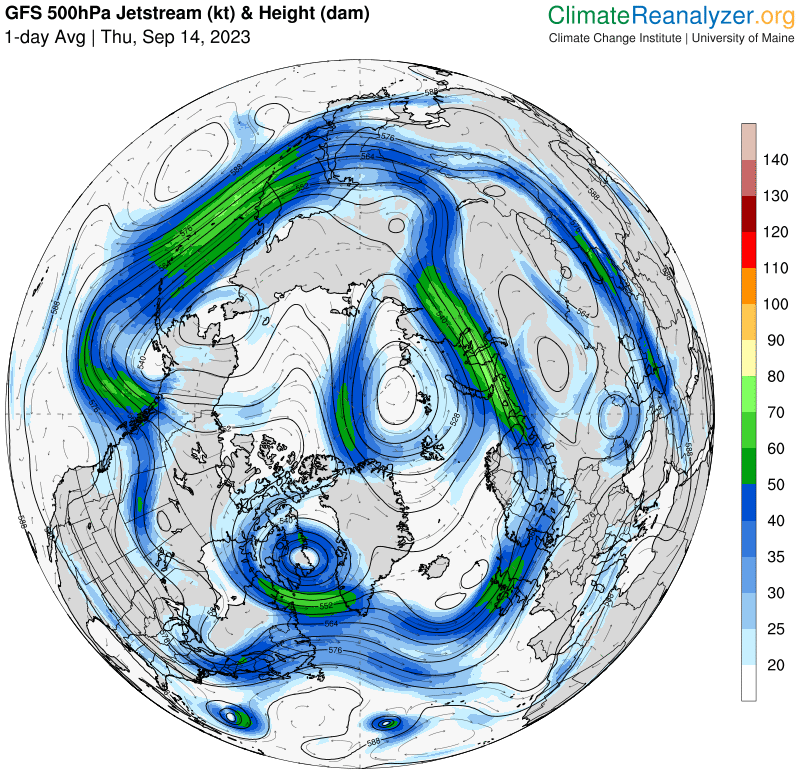
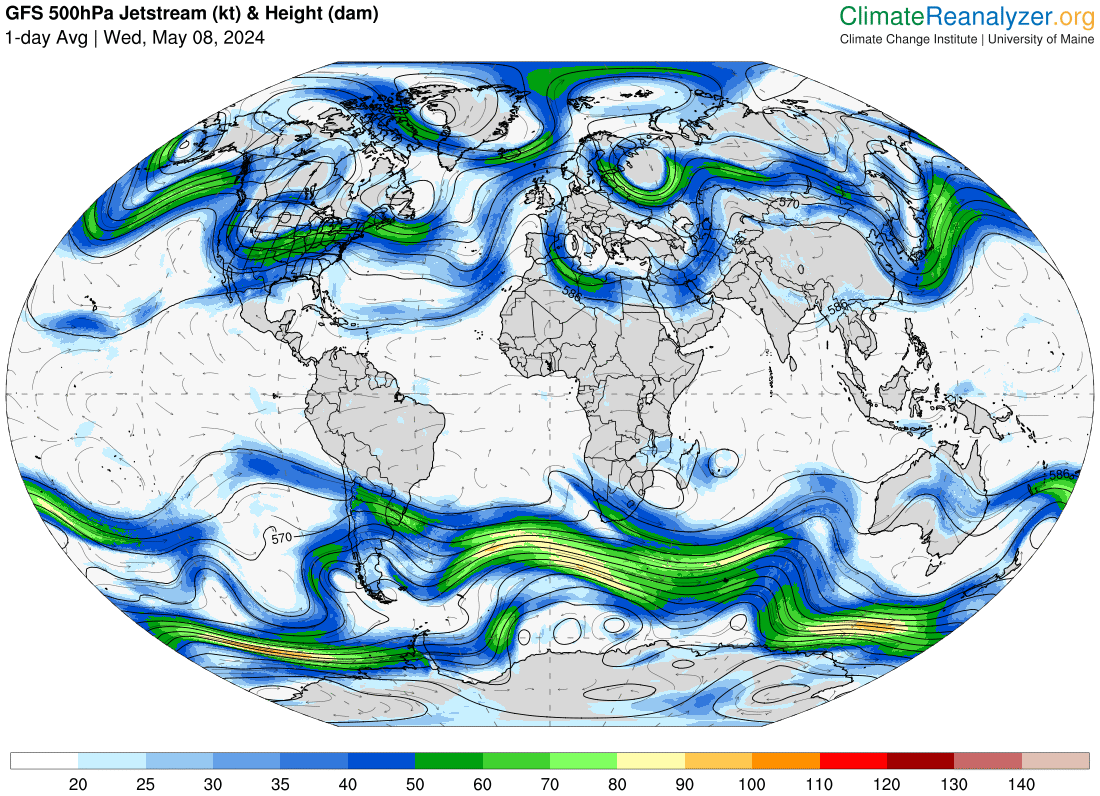
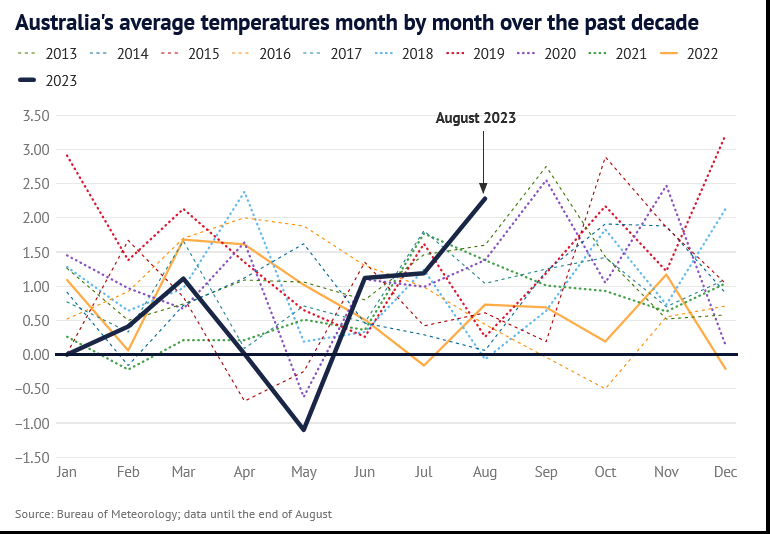
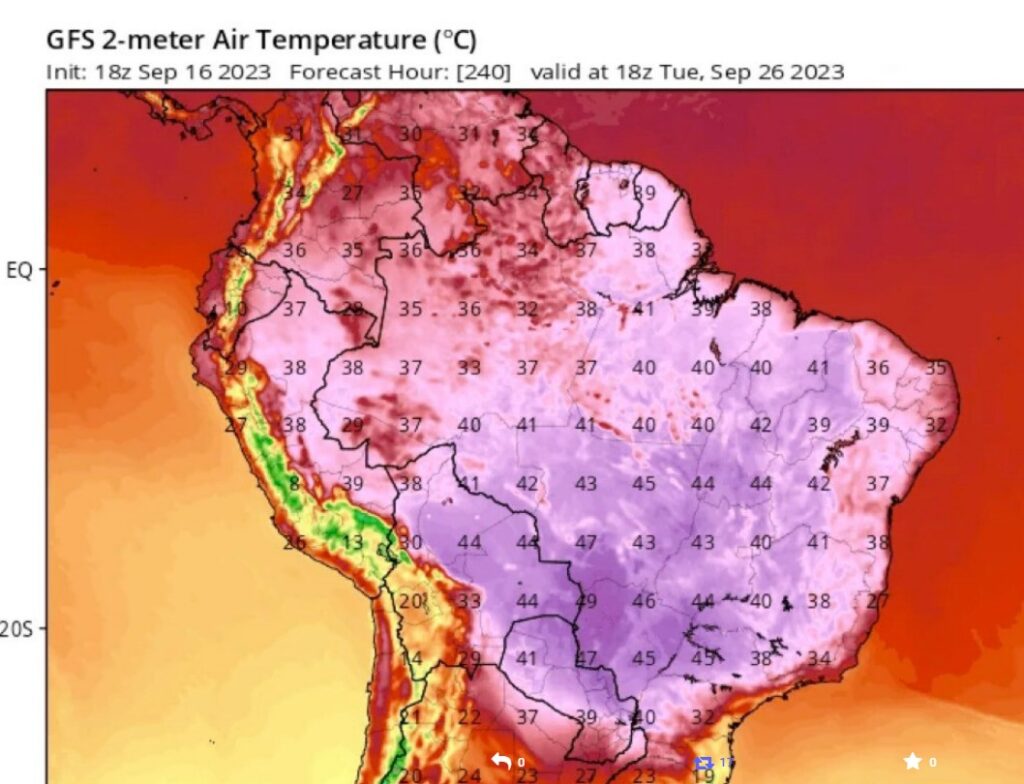
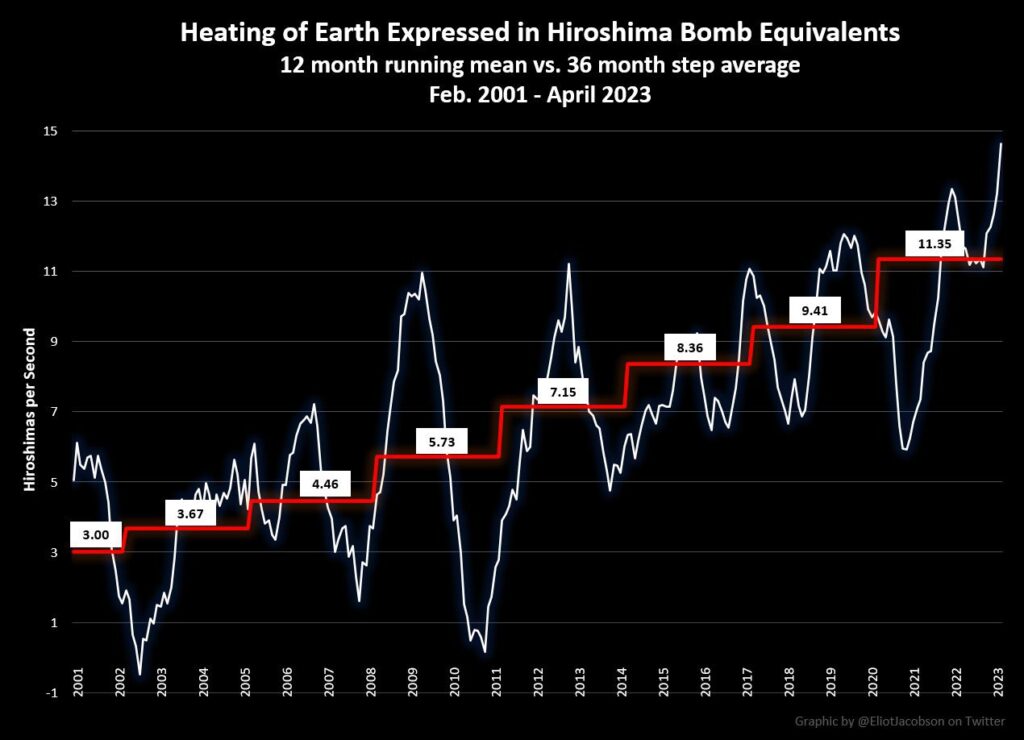
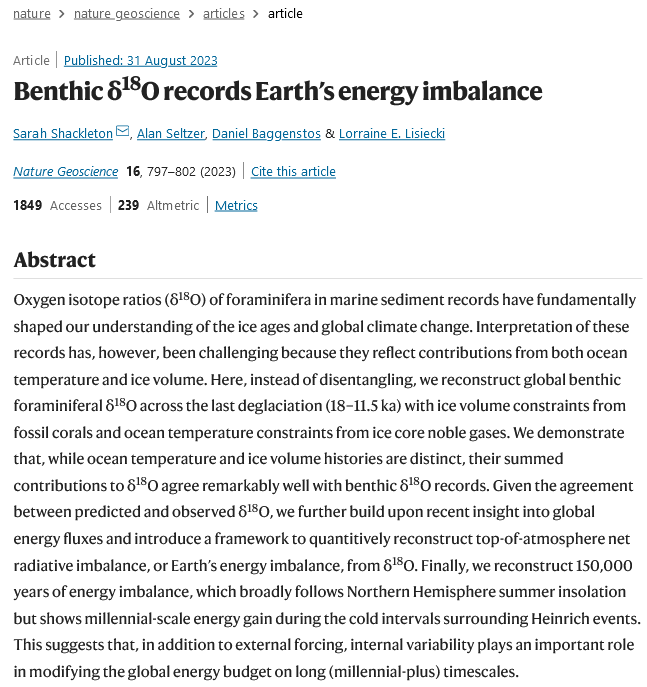
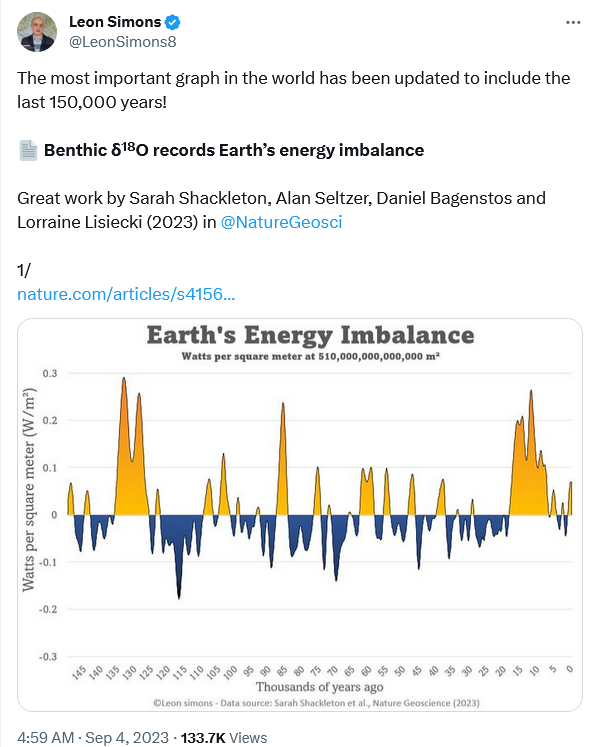
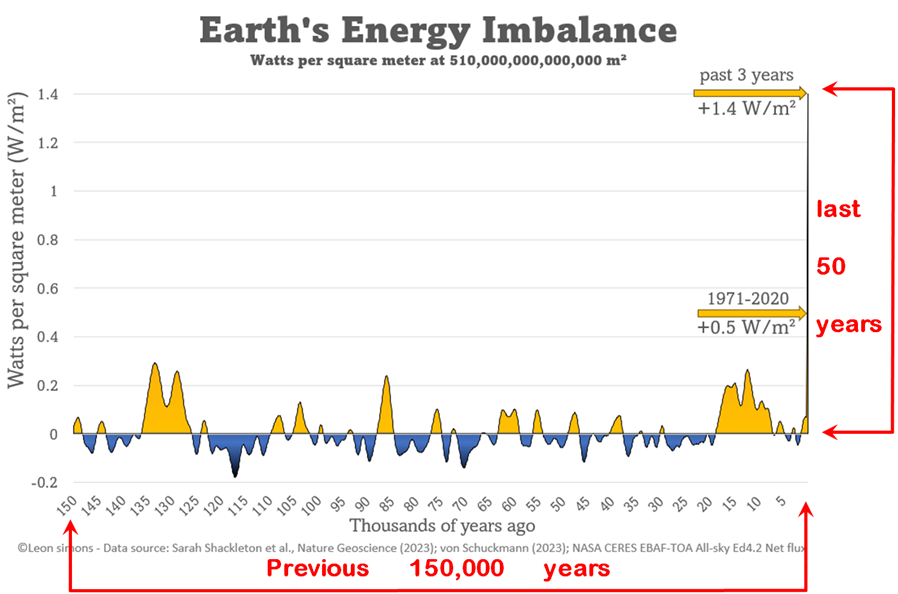
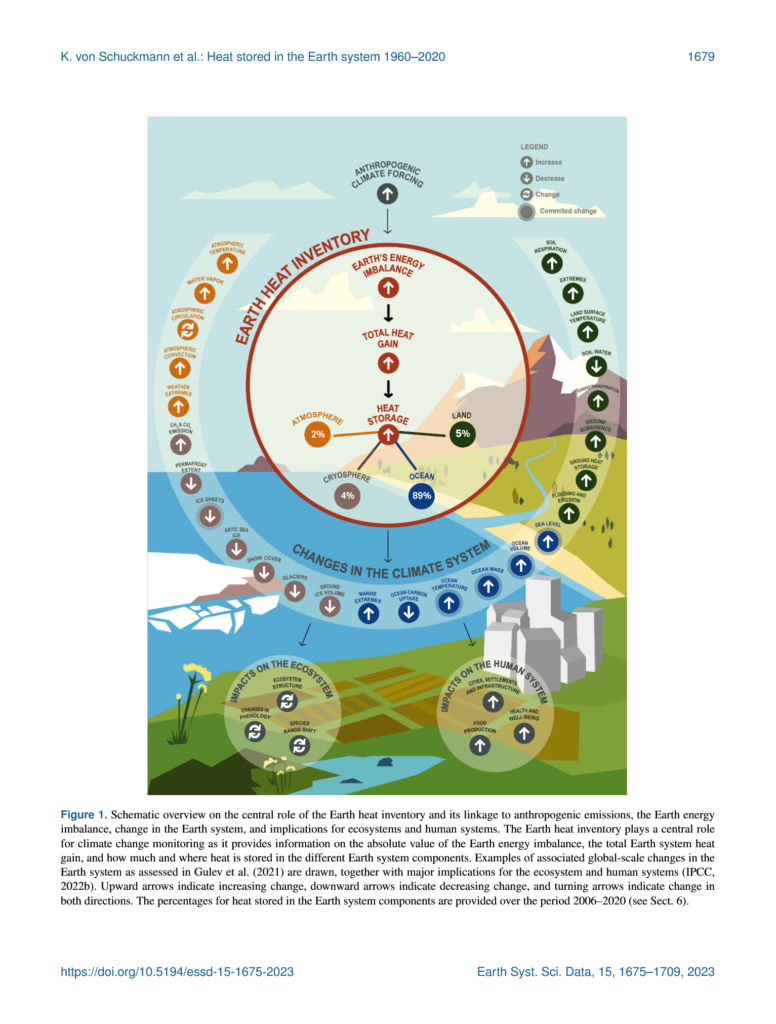
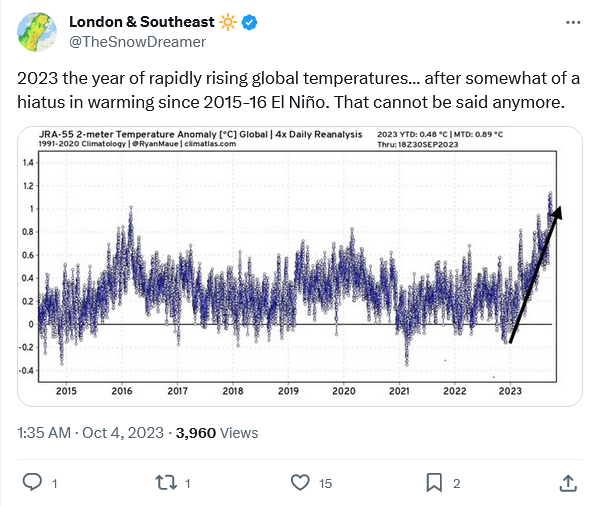
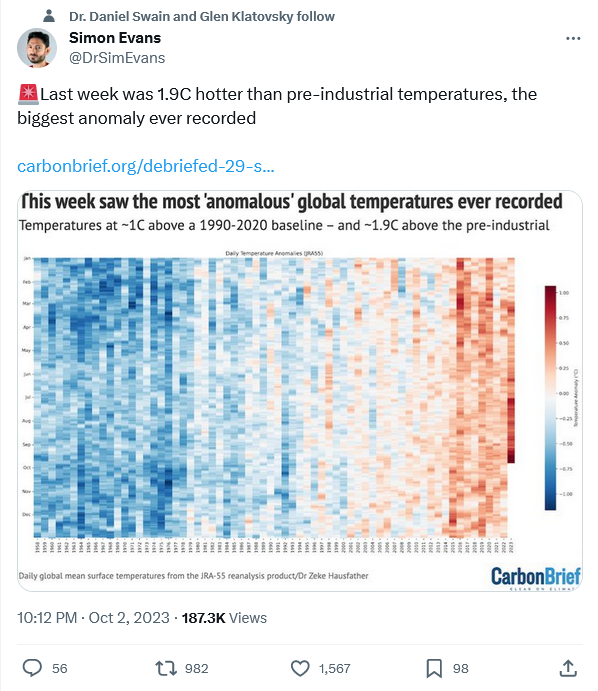
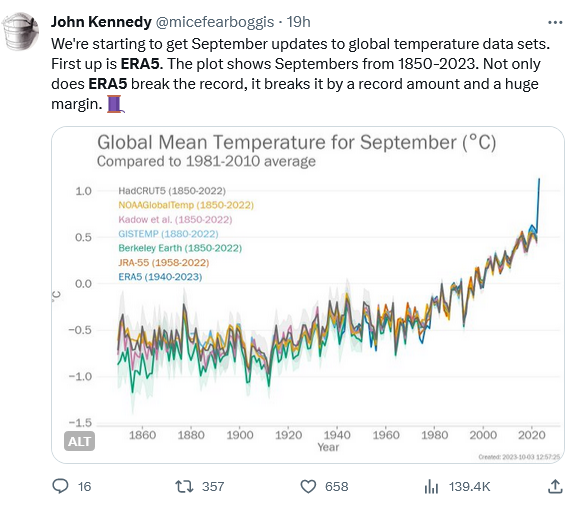
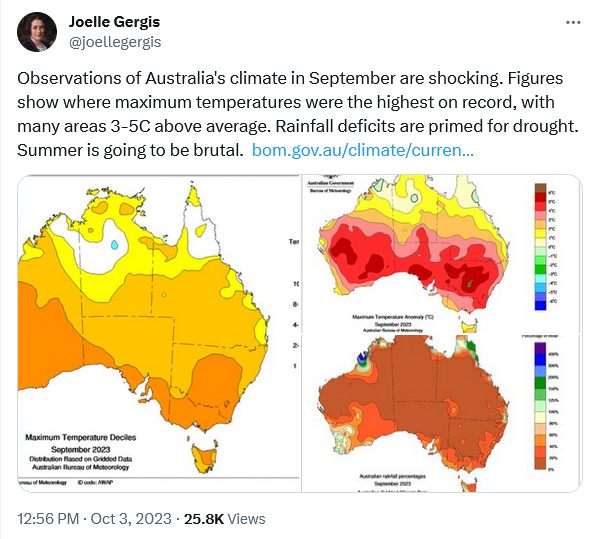
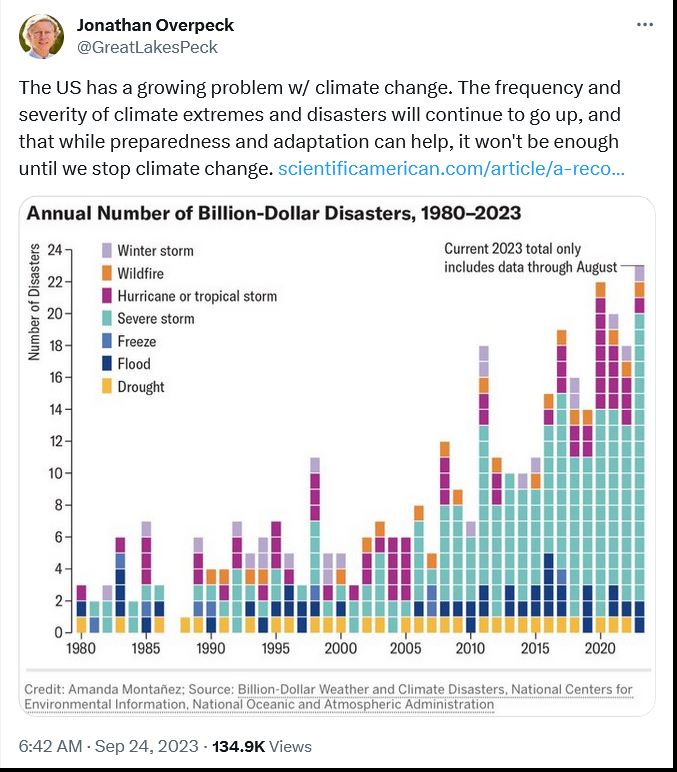

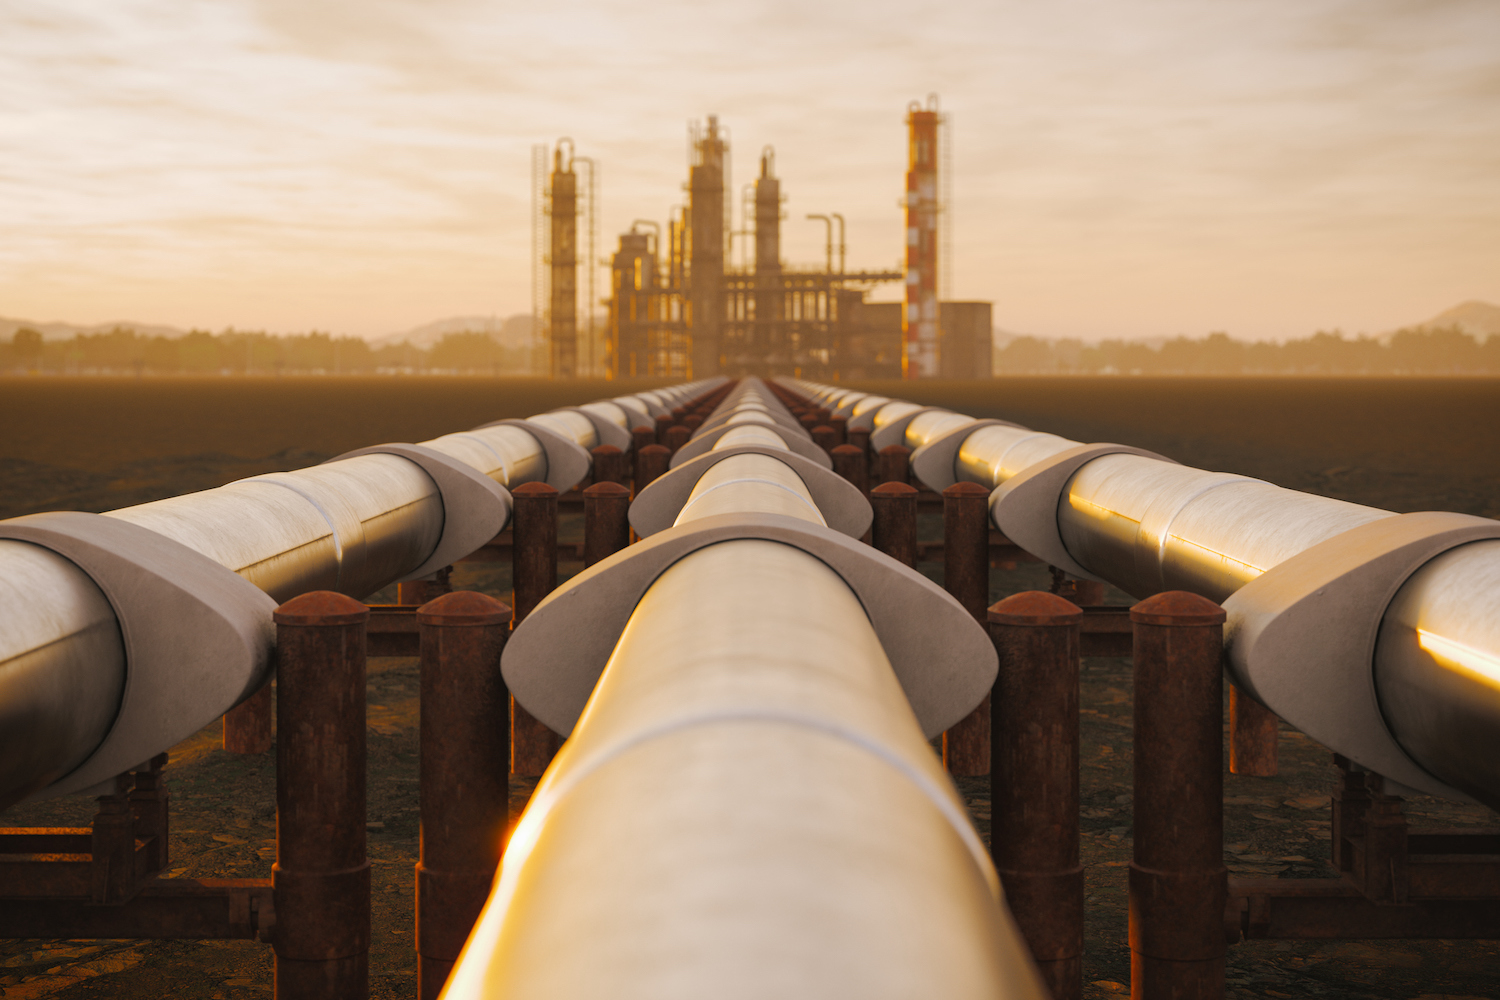
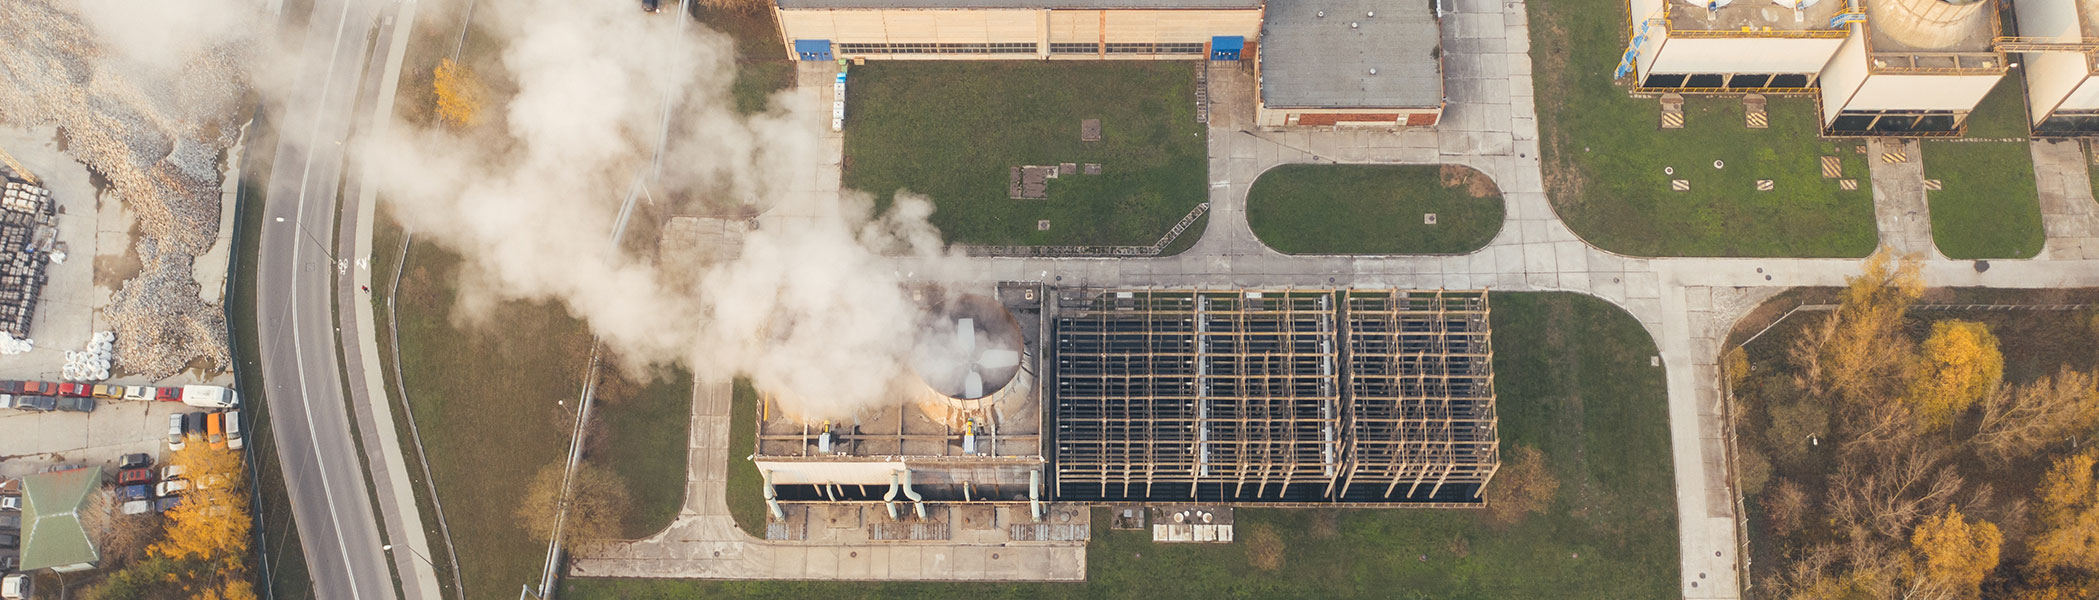
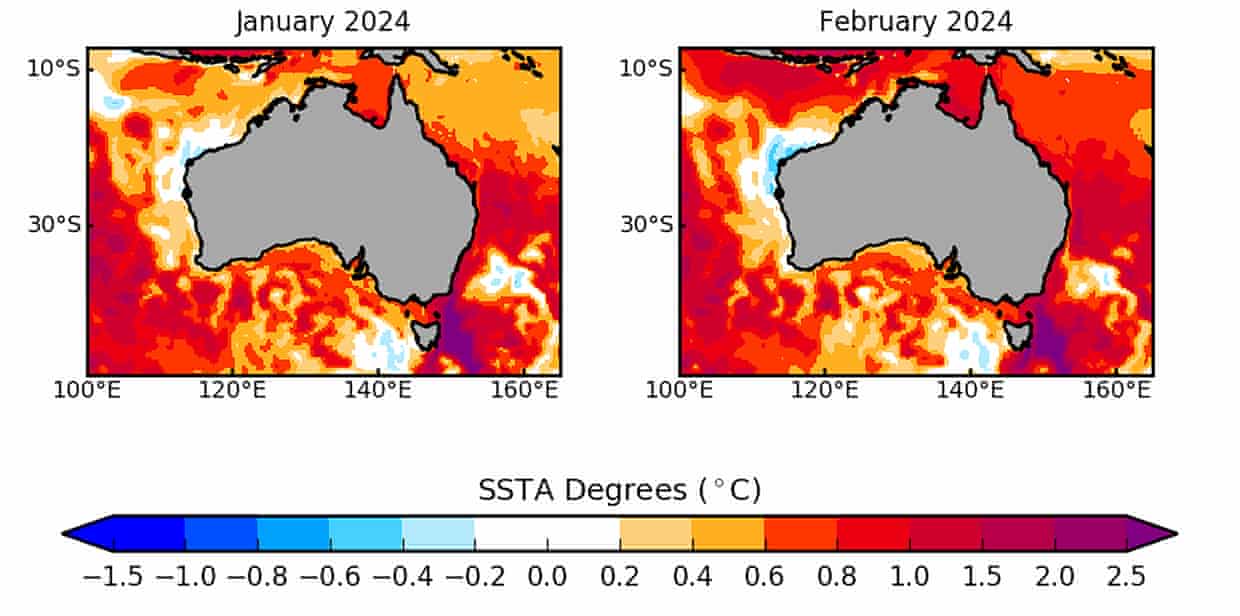

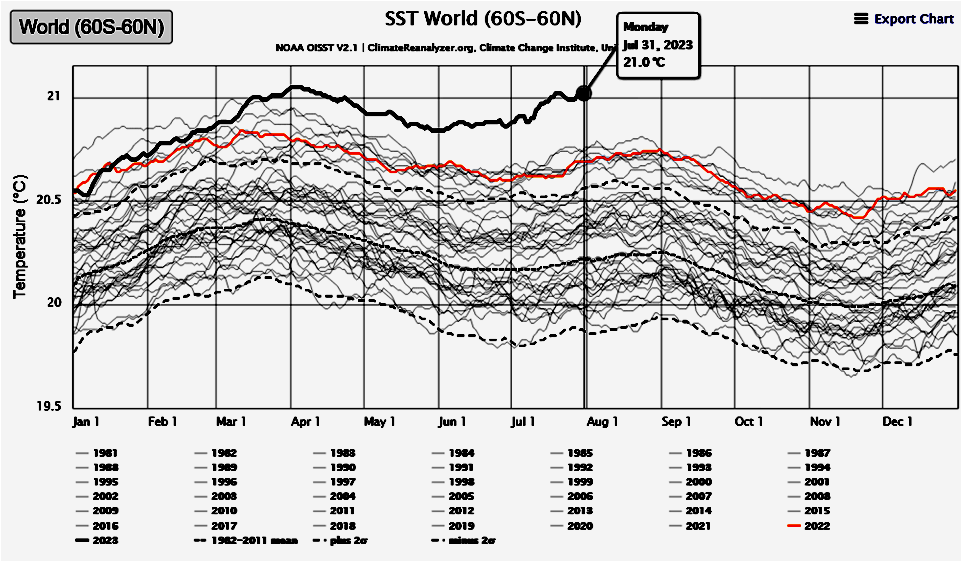
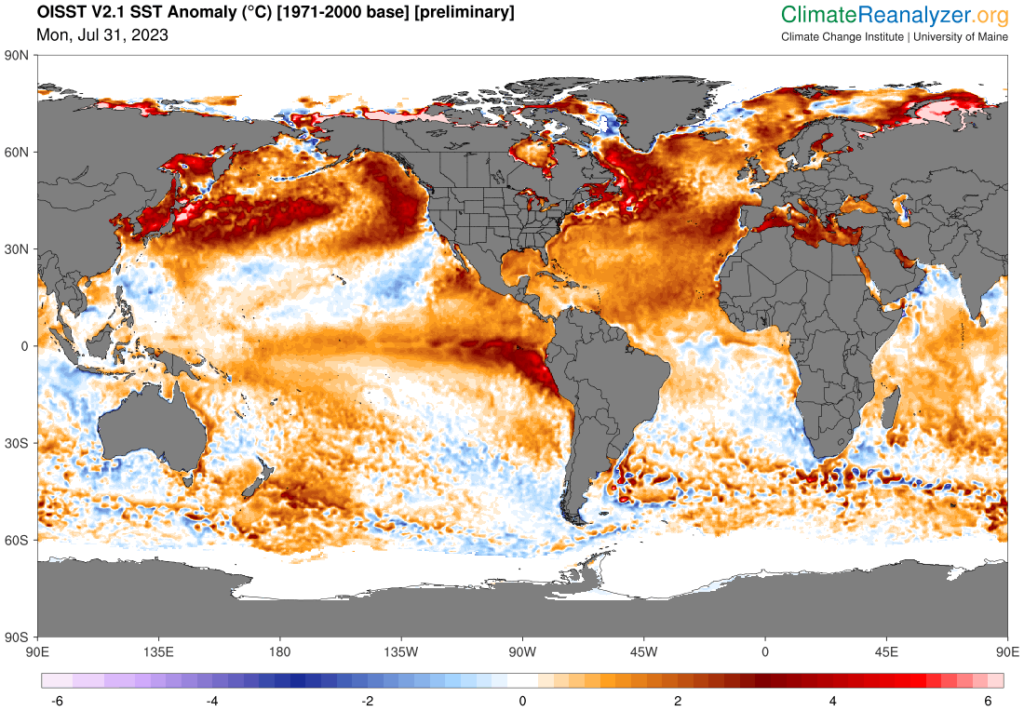
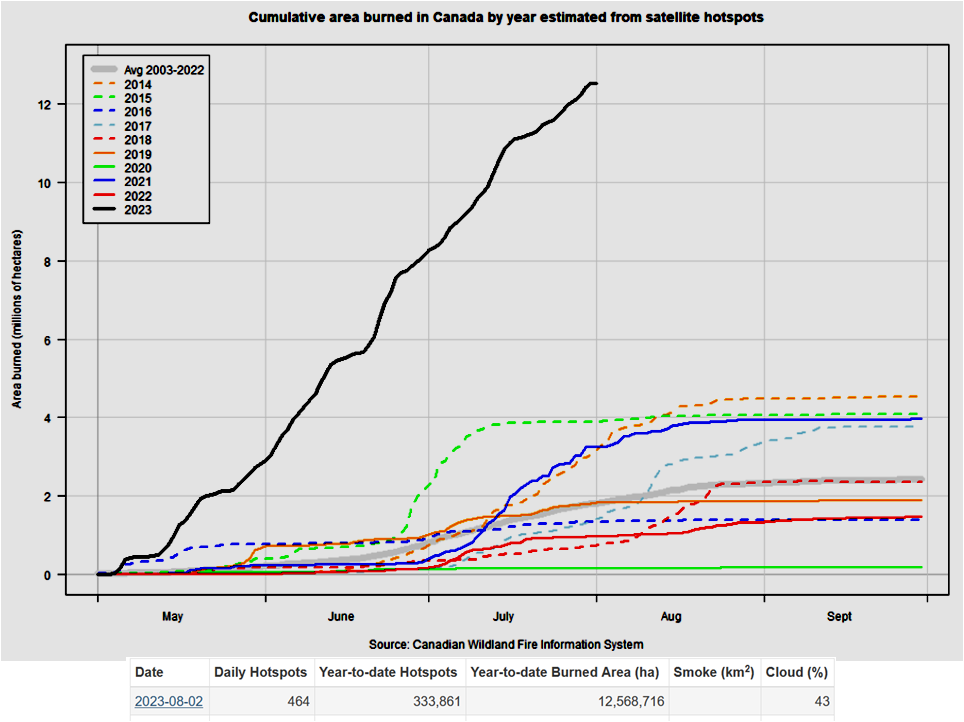
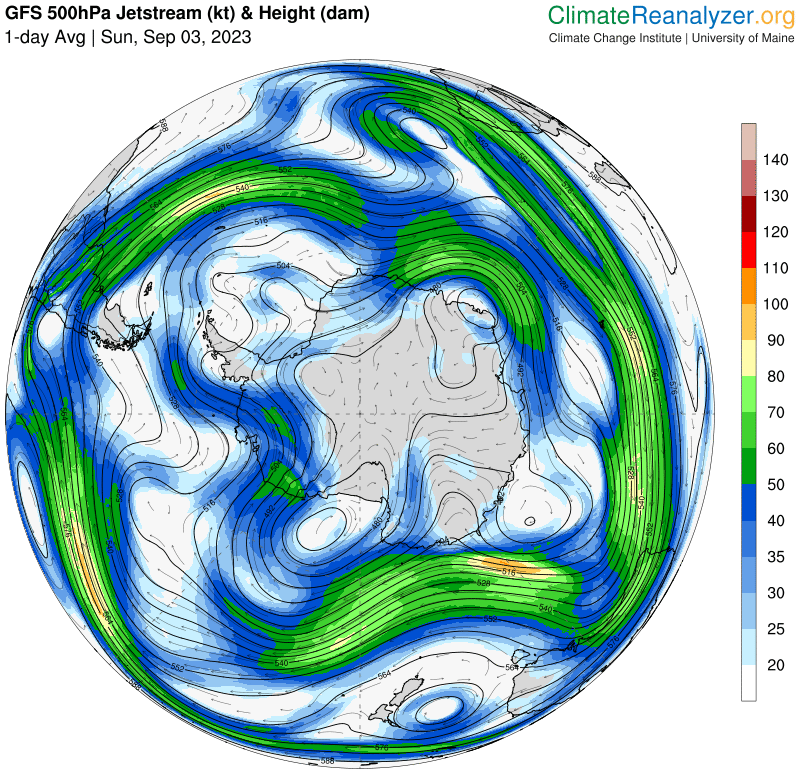
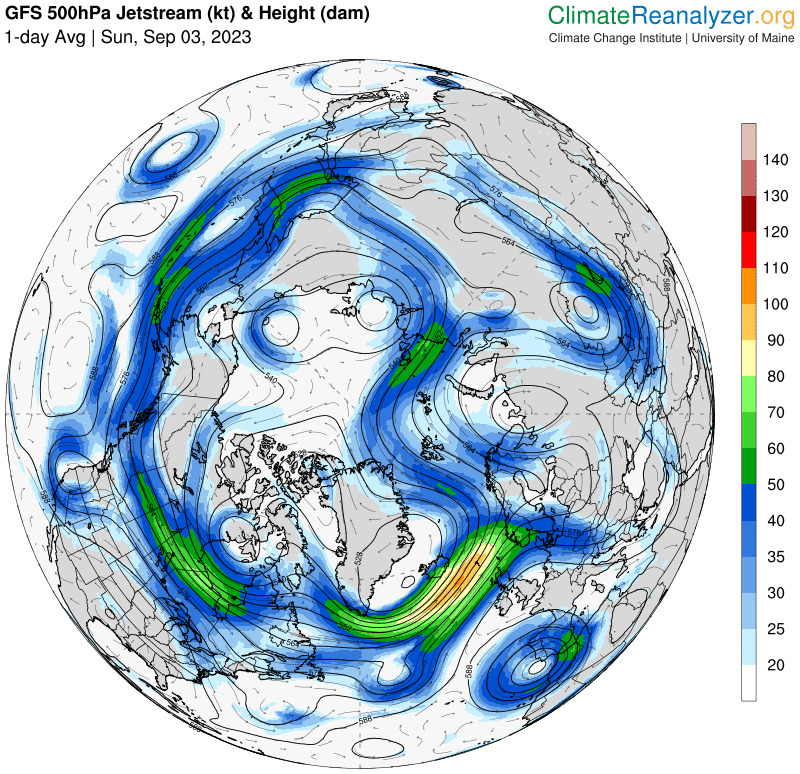
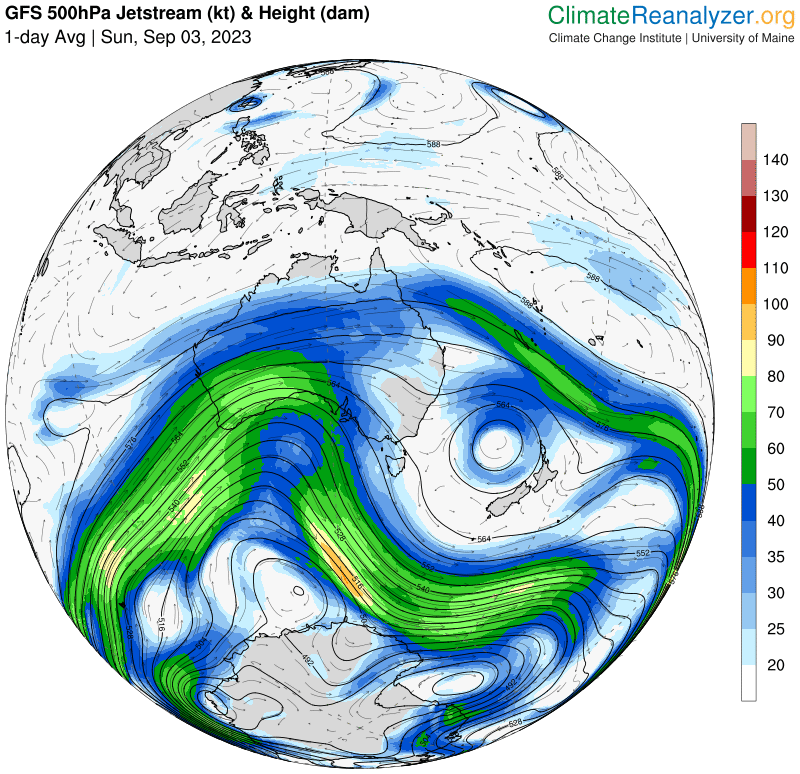
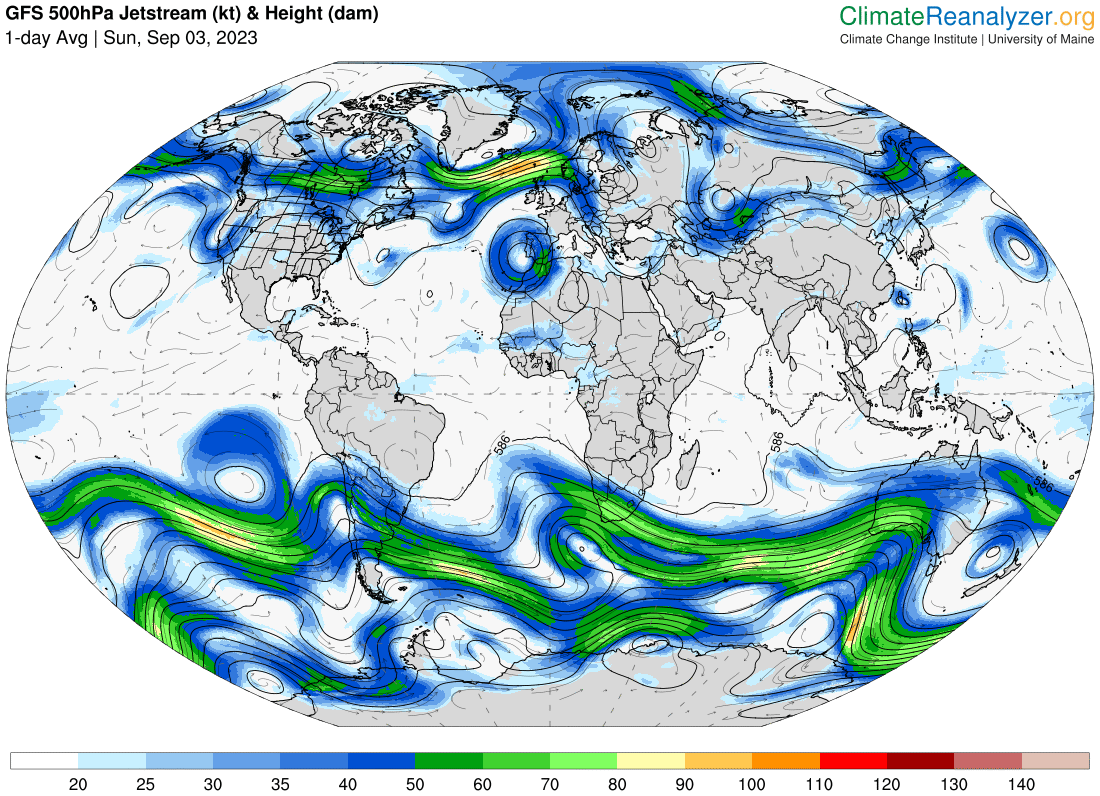
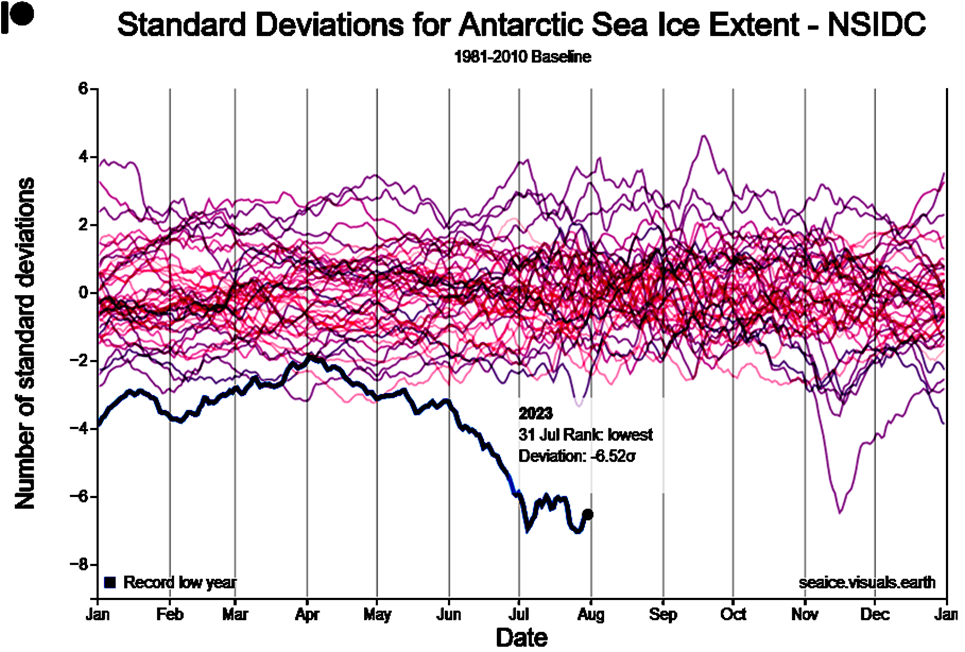

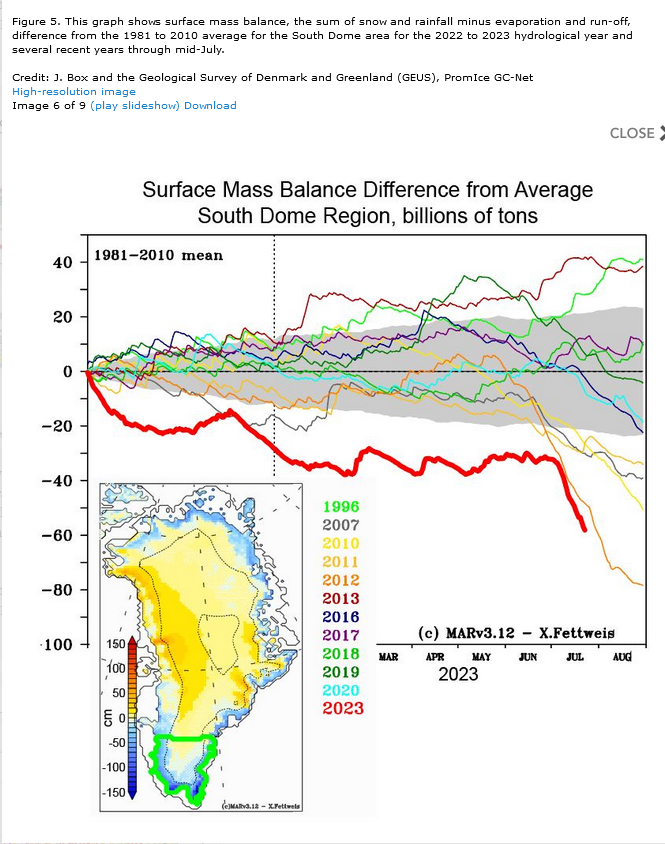
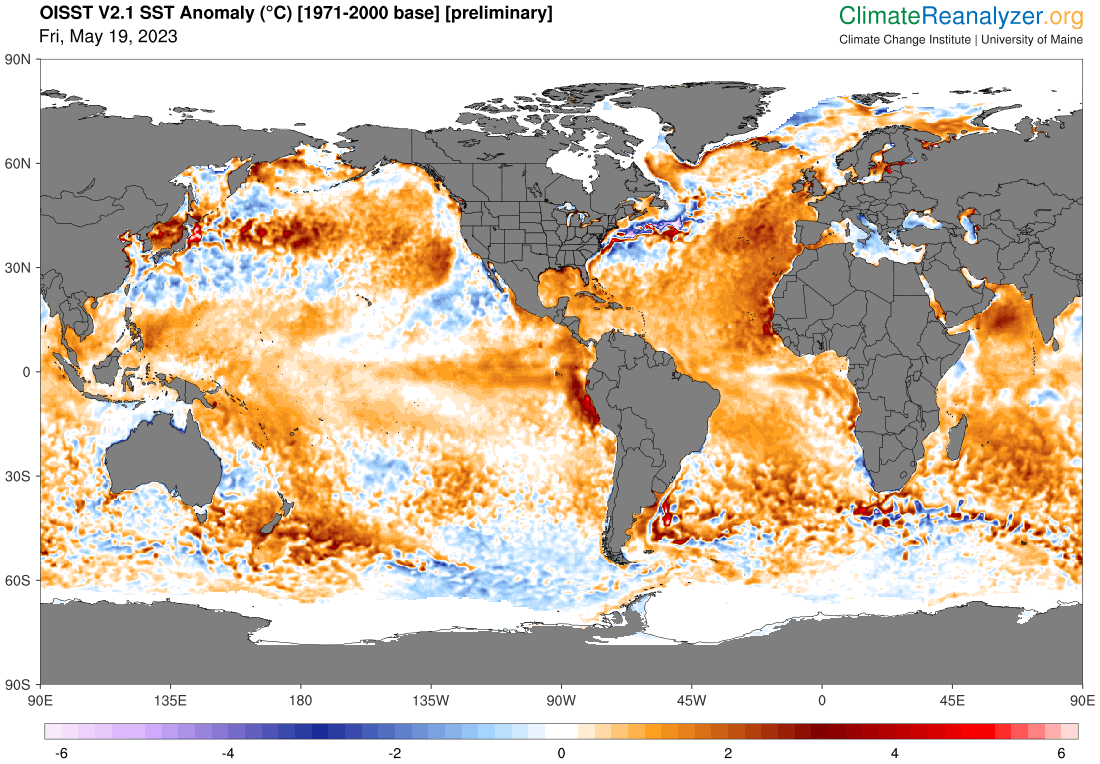
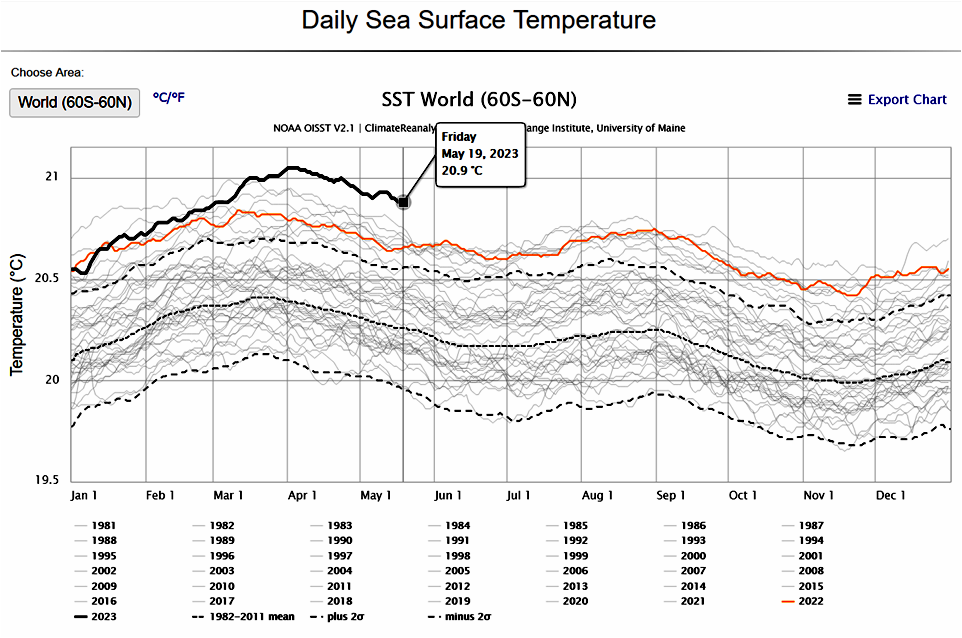
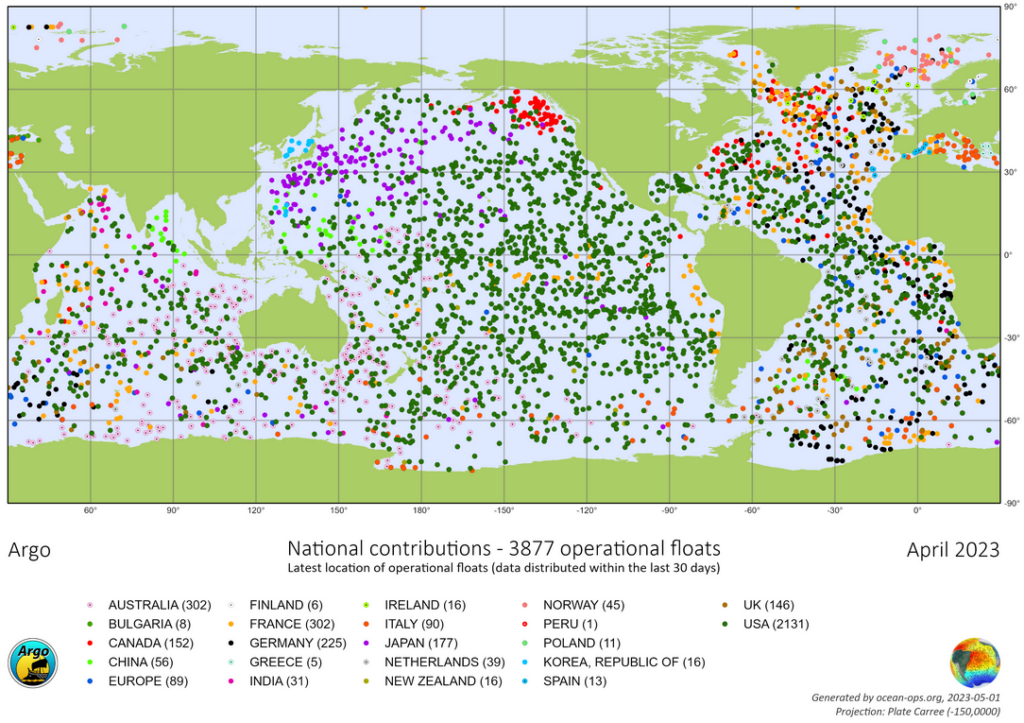
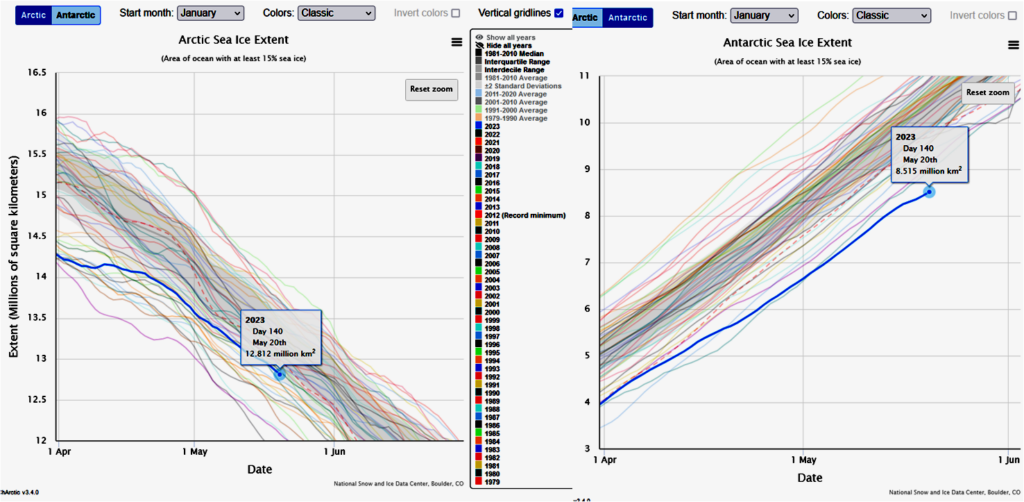
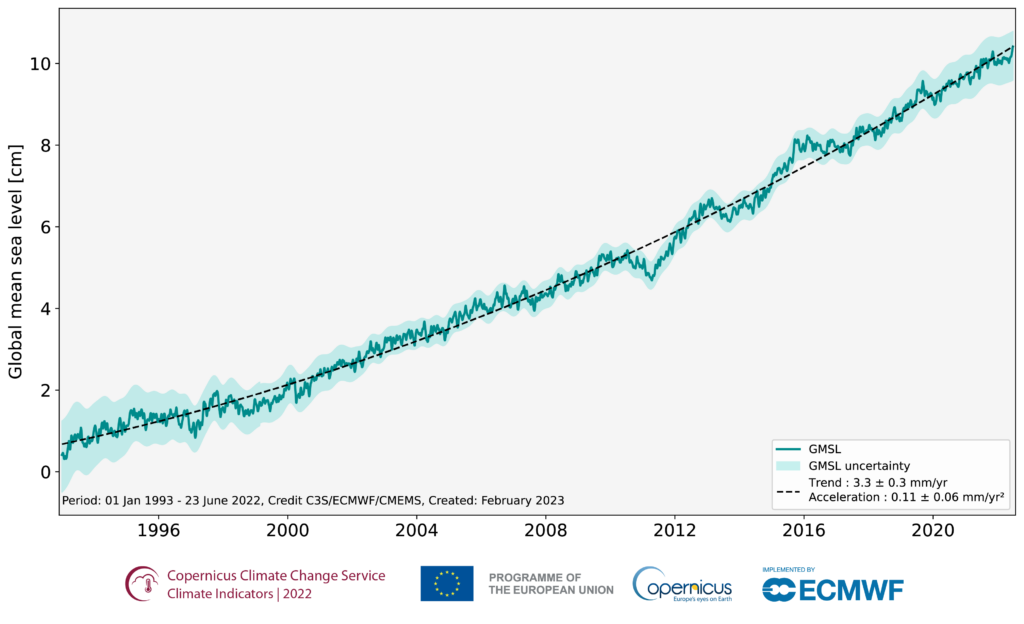
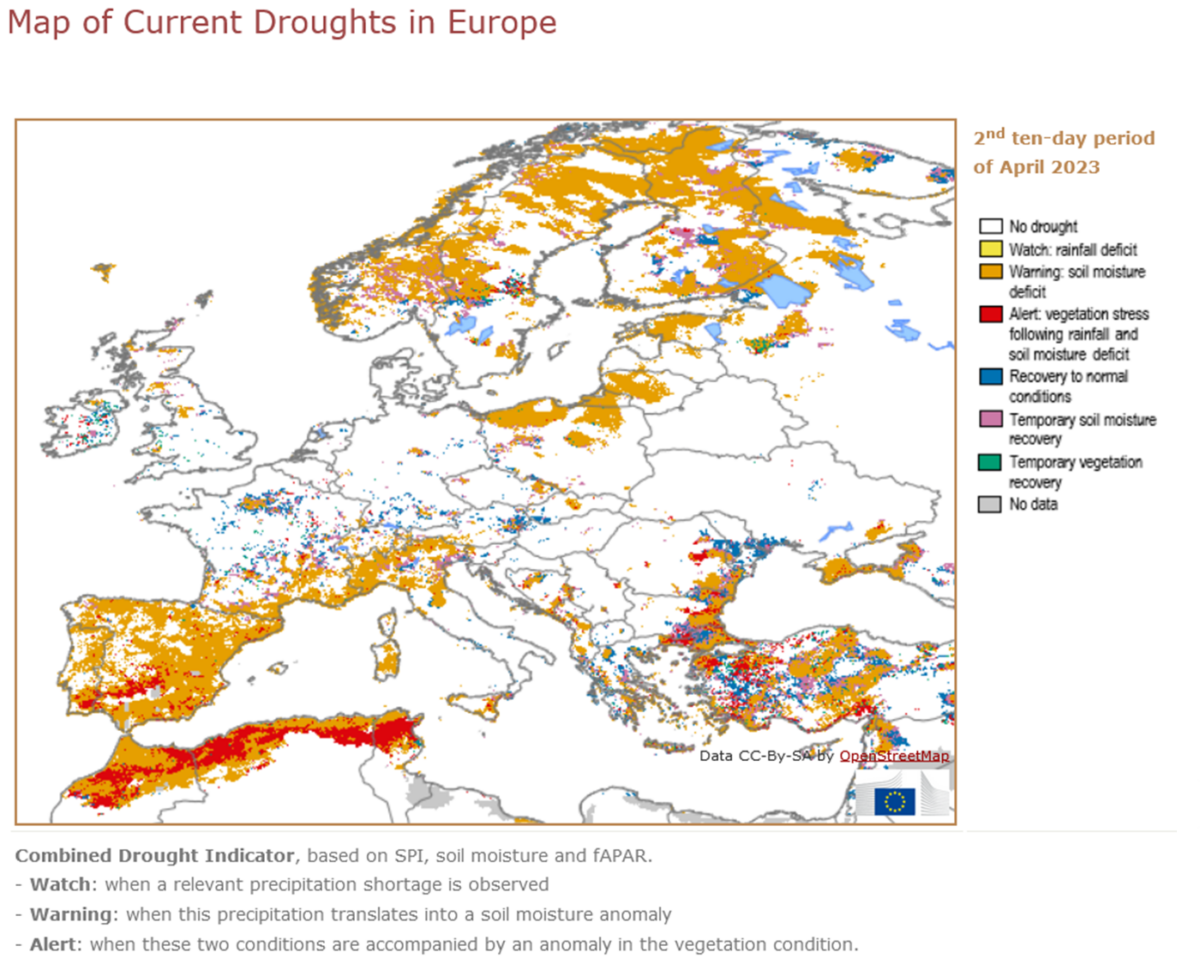
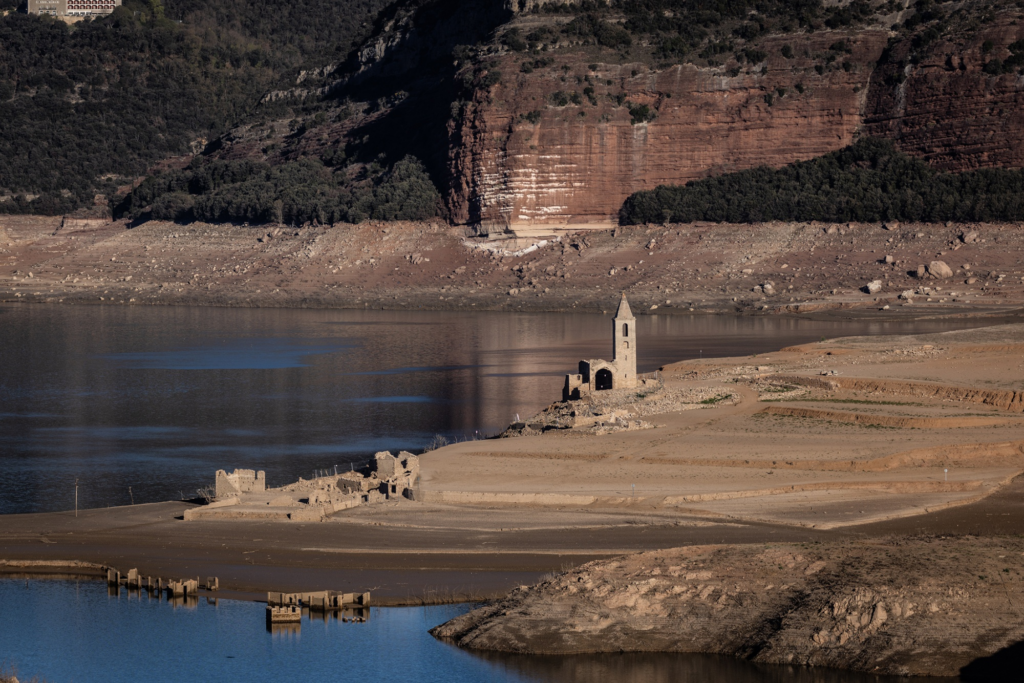
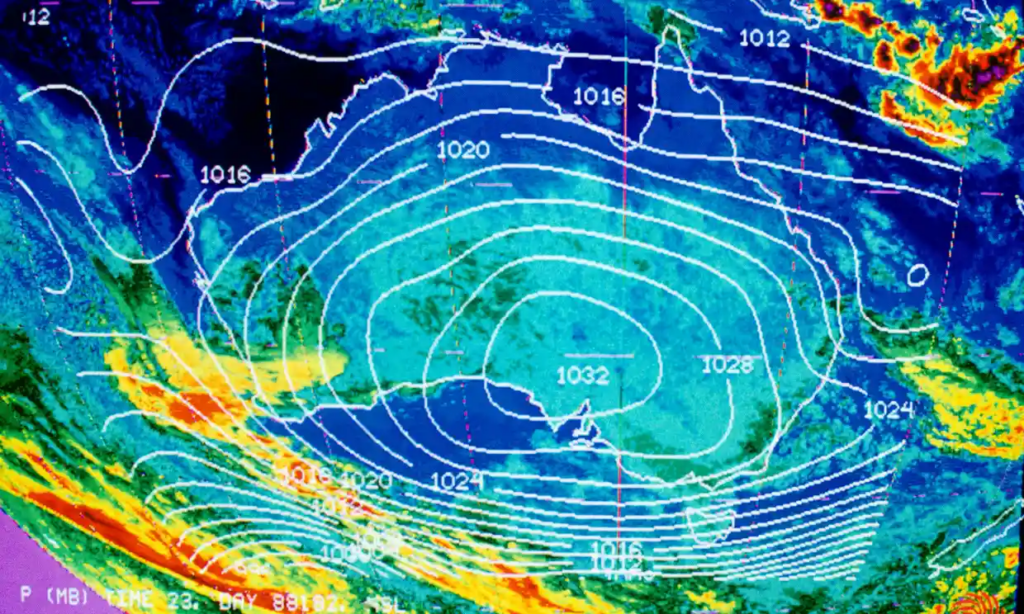
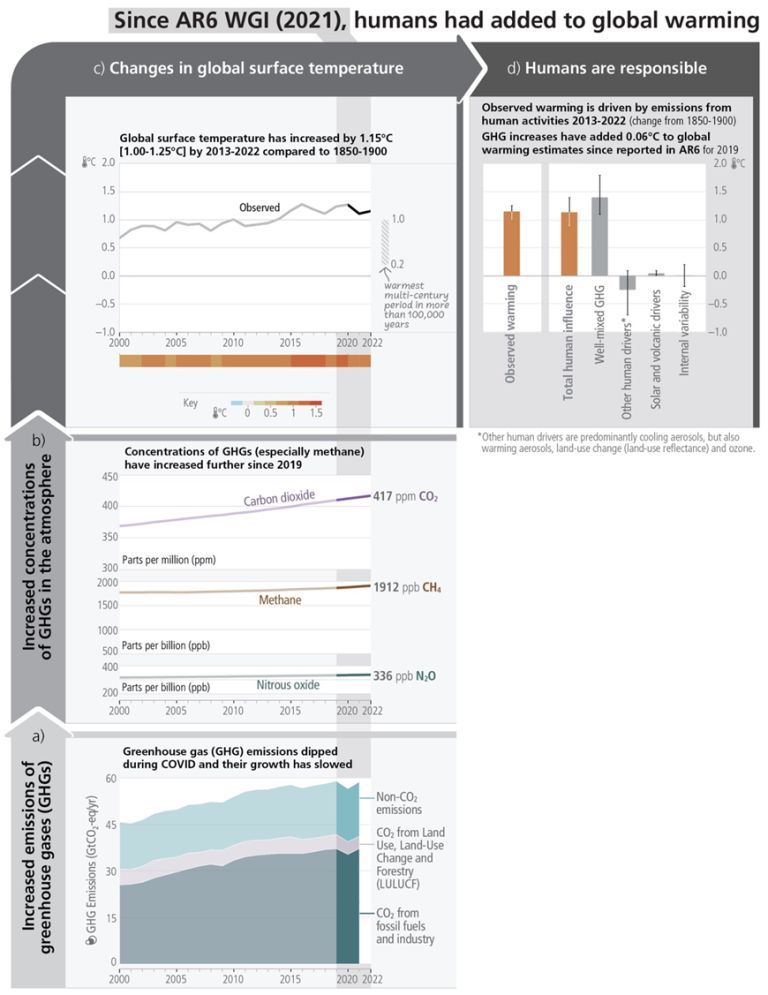
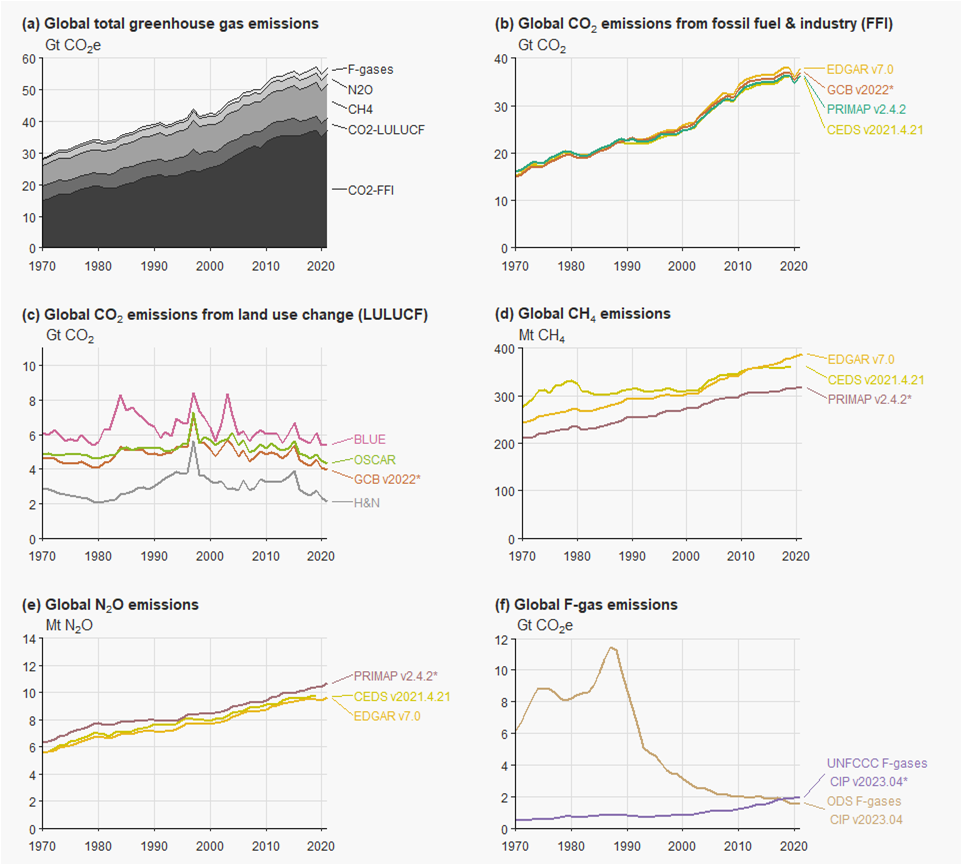
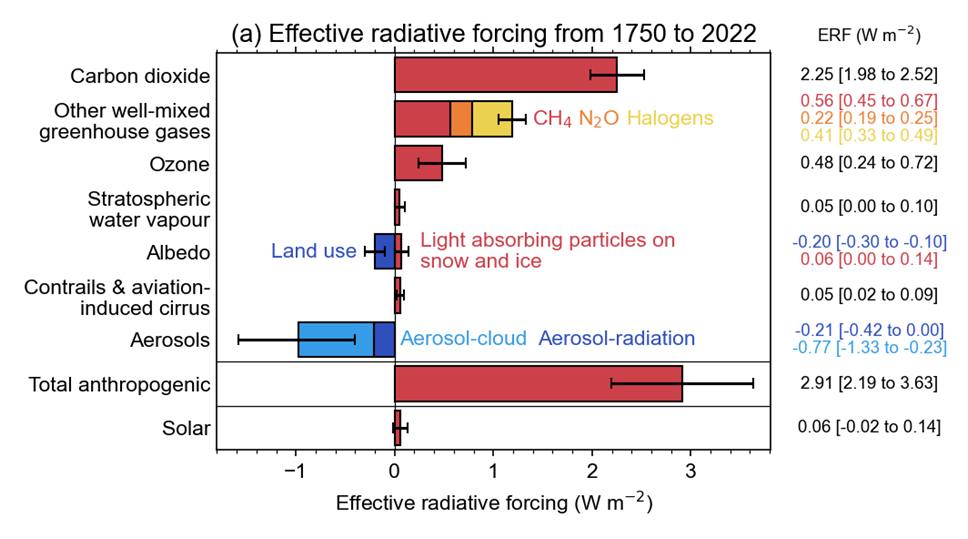
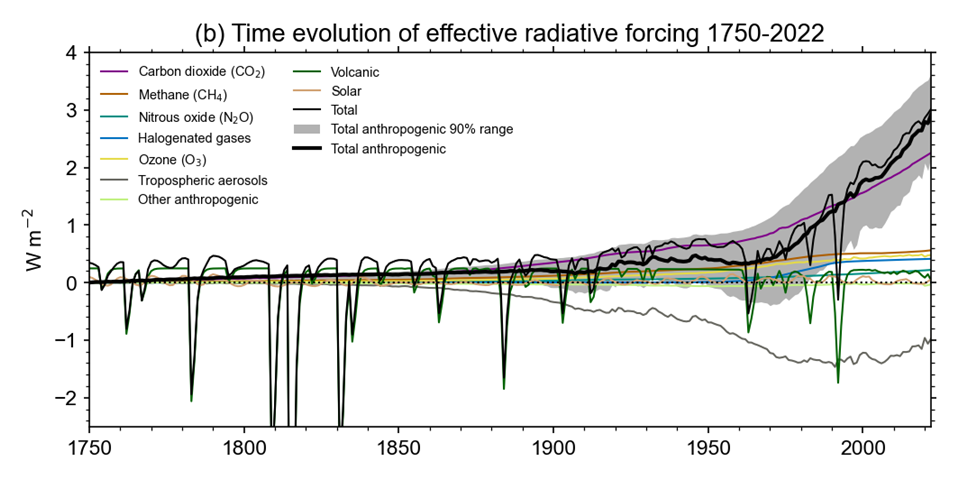
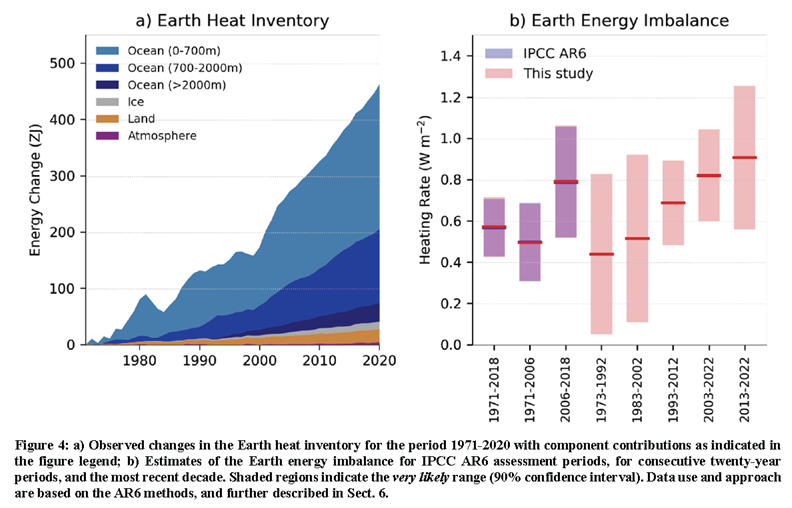


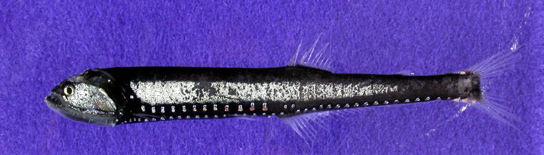
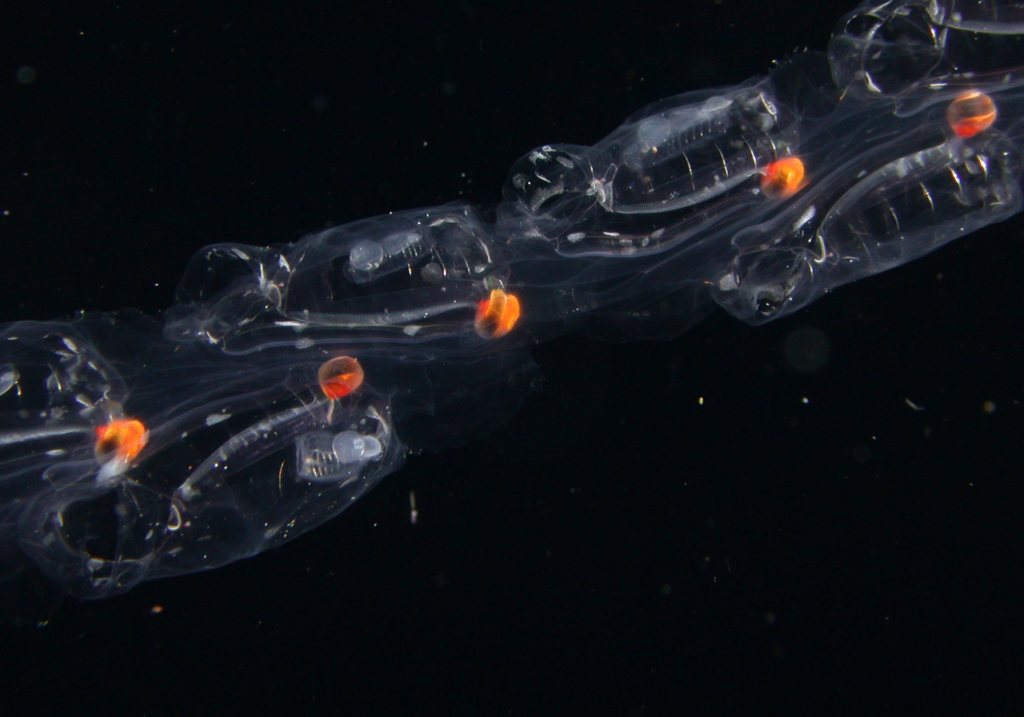


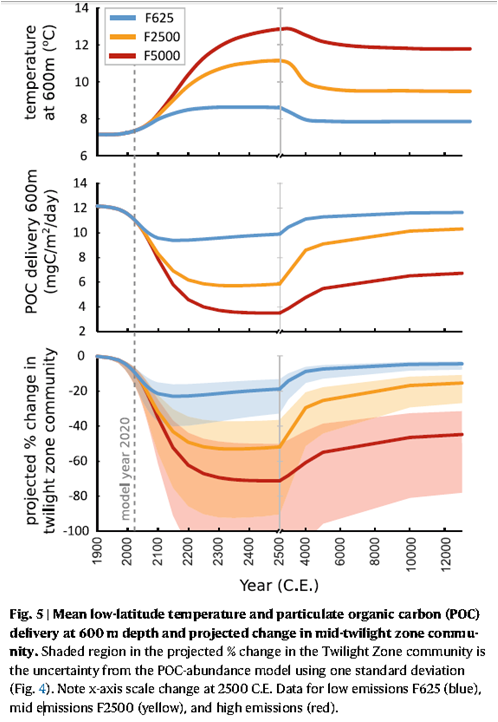
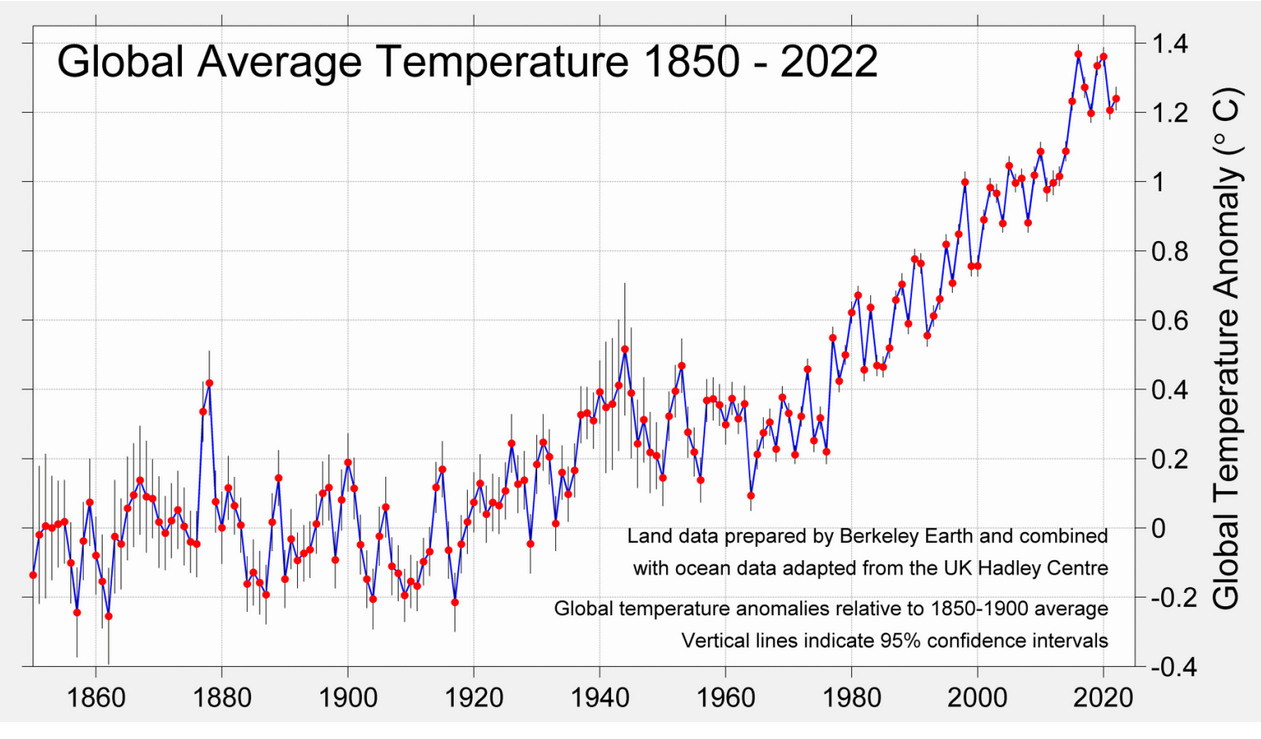