Sept. 2023 climate extremes

Notable observations and news items from the Web, with no processing and little in the way of comment. Make of them what you will.

Leading up to this September’s extremes
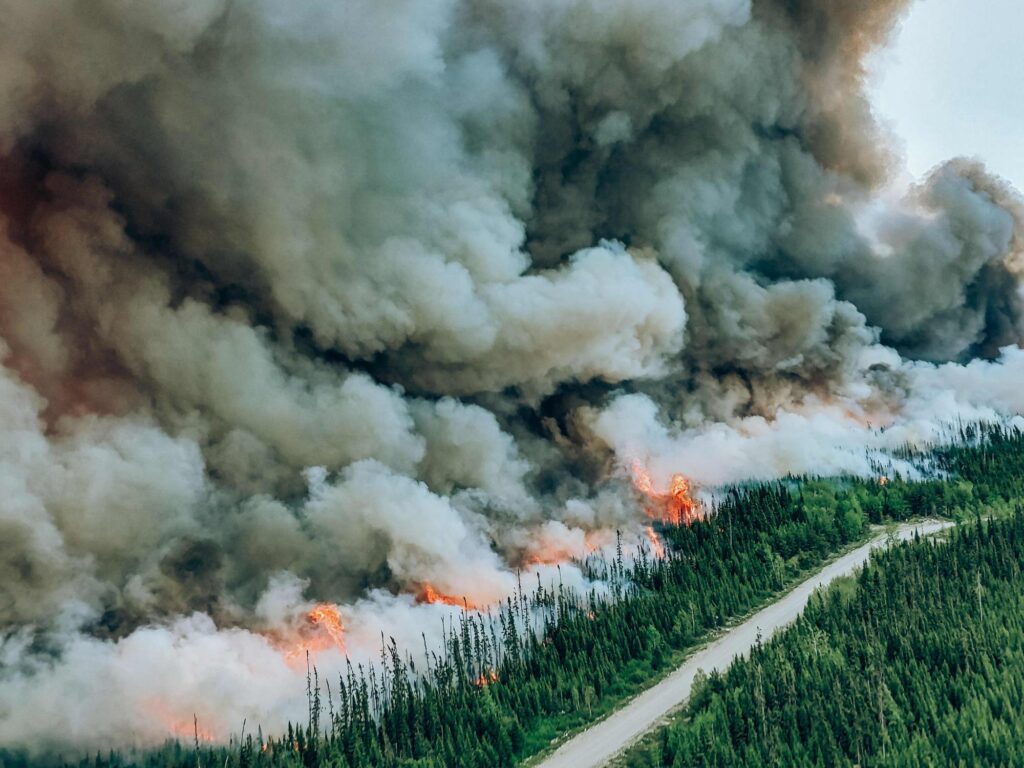
Firefighters flying over a controlled burn to fight wildfires in Canada’s Quebec Province. Photograph: Genevieve Poirier/Societe De Protection Des Forets/AFP/Getty Images (from the article)

The hottest summer in human history – a visual timeline

Jonathan Watts, Lucy Swan, Rich Cousins, Garry Blight, Harvey Symons and Paul Scruton
29/09/2023 in The Guardian

From June to August 2023, a series of extreme weather events exacerbated by climate breakdown caused death and destruction across the globe.

As the world sweltered through the hottest three month spell in human history this summer, extreme weather disasters took more than 18,000 lives, drove at least 150,000 people from their homes, affected hundreds of millions of others and caused billions of dollars of damage.

That is a conservative tally from the most widely covered disasters between early June and early September, which have been compiled in the timeline below as a reminder of how tough this period has been and what might lie ahead.

For details and the complete timeline, read the complete article….
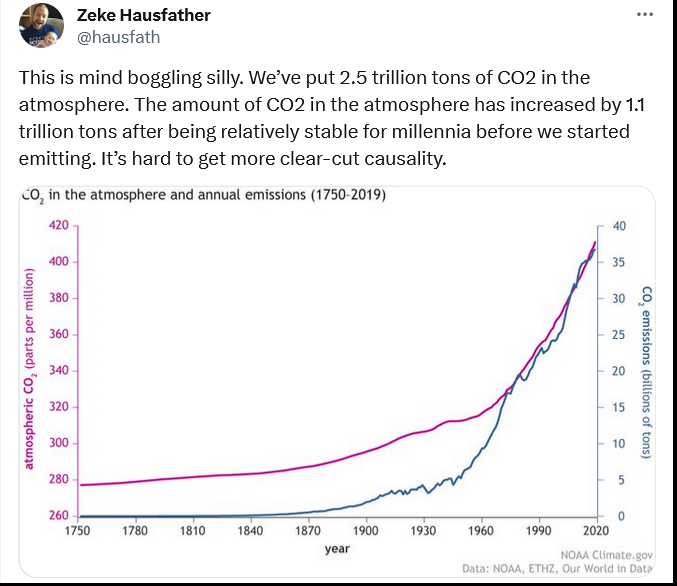
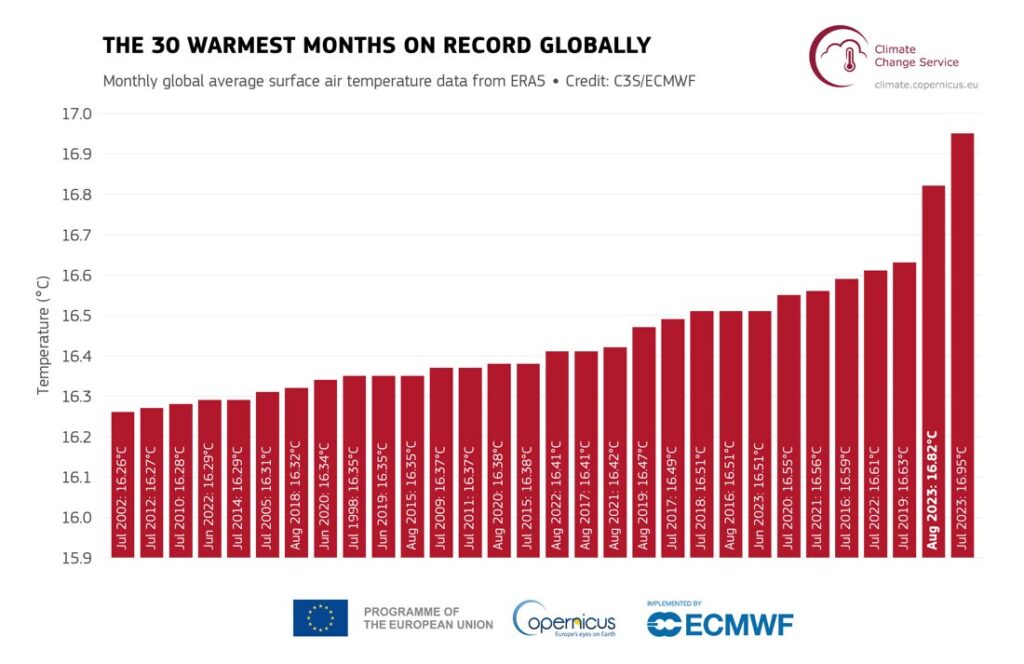
July 2023 @ 16.95 °C – hottest ever, by far; August 2023 @ 16.82 °C – second hottest ever! New regime stuff!
https://www.theguardian.com/australia-news/datablog/2023/sep/22/eastern-australia-sweltered-under-heatwaves-this-week-how-unusual-were-they
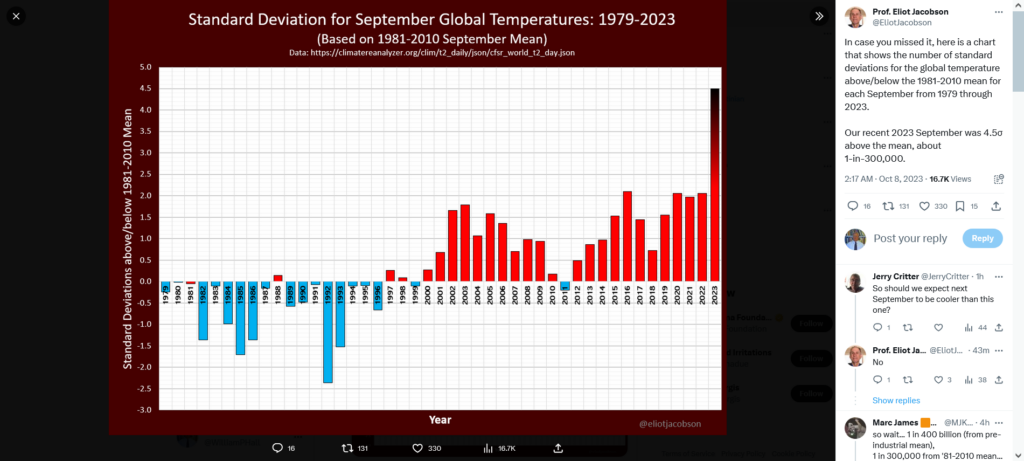
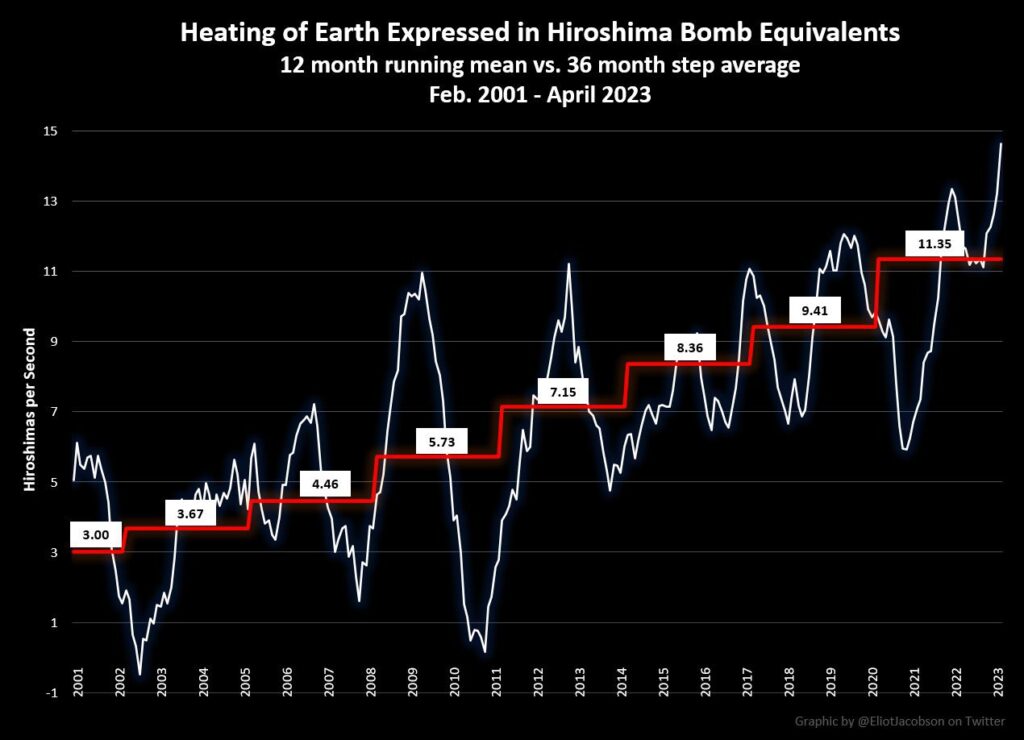
https://twitter.com/EliotJacobson/status/1710675755452203079/photo/1

https://grist.org/extreme-heat/parts-of-the-world-have-already-grown-too-hot-for-human-survival/

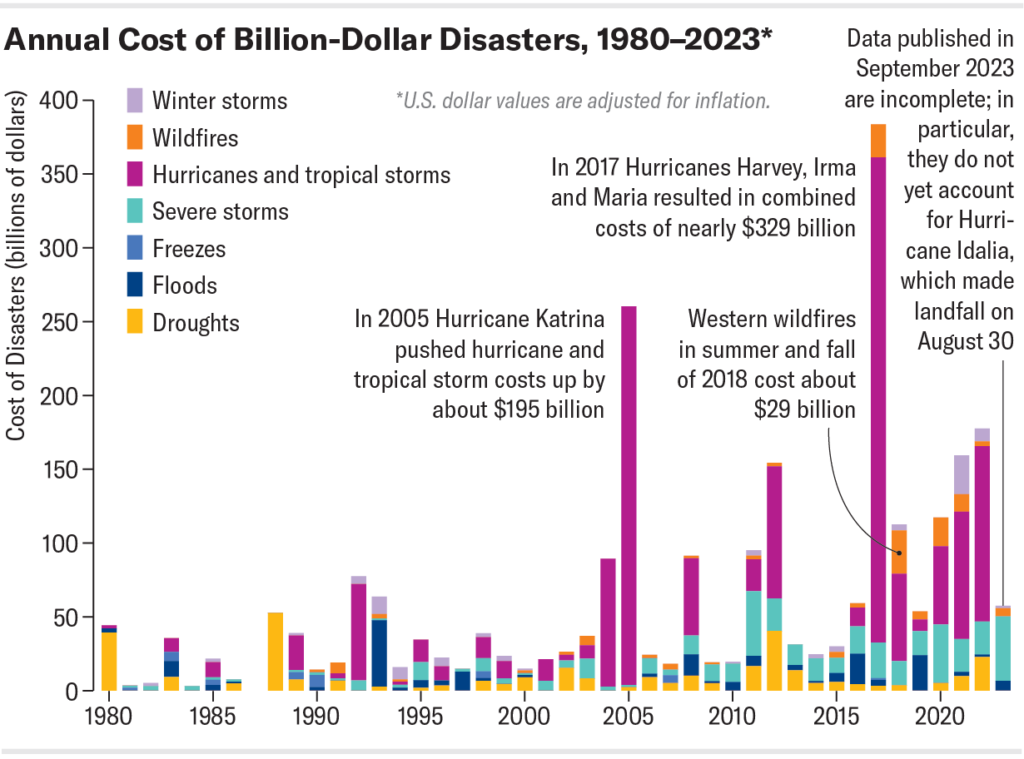
How much are these extremes costing society. For an idea see the following graphic from Scientific American’s blog. Note: this graphic applies only to the US,
https://johnmenadue.com/environment-andrew-forrests-climate-message-to-biden-modi-and-xi/?fbclid=IwAR3u7tZWL_lLo4nFCfZeyumTlEnJEgCfRMGLXBEUsRcxWoaAvPQ3abeBNew
Click the thumbnail immediately below for a parsed transcript of this critically important speech.

https://www.theage.com.au/environment/climate-change/plibersek-accused-of-failing-to-protect-environment-as-case-against-her-coal-decisions-begins-20230918-p5e5g0.html

https://www.theguardian.com/environment/2023/aug/28/crazy-off-the-charts-records-has-humanity-finally-broken-the-climate Warning: Data is provided for this article by climate scientists who suffer from the reticence causing academic and institutional scientists to downplay any overly ‘dramatic’ warnings in order to avoid alarming departmental colleagues, administrators, or governments influencing hiring, promotion, financial support for research, etc. Google “scientific reticence” and you will find lots of evidence on how it works.

https://www.theguardian.com/world/2023/sep/13/antartica-global-warming-sea-ice-caps-regime-shift

Pine Island Glacier

There is far worse to come as warming continues to increase https://www.theguardian.com/environment/2023/sep/19/global-heating-made-mediterranean-floods-more-likely-study-says

Implications

The current extremely low sea ice will have a range of impacts. Changed ocean stratification and circulation will alter basal melting beneath ice shelves48. Greater coastal exposure will increase coastal erosion and reduce ice-shelf stability49. Changes in dense shelf water production will alter bottom water formation and deep ocean ventilation50. Sea ice changes will also have contrasting influences on Adélie and emperor penguin colonies51,52, and substantially alter human activities along the Antarctic coastline.

Anthropogenic greenhouse gas emissions have been attributed as the primary cause of Southern Ocean warming, and here we suggest a potential link to a regime shift in Antarctic sea ice. While for many years, Antarctic sea ice increased despite increasing global temperatures6, it appears that we may now be seeing the inevitable decline, long projected by climate models53. The far-reaching implications of Antarctic sea ice loss highlight the urgent need to reduce greenhouse gas emissions.

https://apnews.com/article/climate-change-poll-opinions-attitudes-extreme-weather-993c392ee57d023ca55600431a39a4be?fbclid=IwAR0u3oxtLL1R5hY0h_64cZA6MZDvGeEZNHUW66oghhmJgUPjo0je3_NyoWY

https://bc.ctvnews.ca/b-c-s-wildfire-crisis-was-forecast-but-it-arrived-decades-sooner-than-expected-1.6555309

https://www.livenowfox.com/news/canadas-supercharged-wildfire-forecast-could-mean-bad-air-quality-in-us-through-fall

Off the previous chart, again…. In 12 days another ~500,000 hectares have burned! Will the burning stop for winter? What does this portend for Australia’s upcoming El Nino summer?

Cumulative total land area burned to date

2023-09-25 17,850,290
2023-09-24 n.a.
2023-09-23 17,812,661
2023-09-22 17,100,899
2023-09-21 17,012,456

The record for the 23rd blew the Canadian system’s off the chart! The following chart from Copernicus, the EU’s equivalent of NASA, that operates the satellites, suggests the data from the 23d is probably a real record of what the satellites actually recorded. In most years the wildfires would have been more-or-less through for the year. Yet 23 Sept shows BY FAR the largest number of hotspots recorded for the year so far, previous highs being 9269 for June 22 and 9692 for July 13.
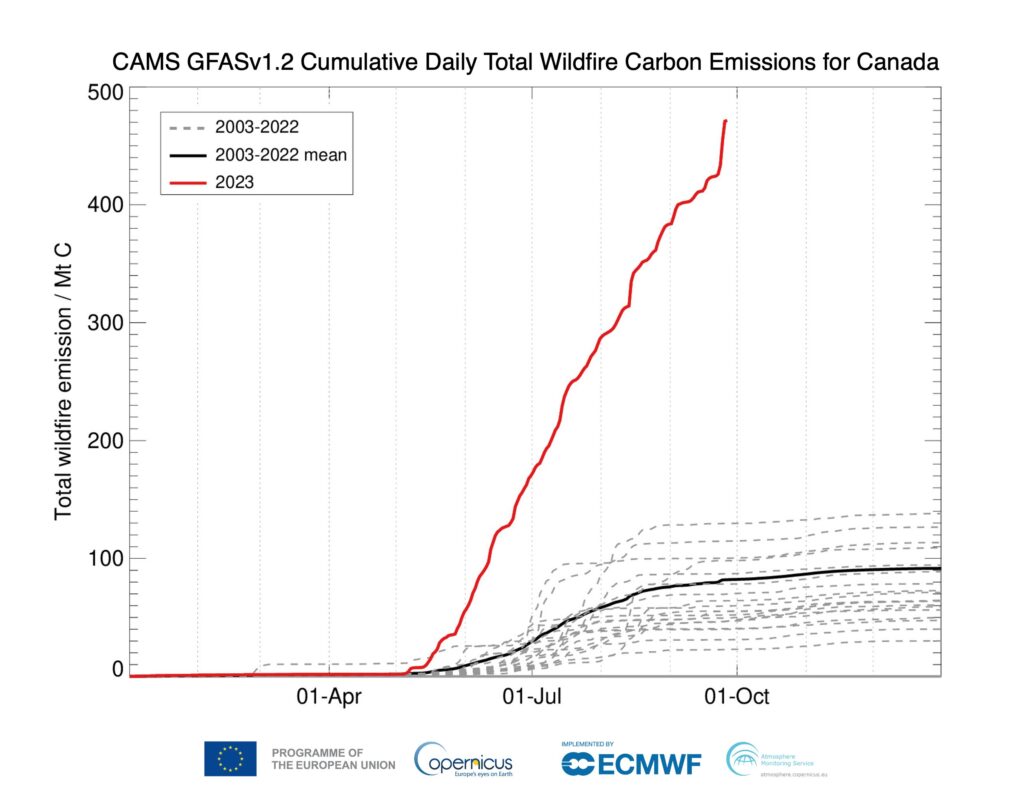
For the latest Natural Resources Canada tabulation, see https://cwfis.cfs.nrcan.gc.ca/maps/fm3?type=arpt. Note 1: the current version of the total burned area chart can be seen by scrolling down to the bottom of the table accessed by this link.

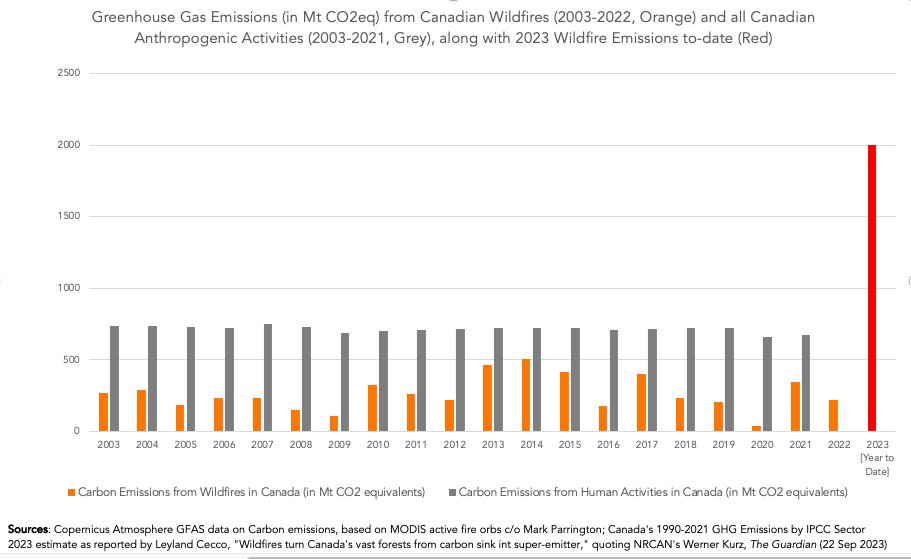
Note 2: the following Guardian chart was PUBLISHED on 22 Sept.

https://twitter.com/yboulanger2/status/1707081494815027385
Yan Boulanger, @yboulanger2 Research scientist @NRCan CFS,
climate change impacts on forest landscapes, natural disturbances, wildlife habitat.

https://www.theguardian.com/world/2023/sep/22/canada-wildfires-forests-carbon-emissions – “This year’s out-of-control blazes released 2bn tonnes of CO2 – probably triple the country’s annual carbon footprint”.

Note: warmer winter temperatures allowed mountain pine beetle populations to grow explosively through this region due to additional reproduction of adult beetles that were normally killed off by hard freezing winters. I did several Facebook posts in 2016 and 2018 on the increasing fire hazard this would create until the dead biomass was removed. This year’s extreme temperatures facilitated this!

See Hall (2020) Portents for the Future – 2020 Wildfires on the Siberian Permafrost.

Permafrost zones on brink of runaway GHG emissions(?)

Global permafrost now (2000-2020) likely to be a net emitter of greenhouse gases methane and N₂O – Ramage, et al. (September 11, 2023 unreviewed preprint) The net GHG balance and budget of the permafrost region (2000-2020) from ecosystem flux upscaling.

[Note that 2020- Siberian wildfires plus this years’ wildfires in the Canadian Arctic Zone probably produced massive increases in permafrost GHG emissions beyond what was happening during the years included in this survey.]

Map of northern permafrost extent (data from Obu et al. 2021) overlain with the spatial extent of the permafrost domain included (BAWLD-RECCAP2 regions). The spatial extent of the permafrost region de ned in this study as an overlap of permafrost extent and the Boreal Arctic Wetlands and Lakes Dataset (BAWLD, Olefeldt et al. 2021a,b
Scheme of annual atmospheric GHGs exchange (CO2, CH4, and N2O) for the ve terrestrial land cover classes (Boreal Forests, Non-permafrost Wetlands, Dry Tundra, Tundra Wetlands and Permafrost Bogs); inland water classes (Rivers and Lakes). Annual lateral
fluxes from coastal erosion and riverine fluxes are also reported in Tg C yr-1 and Tg N yr-1. Symbols for fluxes indicate high (x>Q3), medium (Q1<x<Q3), and low (<Q1) fluxes, in comparison the quartile (Q). Note that the magnitudes across three di erent GHG fluxes within each land cover class cannot be compared with each other.
ClimateReanalyzer
Stationary anomaly, somewhat hotter on 23rd than 22nd


https://www.theguardian.com/environment/2023/sep/11/us-record-billion-dollar-climate-disasters Note, as the frequency, extent, and ferocity of climate disasters continue to increase with accelerating global warming, newer disasters will overlap and add to destruction from previous disasters where there has not been enough time to complete repair and remediation leading to the accelerating accumulated climate damage — until society no longer has the resources to continue repairing and replacing what has already been repaired and replaced. At this point social collapse is inevitable…… We must stop and reverse the process of global warming that is causing this or face near-term extinction.

11 September 2023 – Coming out of winter — not a good look for the rest of the year in Australia!

Dwindling sea-ice reflects less solar energy away
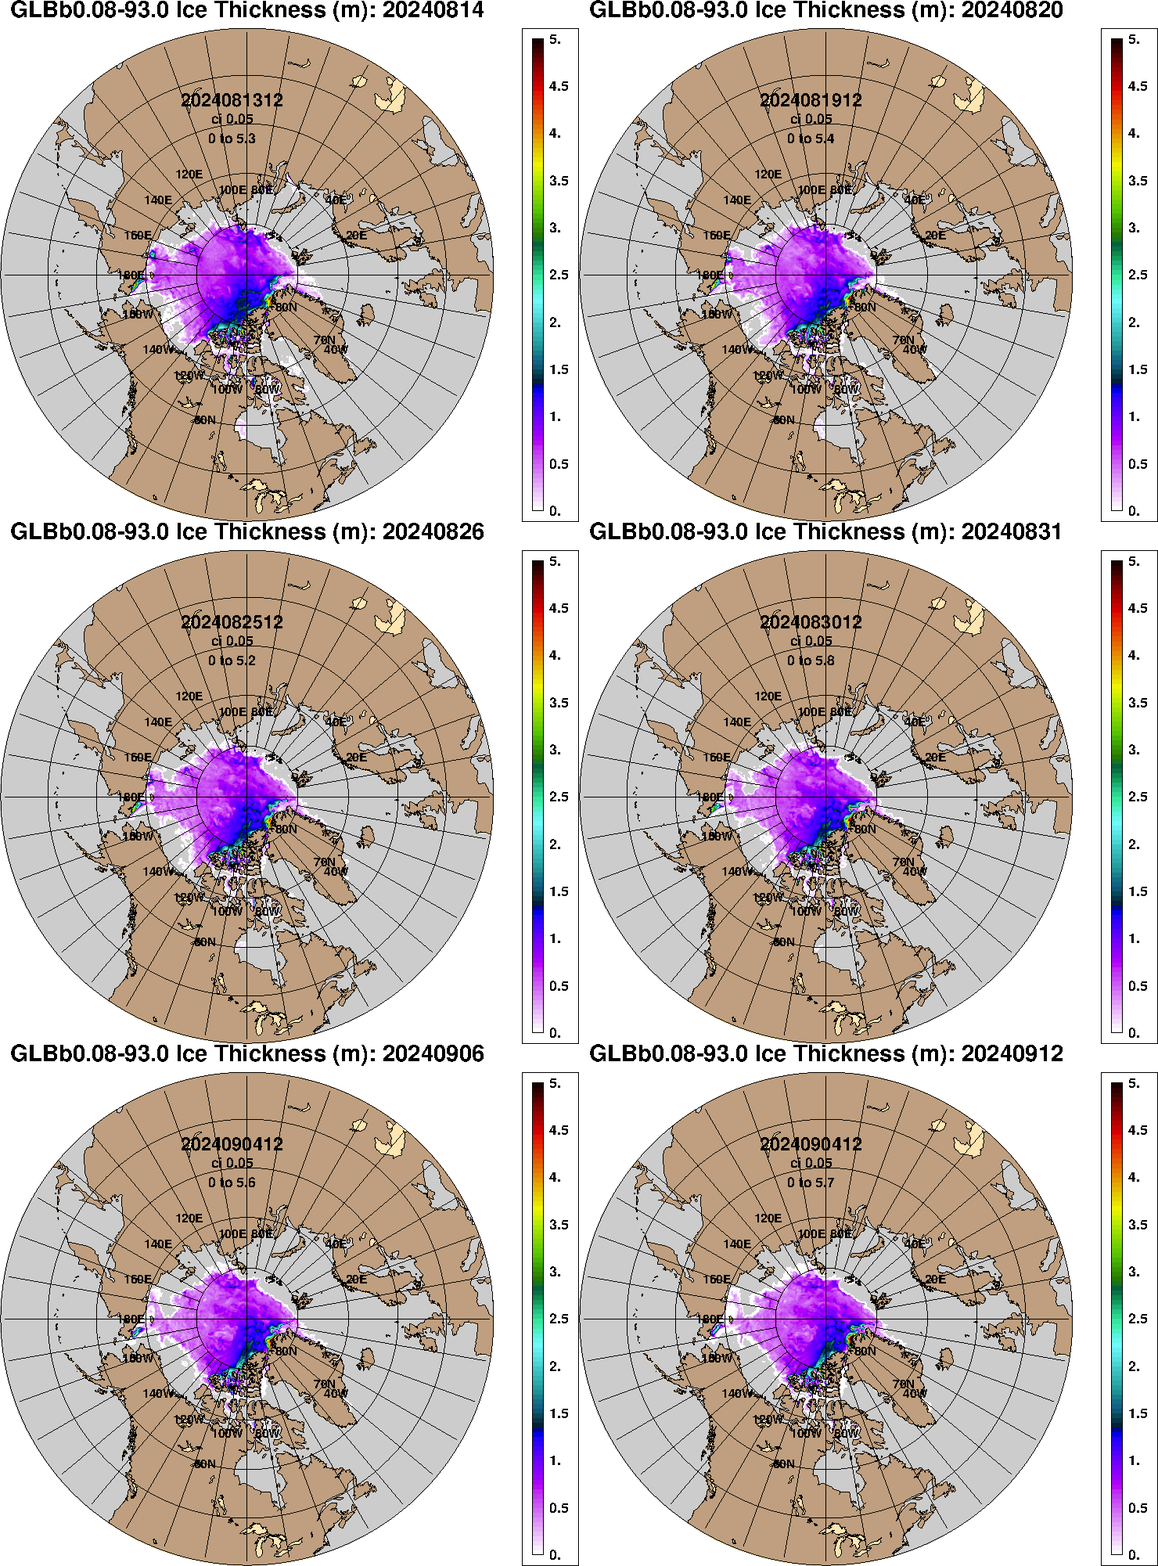
Arctic sea ice 4th lowest on record 19 Sept 4.230 million km², with a lot of the remaining ice thin and broken. Animation 09/07-09/28 – https://www7320.nrlssc.navy.mil/GLBhycomcice1-12/navo/arcticictn_nowcast_anim30d.gif

https://www.theguardian.com/world/2023/sep/13/antartica-global-warming-sea-ice-caps-regime-shift

Shocking record low maximum sea-ice extent for Antarctica to 28/09/2023; also began net melting on 8 Sept. (https://seaice.visuals.earth/)

Antarctic sea-ice at ‘mind-blowing’ low alarms experts Excellent BBC article with good links to further research and discussions.

(13.09/2023) Nature Communications Earth & Environment. Record low Antarctic sea ice coverage indicates a new sea ice state.

In February 2023, Antarctic sea ice set a record minimum; there have now been three record-breaking low sea ice summers in seven years. Following the summer minimum, circumpolar Antarctic sea ice coverage remained exceptionally low during the autumn and winter advance, leading to the largest negative areal extent anomalies observed over the satellite era. Here, we show the confluence of Southern Ocean subsurface warming and record minima and suggest that ocean warming has played a role in pushing Antarctic sea ice into a new low-extent state. In addition, this new state exhibits different seasonal persistence characteristics, suggesting that the underlying processes controlling Antarctic sea ice coverage may have altered. [my emphasis]
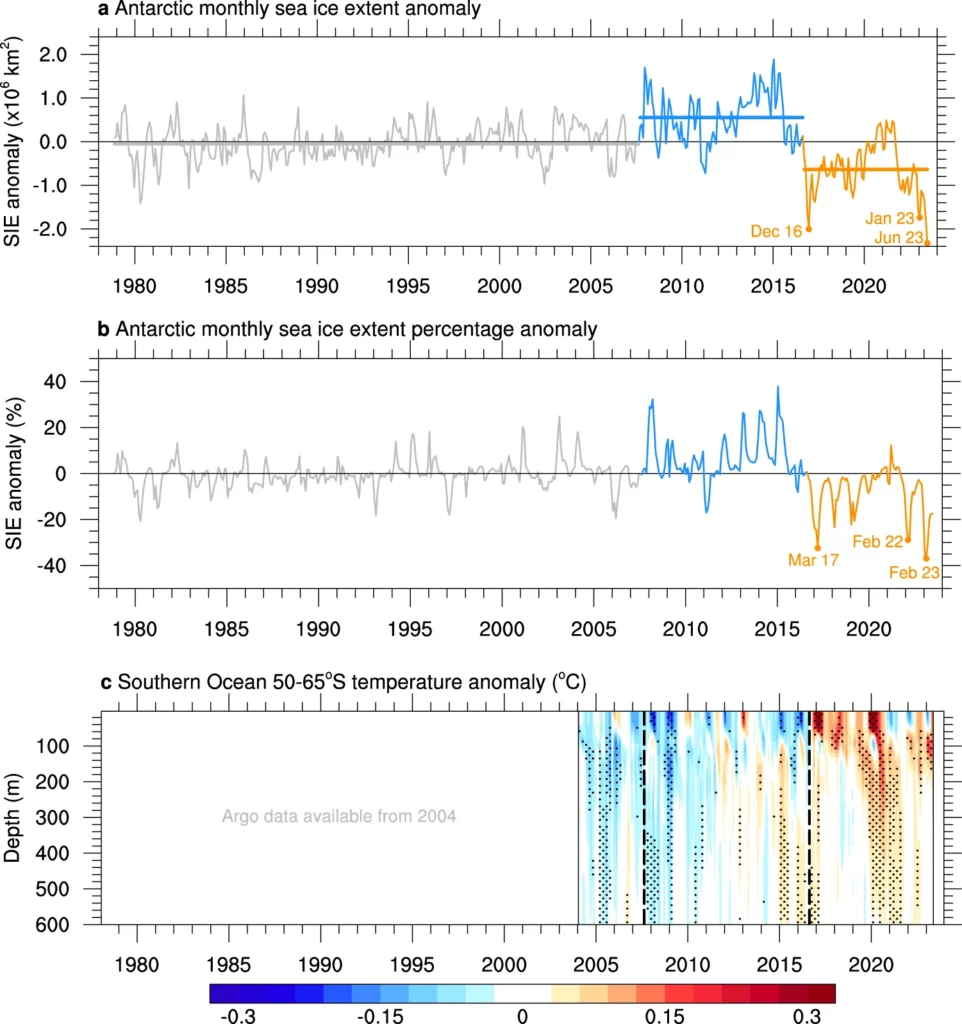
a Antarctic monthly sea ice extent (SIE) anomaly time series from the National Snow and Ice Data Center over the satellite period, November 1978 to June 2023, in millions of square kilometres. Sea ice extent anomalies are calculated relative to the 1979–2022 climatology. Two change points are detected, separating the time series into three periods: November 1978 to August 2007 (grey), September 2007 to August 2016 (blue), and September 2016 to June 2023 (orange). The means of each period are shown by the horizontal lines and are statistically distinguishable. b Antarctic monthly SIE anomaly time series expressed as a percentage of the monthly climatology over 1979–2022. Periods are coloured as in (a). Record minima months occurring since 2016 are noted in (a, b). c Southern Ocean 50–65°S temperature anomaly time series from Argo over January 2004 to May 2023, in degrees Celsius. Ocean temperature anomalies are calculated relative to the 2004-2022 climatology. Dashed vertical lines show the sea ice extent change points. Stippling indicates values outside ± 1 standard deviation, where the standard deviation is calculated independently at each depth level to account for the change in magnitude of the variability with depth. Warm anomalies shown in orange and red are evident below 100 m from 2015, and at the surface from late 2016.
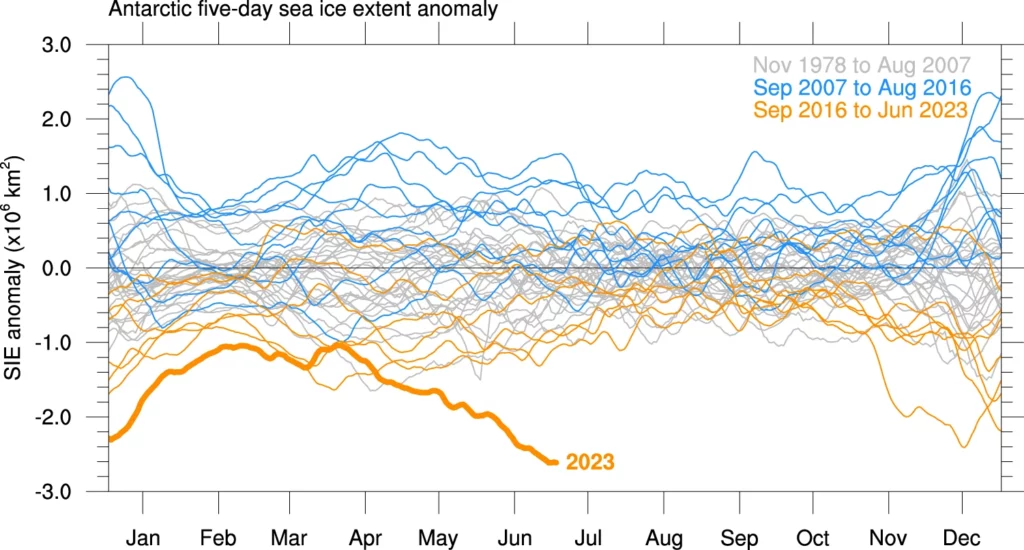
Antarctic five-day sea ice extent anomalies in millions of square kilometres for each year from the National Snow and Ice Data Center. Sea ice extent anomalies are calculated relative to the 1979–2022 climatology. Anomalies are coloured by period as in Fig. 1: November 1978 to August 2007 (grey), September 2007 to August 2016 (blue), and September 2016 to June 2023 (orange). January to June 2023 is shown in bold orange, with the largest negative areal extent anomaly of the satellite era observed during June 2023.

Implications

The current extremely low [Antarctic] sea ice will have a range of impacts. Changed ocean stratification and circulation will alter basal melting beneath ice shelves48. Greater coastal exposure will increase coastal erosion and reduce ice-shelf stability49. Changes in dense shelf water production will alter bottom water formation and deep ocean ventilation50. Sea ice changes will also have contrasting influences on Adélie and emperor penguin colonies51,52, and substantially alter human activities along the Antarctic coastline.

Anthropogenic greenhouse gas emissions have been attributed as the primary cause of Southern Ocean warming, and here we suggest a potential link to a regime shift in Antarctic sea ice. While for many years, Antarctic sea ice increased despite increasing global temperatures, it appears that we may now be seeing the inevitable decline, long projected by climate models. The far-reaching implications of Antarctic sea ice loss highlight the urgent need to reduce greenhouse gas emissions. [my emphasis]

End. For the complete article see Record low Antarctic sea ice coverage indicates a new sea ice state.

A very good summary of the state of global sea-ice to the end of September: https://www.carbonbrief.org/exceptional-antarctic-melt-drives-months-of-record-low-global-sea-ice-cover/

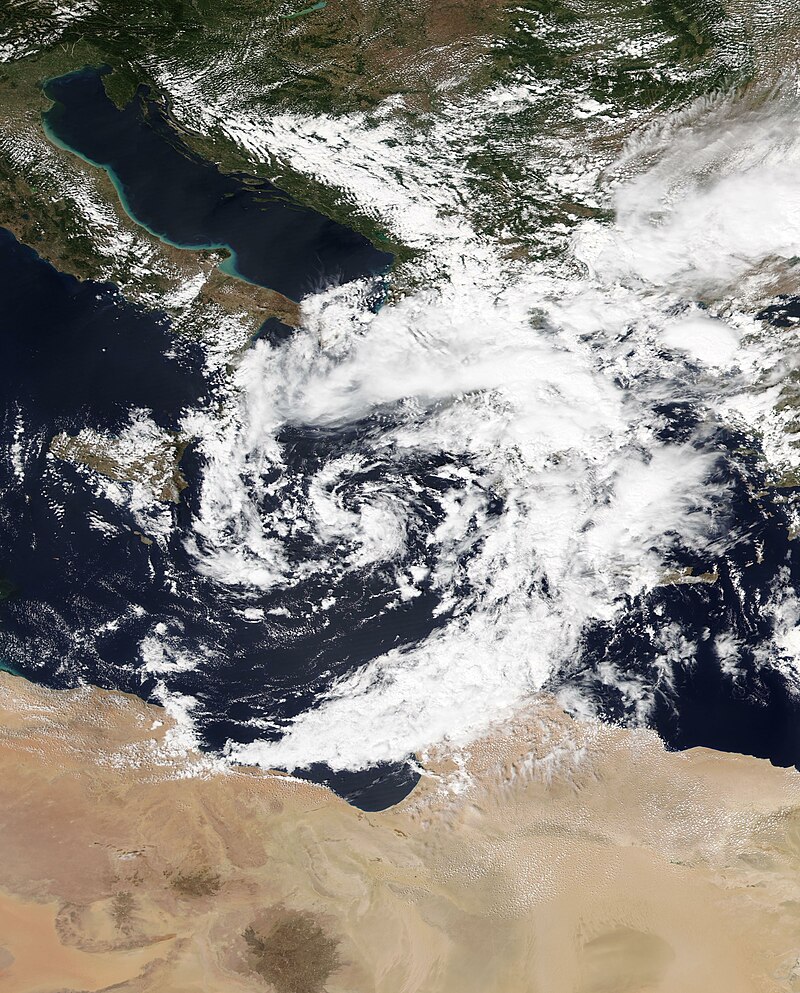
Storm Daniel comprehensively trashed several countries around the Eastern Mediterranean between 4 and 13 Sept.

Wikipedia tells the story and links to many of the news items. It was the deadliest Mediterranean tropical-like cyclone in recorded history
Greece

https://www.theguardian.com/world/2023/sep/09/greek-rescuers-working-through-the-night-to-locate-villagers-trapped-by-flood: “The once fertile Thessaly plain, the nation’s breadbasket, now lies metres deep under mud and silt, with great swaths resembling a lake.” I read somewhere else that 1/3 of Greece’s TOTAL prime agricultural land was under water….

https://earthobservatory.nasa.gov/images/151807/a-deluge-in-greece
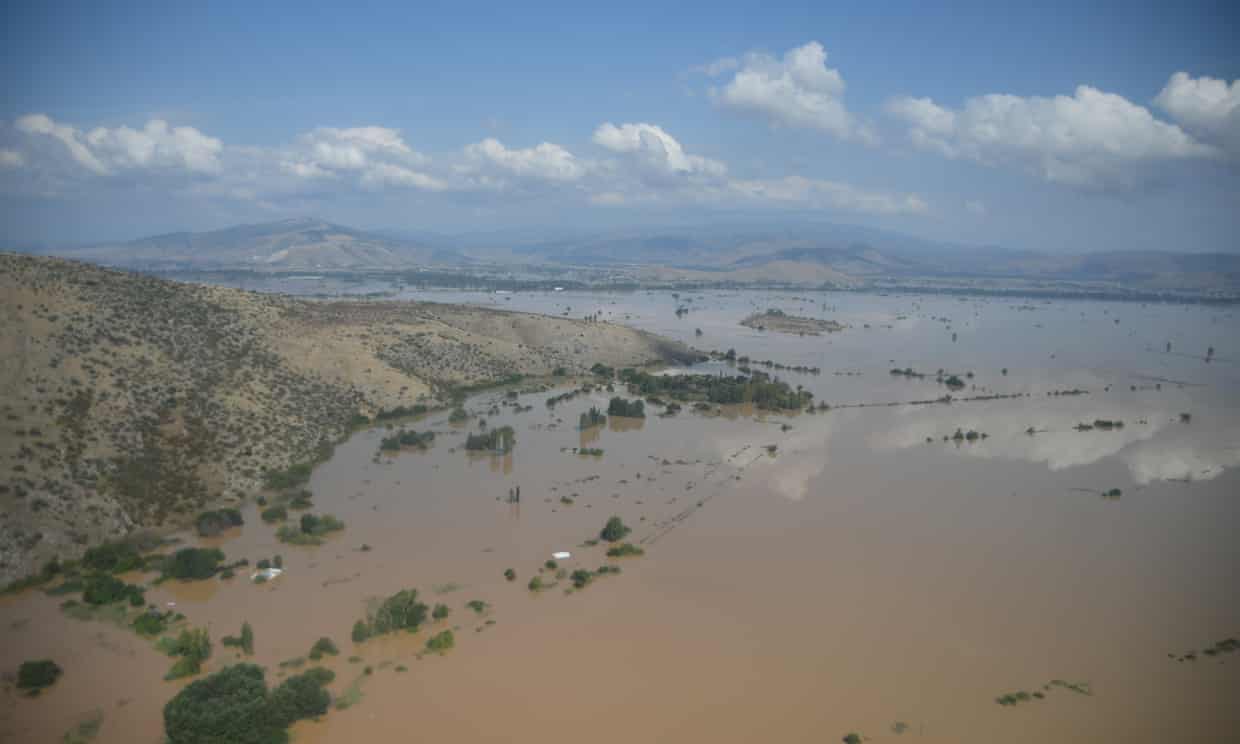
https://www.aljazeera.com/news/2023/9/12/death-toll-in-libya-floods-reaches-3000-benghazi-administration

Key facts from CDR (Center for Disaster Recovery):

  • As of Sept. 15, the Libyan Red Crescent said the death toll had reached 11,300 people in Derna alone. Officials expect this figure to continue to rise, possibly as high as 20,000. About 170 people were also killed in other parts of eastern Libya, including in Susa, Marj, Bayda and Um Razaz. More than 7,000 people were injured and at least 10,100 people are still reported to be missing. Because of the lack of telecommunications, some may be displaced and unable to reach family, but due to the large-scale destruction, it is hard to confirm these figures.
  • According to Floodlist, Libya’s National Center of Meteorology reported, “in a 24 hour period to Sept. 10, a staggering 414.1 mm [16.2 inches] of rain was recorded in Bayda, while 240 mm [9.5 inches] of rain fell in Marawah in the District of Jabal al Akhdar, and 170 mm [6.7] fell in Al Abraq in the Derna District.”
https://disasterphilanthropy.org/disasters/2023-libya-floods/

I used publicly available satellite imagery to try assess the damage attributed largely due to the failure of two dams. My conclusion is that the dams were no more than momentary and relatively insignificant barriers to to the flow of an inconceivably large volume of water. The following satellite images from Google Earth, and Sentinel Hub’s EO Browser clearly demonstrate the power of our planet’s increasingly extreme weather events driven by global warming. As the oceans and atmosphere warm, the atmosphere is able to transport increasingly stupendous volumes of water (in the form of water vapor) over the land to be dropped when the air cools for any reason.

The following image is what appears to be the center of the city of Derna (pop ~100,000) immediately before Storm Daniel dropped part of its load of water in the watershed of Wadi Derna. The very dry stream bed of Wadi Derna crosses the center of the image. If you have access to Google Earth, you can zoom in to see shadows of the few individual people out in the mid-day sun.
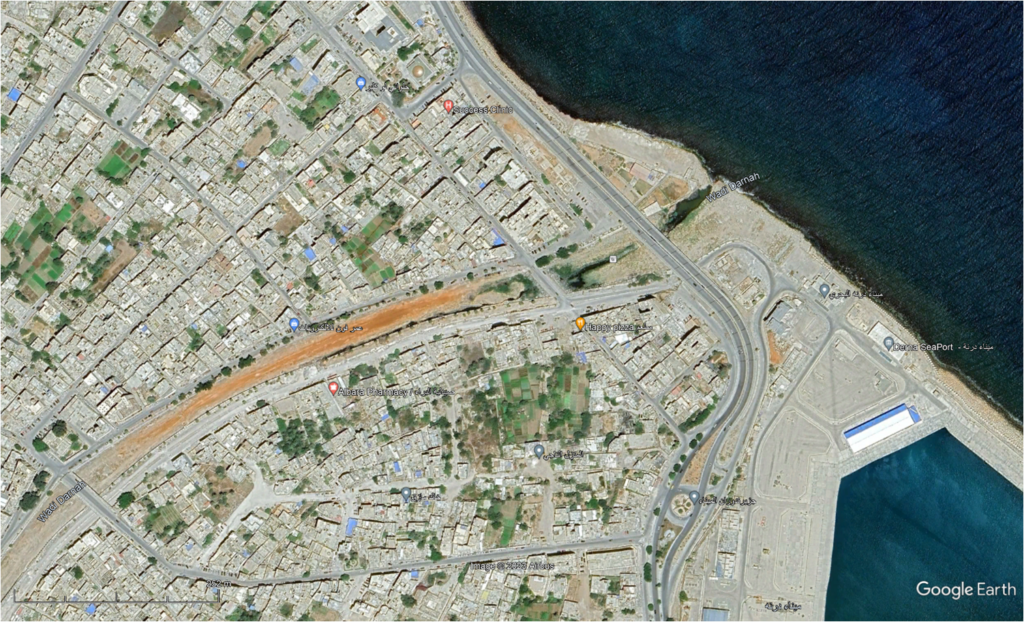
Zooming in, note the large building on the NE side of the Wadi 3 blocks downstream from the bridge on the lower left corner of the picture. It is a high-rise, where the tallest part is 9 stories above the ground floor, and the rest five. I determined the number of floor by counting the sun shades visible on the downstream side of the building. This is one of the few structures left in this part of town that can be identified in the next image.

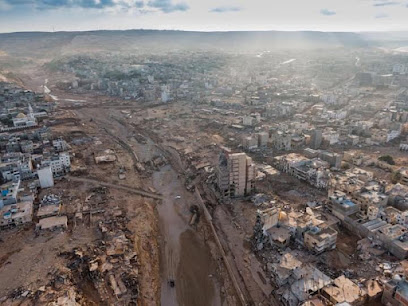
Immediately after it looked like this:
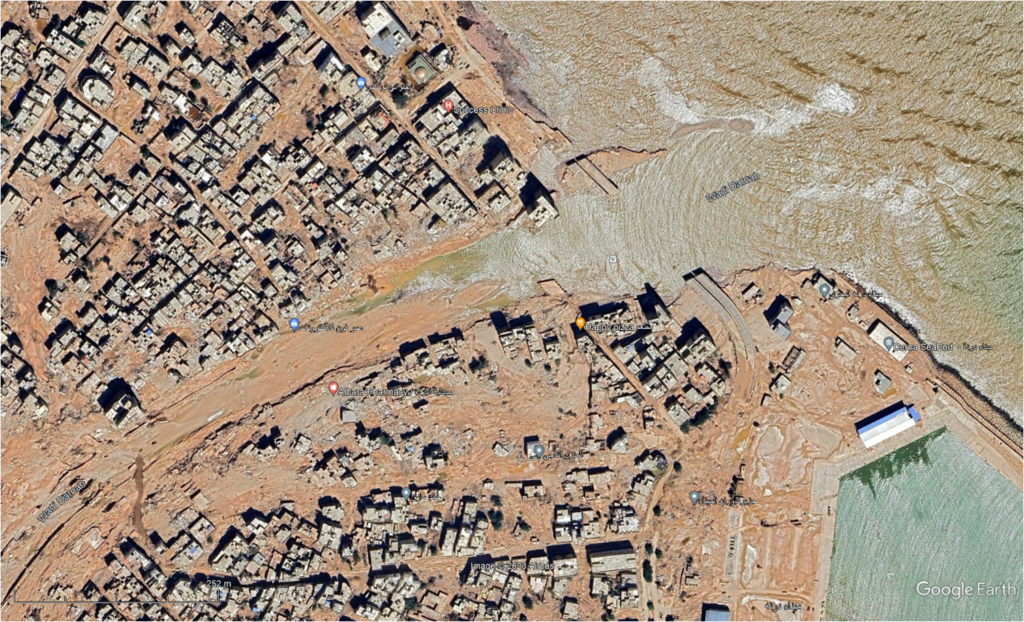
Note the conspicuous high-rise (10 stories) easily marked by its long shadow in this image. The image below images this building from the down-stream side. The image here is relatively low resolution, but the three lowest floors (facing AWAY from the flood) have clearly been gutted by the flood. The bridge referred to in the previous picture has vanished leaving only two supports (aligned with the stream flow) to show where it was. Rows of 4-6 story buildings (and even some 8 story buildings just off the left edge of this image) extending 3-4 and even more rows back from the Wadi have totally vanished or are only memorialized by a bit of concrete slab or trace of a foundation wall.

The next two pictures zoom in on the area between the vanished bridge in the above images and the next bridge upstream (just off the edge of the above).

The three buildings to the left of the Wadi at the bottom of the image were respectively 7, 4, and 7 stories high

The next two pictures show the site of the lower dam – 250 meters upstream from the inland edge of the city.

Note: the dam has no spillway. Overflow protection is provided by the flared drain pipe (circular structure) in the lower left of the picture. Using Google Earth’s measuring tool, the diameter of the drain as approximately 6m. On the upstream side the surface of the reed bed is ~24 m above sea level, and the level of the road over the top is 45 m, giving the dam height of 21 m. On the downstream side the base of the dam is at 26 m, with the outlet for the overflow drain at approx 22 m. The length of the dam across the top is ~115 m, across the bottom (at reed level) is 50 m; thickness at the bottom is ~74 m, 8.5 m at the roadway.

The next Google Earth image is of the upper dam (12.5 km upstream from the lower dam) from immediately before Storm David’s rain. There is no high resolution image available from after the flood.

The drain tube (right side upstream) seems to be 7m in diameter. The dam is ~10 m high and 270 m long. 143 m thick at the base and 6.5 m thick at the top.

The last composite graphic gives an impression of the amount of water held behind both dams in the days immediately prior to Storm David. All are sourced via Sentinel Hub’s EO Browser and all are at the same scale – close to the maximum resolution available. The left four images are of the upper dam and its lake, while those on the right are of the lower dam and its lake. The upper three images of each dam use the Normalized Difference Moisture Index NDMI – that basically highlights any moisture in the otherwise barren landscape. The bottom picture is the same view as the one immediately above, except that it displays “true colors”. On the left in the top picture, on 10/01/2023 there was some water backed up behind the dam, perhaps 2 m deep at the dam wall given that most of the upstream face is still dry. The second picture, on 02/09/2023 shortly before Storm Daniel shows essentially zero moisture behind the dam, except there is a tiny blue streak in the bottom of the bright yellow area that is too small to be resolved at the magnification shown here. The blue areas below the dam are well watered orchards and fields – not standing water. The dam is visible in both of the above pictures. The third picture, from 12/09/2023 immediately after Storm Daniel shows the Wadi Derna has been scraped clean of any sign of a dam or the well watered agricultural area below the dam save the blue area off to the side. Inspection of the area just downstream from the pictures here in the before and after show the complete obliteration of farms and vegetation together with the road to a height of 20+ meters above the bottom of the wadi. A little further upstream – a bit closer to the dam, the landscape has been scraped up to a height of 38 m! above the wadi bottom, where the width of the wadi is approximately 200 m across. The height of this point is ~215 m above sea level (at least 10 m higher than the top of the dam!).

A similar story can be constructed for the pictures of the lower dam in the right column. The dams were minor inconveniences to the flow of the total volume of the storm water.

The Wadi Derna drains a large and relatively barren plateau with some of the weirdest landforms I have seen, and could possibly be organized so it receives large volumes of water from a number of subsidiary drainages at the same time. Or, more likely, the insanely hot Mediterranean air was supersaturated with water, and the storm dynamics led to rapid cooling that squeezed all of the water out over a very short period of time….. And the barren plateau lacked soil and vegetation to slow the flow of the water once it hit the ground, and simply demonstrated what can happen when the Earth System has too much energy to dissipate all at once in the form of climate catastrophes.

Consequently….

Our planet is progressively becoming uninhabitable!

https://www.salon.com/2023/09/13/humans-are-dangerously-pushing-the-limits-of-our-planet-in-ways-other-than-climate-change/

Earth beyond six of nine planetary boundaries

We’ve already breached 1.5 °C above preindustrial global temperatures and worse to come is already in the pipeline

https://www.abc.net.au/news/2023-09-11/global-temperatures-pass-1-5c-above-pre-industrial-levels/102836304

Not yet getting back to anything as cool as last year’s near record highs after more than 3 months! – https://climatereanalyzer.org/clim/t2_daily/?dm_id=world
3+ months and the anomaly is still trending ever more extreme as the sub-solar point moves towards the Southern Hemisphere!
Global Average Sea Surface Temperature still above previous years ALL TIME RECORD HIGH TEMPERATURE with trend line still widening the gap. 90% of excess solar heat is first absorbed into the oceans to heat the globe as a whole. – https://climatereanalyzer.org/clim/sst_daily/
Southern Hemisphere anomaly also in record extreme territory and rising rapidly. Antarctic rising and ~1 day from record daily high.
Sept. 13 and Antarctic sea ice already beginning to melt after 4+ months of record low freezing rate, to create a global average record low amounts of sea ice. At the southern summer low to come will there be ANY sea ice left around Antarctica? What does this mean for ice shelves and glacier fronts exposed to warm pounding waves and tides? – https://nsidc.org/arcticseaicenews/charctic-interactive-sea-ice-graph/
Sept. 19 and the ice is rapidly melting into ever more extreme low sea ice for the date.
Sept 19 and rapid Antarctic melting keeps global coverage more than 4 σ below any previous low for the date. Not good news for southern summer! https://seaice.visuals.earth/
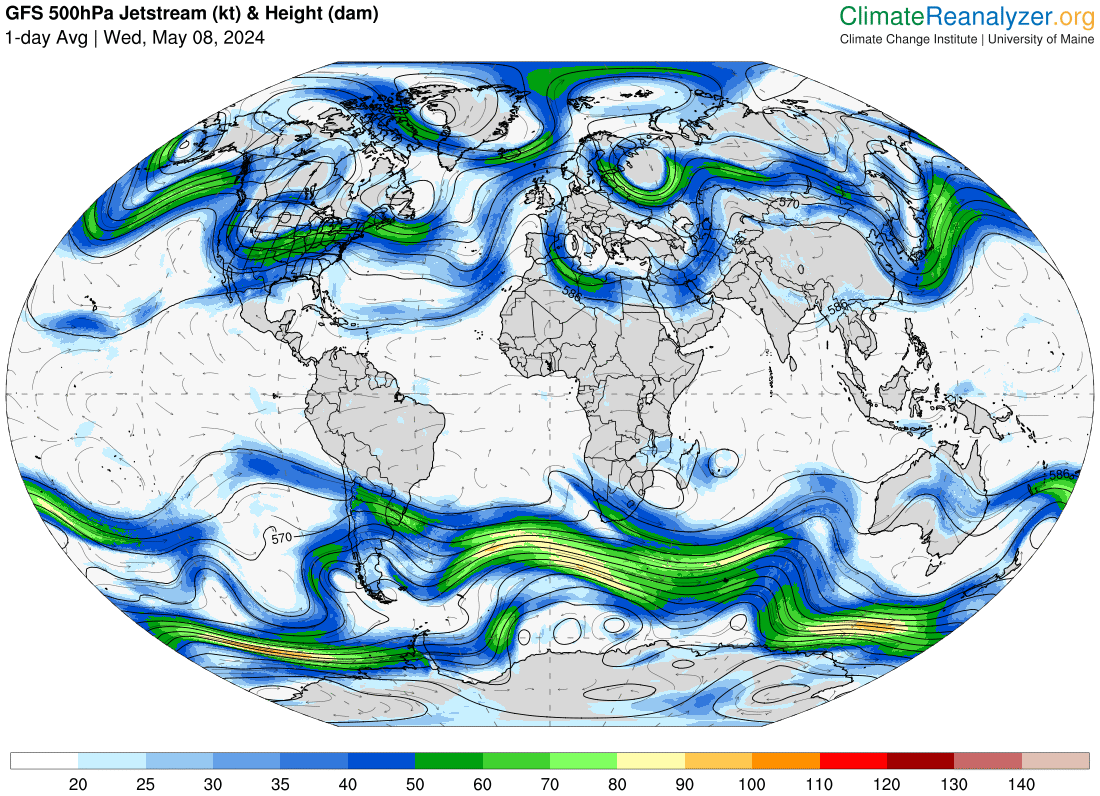
Record high temperatures & reduced temperatures between polar and ‘temperate’ zones lead to crazy, weak and chaotic jet streams; in turn allowing stalled extreme heat domes, droughts and wildfires; lethally moist air masses, biblical flooding, and catastrophic storms.
OUR GOVERNMENTS ARE STILL PROMOTING AND SUBSIDIZING FOSSIL FUEL BURNING!
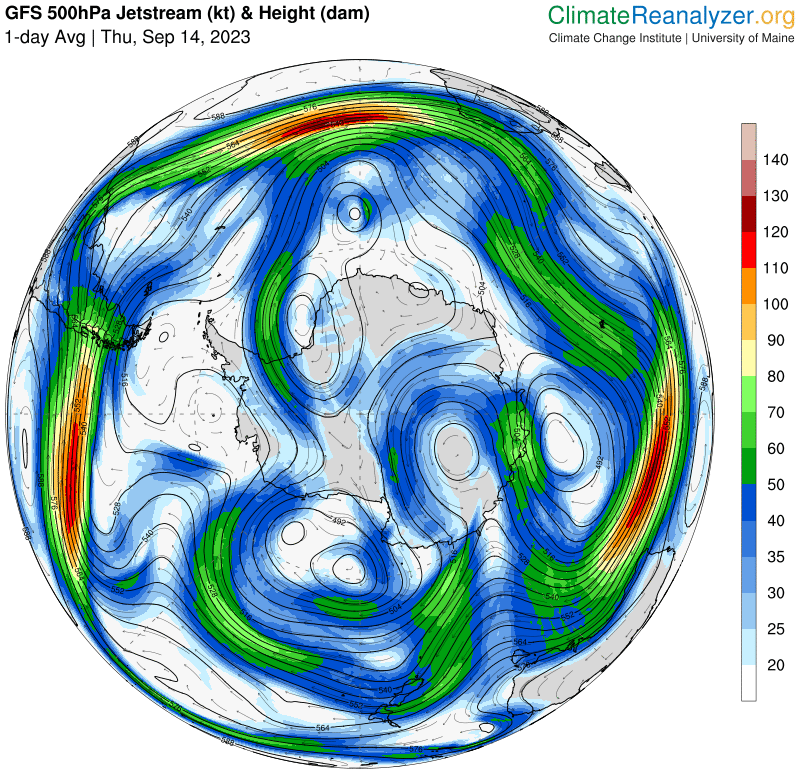
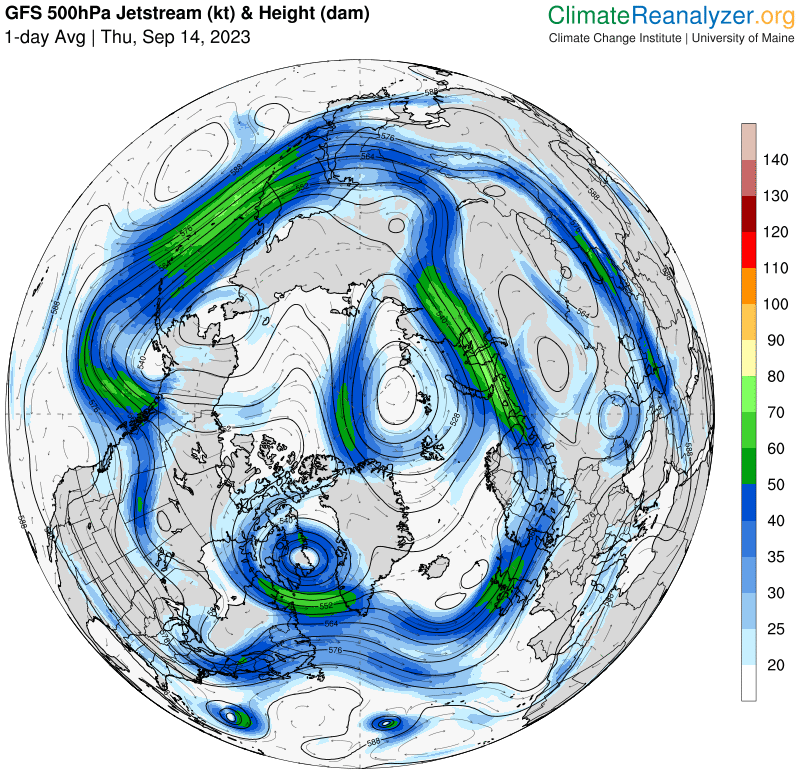
Forecast Image

https://climatereanalyzer.org/wx/todays-weather/?var_id=ws500-gph&ortho=5&wt=1

https://www.abc.net.au/news/2023-09-17/unusual-el-nino-development-bureau-of-meteorology-iod/102861886

South America mid Sept. — What about Australia this summer?
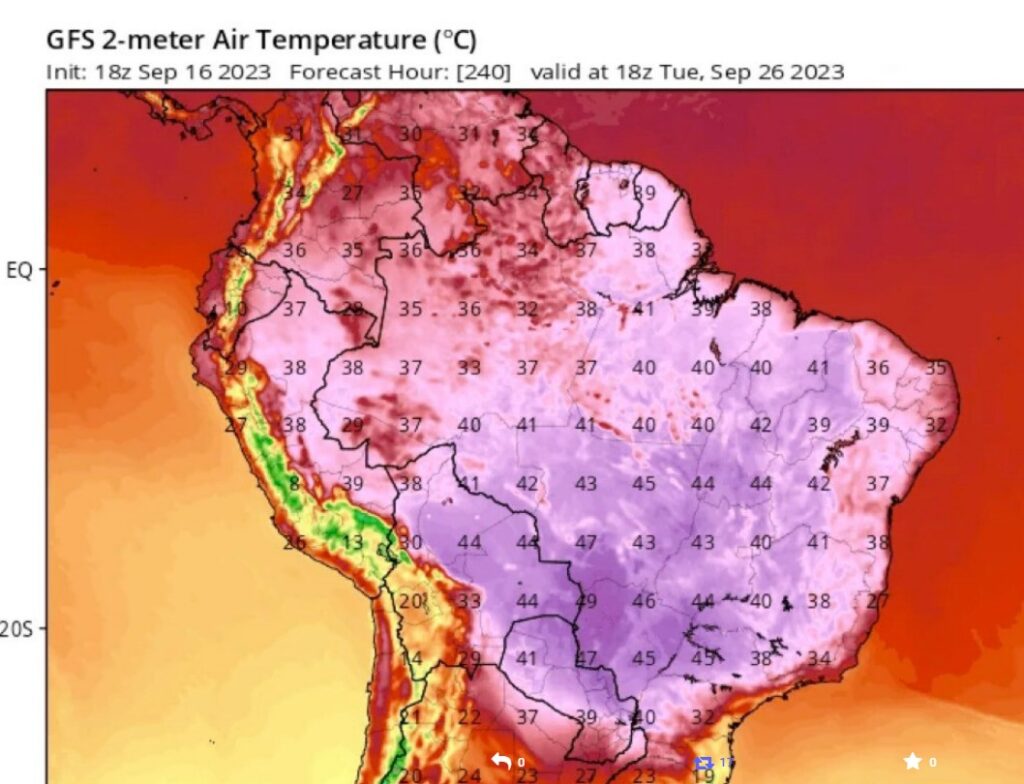
Biff Vernon – Facebook: Dangerous temperatures forecast for next week over a large part of South America.
Southern Hemisphere temperatures now: Brazil Max on Thursday 41 °C; 42 on Friday; Uruguay 43 on Saturday; 44 on Sunday.

Earth’s energy imbalance (solar radiant energy in – earth radiant energy out) = energy heating planet Earth.

Simons puts the previous graphs in a geological context based on Shackleton et al’s reconstruction of variations of Earth’s energy balance determined from measurements of Oxygen isotope ratios in sediment cores from the seabeds.

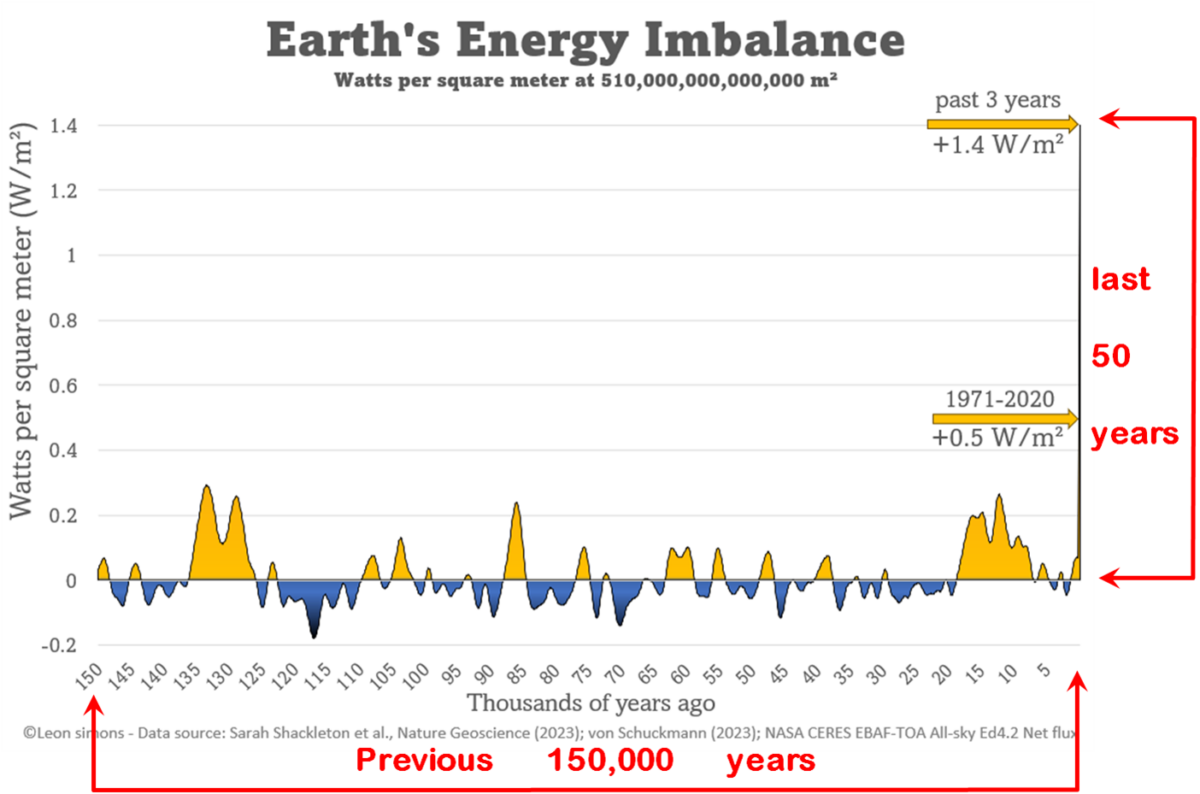
The thread from https://twitter.com/LeonSimons8/status/1698413266421096893 explains in some detail how the following graph was inferred and extrapolated from the above. At first I found it difficult to make sense of this graph until I grasped that the vertical line defining the right-hand side of the graph was data, comparing the imbalance observed directly over the last 50 years, with the variation recorded over the last 150,000[!] years, not the border….

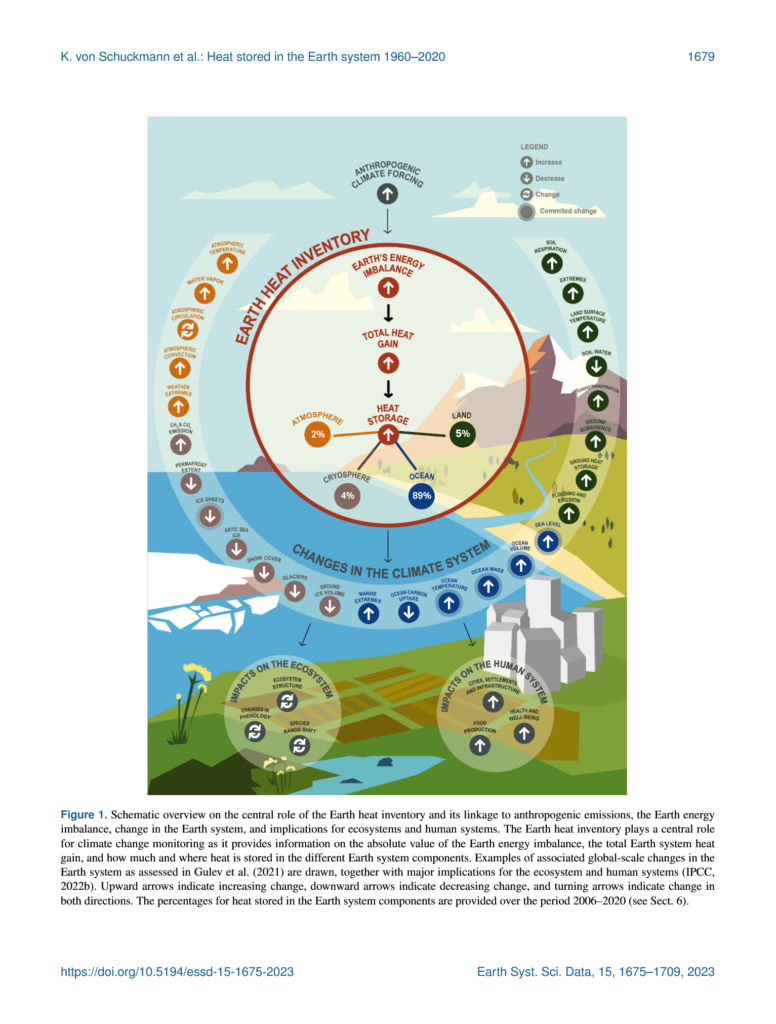
Simons was one of the coauthors of the above paper.

Australia hasn’t escaped

https://twitter.com/joellegergis/status/1709024553048191389

Costs & Consequences

Note that the following X-Tweet is limited to the United States – based on a Scientific American article. The rest of the world is suffering at least as much! Total costs are adjusted for inflation. It isn’t clear whether this also applies to the individual “billion dollar” events in the graph below.

Jonathan Overpeck @GreatLakesPeck Environmental/Climate scientist for 30+ years; Samuel A. Graham Dean, @UMSEAS @UMICH . Tweets my own. Thinking grad school? Join me at @UMSEAS: http://myumi.ch/n8mM2

Given the rapidly growing accumulation of excess heat in Earth’s oceans, if we cannot stop and reverse global warming within the next few years the inevitable result will be ecological and social collapses, within a few decades, and likely global extinction of most complex organisms — including humans within a century or so….

We must act before it is too late!

Featured Image

Based on an image by Leon Simons, https://twitter.com/LeonSimons8/status/1698410404693594417 depicting the urgent existential problem facing humanity today: If we cannot reverse the heating spike forming the right-hand border of the graph and force it below the neutral line forming the graph’s X axis within a few years, most complex life on Earth will be extinct in a century or so.
Views expressed in this post are those of its author(s), not necessarily all Vote Climate One members.

Politics vs physical dangers and real death

IPCC warns we have only a few years left when climate action can reverse human caused global warming to avoid a crescendo of climate catastrophes

Unfortunately, we are living in a world where the greedy self-interests of billionaires and multi-national corporations tend to control media and politics. These special interests are threatened by things that must be done to slow and stop global warming. They use their power over the media and politicians to deny the need for and to prevent critically important climate action. However, the real-world understanding reported in the concluding summary of the IPCC’s 6th Assessment Report on Climate Change (published this week) documents and explains the very real dangers and even mass deaths society faces if global warming is not stopped by 2030. We genuinely face a climate emergency that threatens human survival. To have any hope of organizing and implementing the kinds of statewide and national actions needed to stop the warming process citizens have to replace the parliamentary puppets of special interests with MPs who will genuinely work for the citizens who elected them. In New South Wales, how you vote this week is a life-and-death matter!

The IPCC is the Intergovernmental Panel on Climate Change formed by the World Meterological Organization and the United Nations in 1988 to study and advise world governments on climate change. The IPCC’s Summary for Policy Makers published this week was unanimously agreed to and signed off by the politically appointed representatives of all 195(!) member governments of the United Nations that form the World Meteorological Organization (normally only 170-180 governments participate in IPCC reviews). This unusual approval process required for IPCCs “summary reports” is intended to ensure that governments accept its findings as authoritative advice on which to base their actions (a 1:30 minute IPCC video explains).

I have explained that this approval process is highly conservative and cannot avoid downplaying the extent and dangers of climate change. In reality, the actual dangers to humanity are likely to be a lot worse than described by the IPCC. New South Wales residents who are currently voting on their state government (polls close on 25 March) should note that all the modeling and predictions discussed in the Report are based on weather and climate data collected only up to 2020. The models and predictions do not include evidence on or predict how extreme climate events have actually been: e.g.,Black Summer bushfires, more than two years of unprecedented and widespread flooding, extreme heatwaves and drought, etc. If you are living on the land or close to Nature, you will know that the reality you are living with is already significantly worse than anticipated by the IPCC.

At nearly 8,000 pages, the full report is virtually unreadable. Every statement is documented, justified, and qualified. Fortunately, the World Resources Institute has done an admirable job of highlighting critical content in a readable way:

Cover Image by: Anirut Thailand/Shutterstock (from the article)

by Sophie Boehm and Clea Schumer, 20/03/2024 in World Resources Institute – Insights

10 Big Findings from the 2023 IPCC Report on Climate Change

Today marks the release of the final installment of the Intergovernmental Panel on Climate Change’s (IPCC) Sixth Assessment Report (AR6), an eight-year long undertaking from the world’s most authoritative scientific body on climate change. Drawing on the findings of 234 scientists on the physical science of climate change, 270 scientists on impacts, adaptation and vulnerability to climate change, and 278 scientists on climate change mitigation, this IPCC synthesis report provides the most comprehensive, best available scientific assessment of climate change.

It also makes for grim reading. Across nearly 8,000 pages, the AR6 details the devastating consequences of rising greenhouse gas (GHG) emissions around the world — the destruction of homes, the loss of livelihoods and the fragmentation of communities, for example — as well as the increasingly dangerous and irreversible risks should we fail to change course.

But the IPCC also offers hope, highlighting pathways to avoid these intensifying risks. It identifies readily available, and in some cases, highly cost-effective actions that can be undertaken now to reduce GHG emissions, scale up carbon removal and build resilience. While the window to address the climate crisis is rapidly closing, the IPCC affirms that we can still secure a safe, livable future.

Looking Ahead

The IPCC’s AR6 makes clear that risks of inaction on climate are immense and the way ahead requires change at a scale not seen before. However, this report also serves as a reminder that we have never had more information about the gravity of the climate emergency and its cascading impacts — or about what needs to be done to reduce intensifying risks.

Limiting global temperature rise to 1.5 degrees C (2.7 degrees F) is still possible, but only if we act immediately. As the IPCC makes clear, the world needs to peak GHG emissions before 2025 at the very latest, nearly halve GHG emissions by 2030 and reach net-zero CO2 emissions around mid-century, while also ensuring a just and equitable transition. We’ll also need an all-hands-on-deck approach to guarantee that communities experiencing increasingly harmful impacts of the climate crisis have the resources they need to adapt to this new world. Governments, the private sector, civil society and individuals must all step up to keep the future we desire in sight. A narrow window of opportunity is still open, but there’s not one second to waste. [my emphasis]

Read the complete article….

Think about what this means!

As reported extensively in all Australian media today (21 May) the agreed IPCC summary says that near-term (i.e., ASAP!) climate action is urgent because the window is closing for us to secure a livable and sustainable future, and that: “The choices and actions implemented in this decade will have impacts now and for thousands of years”. These and many other critically important points are clearly summarized in the Headline Statements, which are the overarching conclusions of the approved Summary for Policymakers. Taken together these provide a concise narrative as to why effective action on the climate emergency is so urgent.

If you care for your future and the future of your family and society, you need to take the IPCC’s cautions and warnings seriously. And consider what this means in a world where your political representatives are likely to be more concerned to satisfy the wants of their big donors and special interests rather than you or other citizens of their electorates. These big donors are developers, fossil fuel industries, miners, etc., who are more concerned about immediate profit rather than future survival.

Think: if you are a “rusted-on” voter who can be counted on to vote for the incumbent or party you have always voted for, especially in a ‘safe’ seat, your ‘representative’ has no reason to consider your future in any way, and can work full time for the special interests.

However, in Australia, we still live in a democracy where your considered vote can actually work to throw the bastards out, by electing someone you can reasonably trust to work for the community of those who vote rather than those who pay…. Given the nature and reality of the climate emergency, you should consider Vote Climate One’s motto:

We need to treat the climate emergency as a global war we are on track to lose unless we can focus our efforts on the only task that matters — reversing global warming. If we fail here no other tasks matter — our species will soon end up extinct no matter how we arrange the deck chairs on the burning ship.

How Vote Climate One can help

Science and politics

If you need more evidence that we need to change our governments, there is plenty on our Climate Sentinel News blog covering both science and politics.

How to vote

We don’t tell you how to vote. We work to help you achieve the results you want when you vote.

In Australia, Vote Climate One works to assess and rank how we think every party and independent candidate on the ballot in Federal and all State elections will respond to the climate crisis. Thanks to modern computer technology this is actually do-able. How we rank candidates is explained in our Climate Lens Traffic Light Assessment process. Sometimes, we’ll even get on the phone to find out more. The undeniable task of the climate lens is to prioritise the protection of everything we hold dear. The hubris of our species needs a dose of the reduction perspective tranquilizer encapsulated in this painting by Peter Trusler.

Peter Trusler – from his book, Thrice Told

Our conclusions are presented via downloadable and printer-friendly voting guides for each and every electorate in NSW. You can find the guide for your electorate here (in this case, Lismore). The electorate screen tells you how we can help. Parties and candidates we think will work for climate action are designated with green lights. Those who we think won’t or who haven’t given us much to go on, are designated with red lights, Those we think are better than the worst, but not fully trustworthy are designated orange.

If you are concerned to see action on climate change, number all the green-light independents and parties first. Thus, even if your number [1] selection doesn’t win, you still maximize the chances that someone else with good climate credentials will be elected. If you want detail to help you decide how to rank green-light candidates, the Research Tools provide links to candidate websites and other information about them.

As Rob and his grandchildren explain in the video, the printable voting guides make it easy for you to transfer your preferences to the ballot paper in the voting booth:

Remember, we are voting in hopes of leaving a happy future for our families and society.

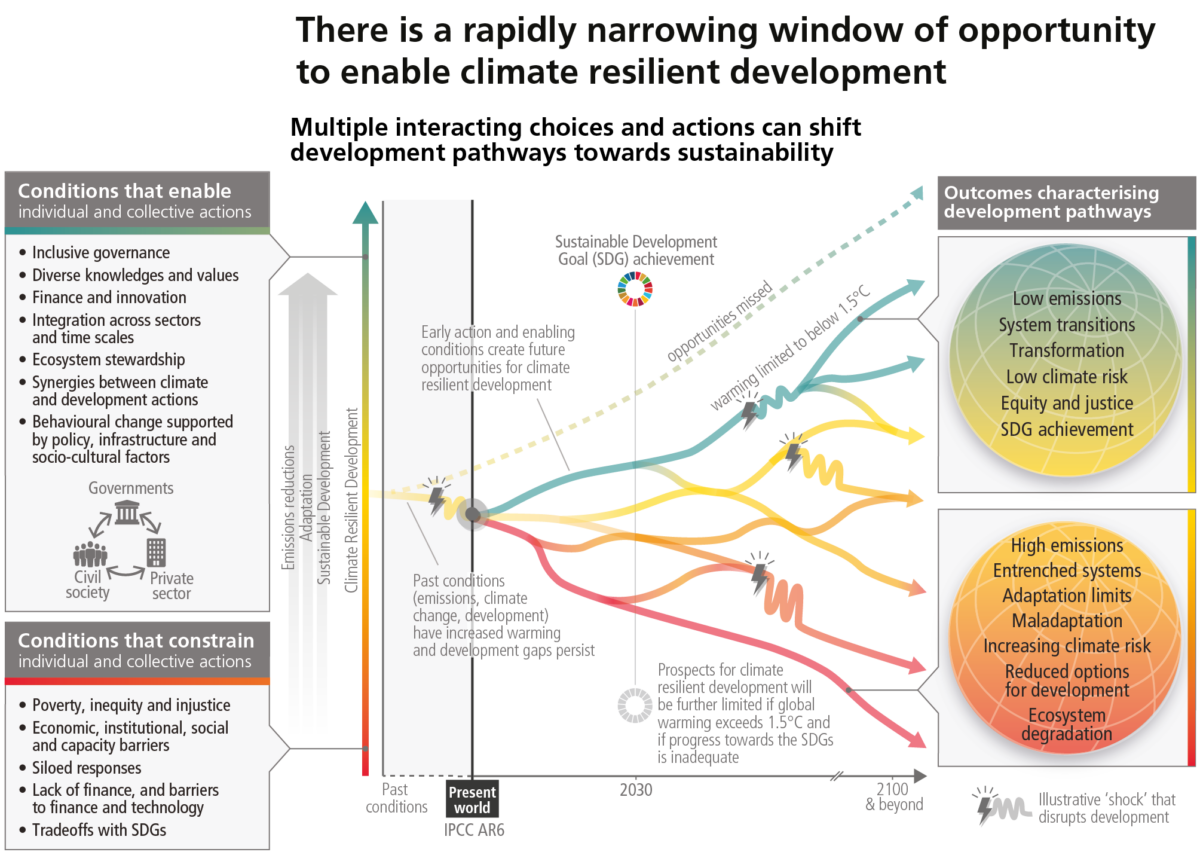
About the featured image: Figure SPM.6 from Summary for Policymakers, AR6 Synthesis Report: Climate Change 2023

There is a rapidly narrowing window of opportunity to secure a liveable and sustainable future for all. There are a multitude of political choices that need to be made during this window. If we make good ones we can go on living in a world with a sustainable future. Bad choices will rapidly constrain our future to pathways that are likely to lead to societal collapse and eventual human extinction in a still rapidly warming world.

Figure caption: The illustrative development pathways (red to green) and associated outcomes (right panel) show that there is a rapidly narrowing window of opportunity to secure a liveable and sustainable future for all. Climate resilient development is the process of implementing greenhouse gas mitigation and adaptation measures to support sustainable development. Diverging pathways illustrate that interacting choices and actions made by diverse government, private sector and civil society actors can advance climate resilient development, shift pathways towards sustainability, and enable lower emissions and adaptation. Diverse knowledge and values include cultural values, Indigenous Knowledge, local knowledge, and scientific knowledge. Climatic and non-climatic events, such as droughts, floods or pandemics, pose more severe shocks to pathways with lower climate resilient development (red to yellow) than to pathways with higher climate resilient development (green). There are limits to adaptation and adaptive capacity for some human and natural systems at global warming of 1.5°C, and with every increment of warming, losses and damages will increase. The development pathways taken by countries at all stages of economic development impact GHG emissions and mitigation challenges and opportunities, which vary across countries and regions. Pathways and opportunities for action are shaped by previous actions (or inactions and opportunities missed; dashed pathway) and enabling and constraining conditions (left panel), and take place in the context of climate risks, adaptation limits and development gaps. The longer emissions reductions are delayed, the fewer effective adaptation options.

Views expressed in this post are those of its author(s), not necessarily all Vote Climate One members.