
Updating IPCC AR6: still bound for catastrophe
International group of climatologists launch a set of annually updated climate indicators to track human induced global warming through time.
This decade is absolutely critical for climate action if we are to avoid climate catastrophe. However, up to now we have lacked a standardized set of measures of the level of human-induced warming for tracking our progress over times as short as a year.
So far, the gold standard against which progress can be measured has been the IPCC’s cycle of Assessment Reports (e.g., the latest being AR6, completed this year). These have been published on cycle times of 6 to 7 years.
A team of 50 authors from major climate science institutes and universities around the world under lead author, Piers Maxwell Forster of the Priestly Centre University of Leeds, have set out to publish annually updated reliable global climate indicators in the public domain. This is based on the assessment methods used in the IPCC Sixth Assessment Report (AR6) Working Group One (WGI) report, to update the monitoring datasets and to produce updated estimates for key climate indicators. These include emissions, greenhouse gas concentrations, radiative forcing, surface temperature changes, the Earth’s energy imbalance, warming attributed to human activities, the remaining carbon budget and estimates of global temperature extremes. As these measurements are traceable and consistent with IPCC report methods, they can be trusted by all parties involved in UNFCCC negotiations and help convey wider understanding of the latest knowledge of the climate system and its direction of travel.
The preprint of their first update, Indicators of Global Climate Change 2022: Annual update of large-scale indicators of the state of the climate system and the human influence, was submitted for review (open for discussion on 05/05/2023) to the Copernicus journal Earth Systems Science Data.
Although still unreviewed, this work certainly provides the most up to date data on our progress towards reversing global warming while that might still be possible.
The news is bad. Although there are a few improvements in isolation, nothing we have done through the end of 2022 has been enough to perceptibly the rate of global warming.
Piers Maxwell Forster, et al. – 02/05/2023, Earth System Science Data
Indicators of Global Climate Change 2022: Annual update of largescale indicators of the state of the climate system and the human influence
Abstract. Intergovernmental Panel on Climate Change (IPCC) assessments are the trusted source of scientific evidence for climate negotiations taking place under the United Nations Framework Convention on Climate Change (UNFCCC), including the first global stocktake under the Paris Agreement that will conclude at COP28 in December 2023. Evidence-based decision making needs to be informed by up-to-date and timely information on key indicators of the state of the climate system and of the human influence on the global climate system. However, successive IPCC reports are published at intervals of 5–10 years, creating potential for an information gap between report cycles.
We base this update on the assessment methods used in the IPCC Sixth Assessment Report (AR6) Working Group One (WGI) report, updating the monitoring datasets and to produce updated estimates for key climate indicators including emissions, greenhouse gas concentrations, radiative forcing, surface temperature changes, the Earth’s energy imbalance, warming attributed to human activities, the remaining carbon budget and estimates of global temperature extremes. The purpose of this effort, grounded in an open data, open science approach, is to make annually updated reliable global climate indicators available in the public domain (https://doi.org/10.5281/zenodo.7883758, Smith et al., 2023). As they are traceable and consistent with IPCC report methods, they can be trusted by all parties involved in UNFCCC negotiations and help convey wider understanding of the latest knowledge of the climate system and its direction of travel.
The indicators show that human induced warming reached 1.14 [0.9 to 1.4] °C over the 2013–2022 period and 1.26 [1.0 to 1.6] °C in 2022. Human induced warming is increasing at an unprecedented rate of over 0.2 °C per decade. This high rate of warming is caused by a combination of greenhouse gas emissions being at an all-time high of 57 ± 5.6 GtCO2e over the last decade, as well as reductions in the strength of aerosol cooling. Despite this, there are signs that emission levels are starting to stabilise, and we can hope that a continued series of these annual updates might track a real-world change of direction for the climate over this critical decade.
Read the complete article….
Some of the observations:
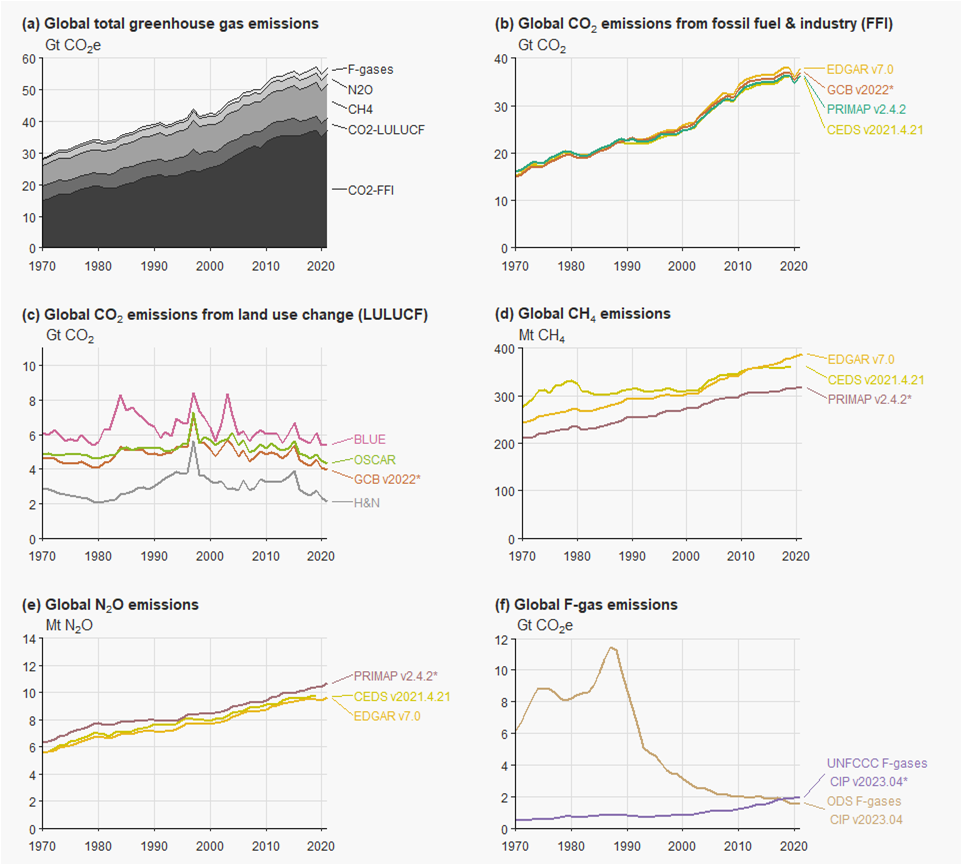
The first set of observations shows that most human carbon emissions have not slowed, although, although the slowing economy over COVID have somewhat slowed overall growth (although this appears to have resumed in 2022). The only area where have actually significantly slowed emissions is for regulated fluorinated gases (F-gas).
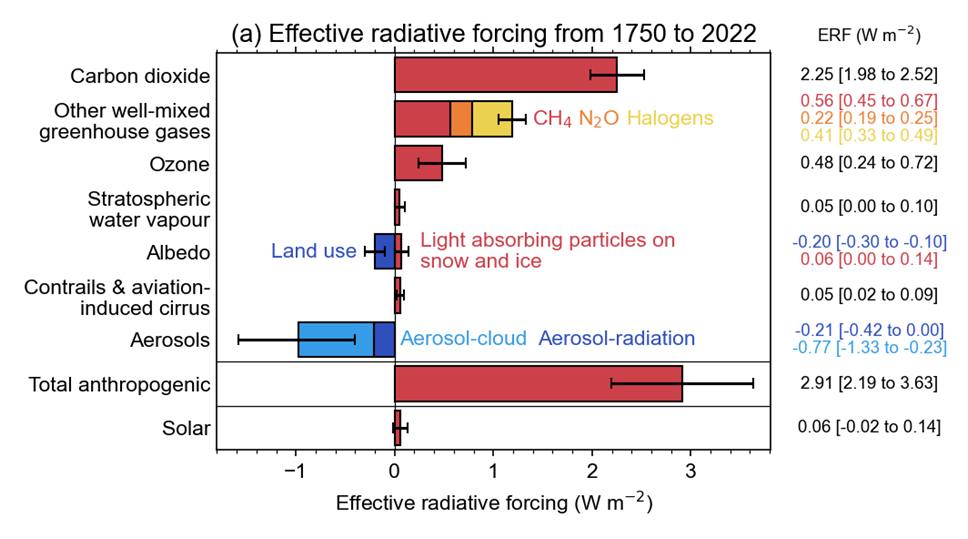
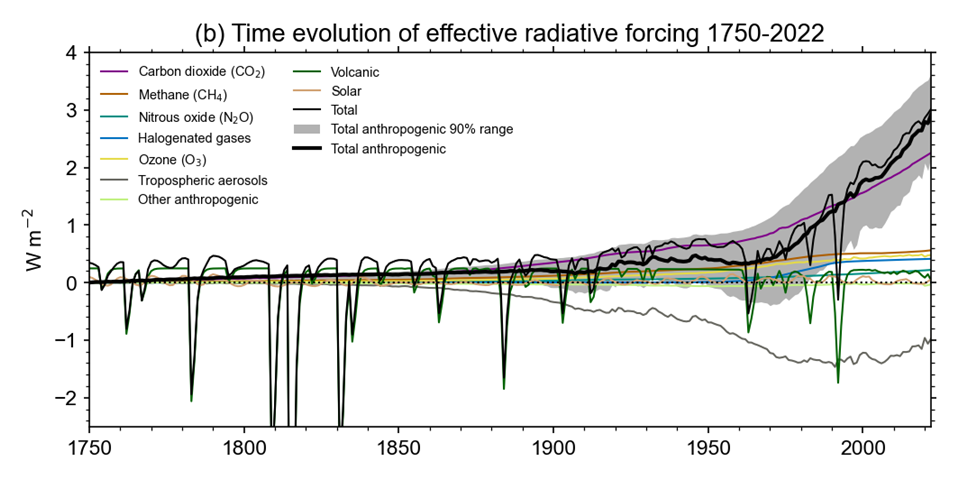
The next set of figures shows how effective the various gases in greenhouse layer in the atmosphere are at capturing solar radiation (i.e., “effective radiation forcing”). In 2a right facing bars represent a net positive forcing of higher temperatures, while the left facing bars represent the reflection of extra energy away from Earth. 2b shows a fairly abrupt increase in the forcing between 1960 and 1970, presumably due to the increasing annual rates of greenhouse gas emissions. Note: if the Earth is to have any chance to begin cooling the anthropogenic forcing (grey) needs to trend down, not to continue rising higher as it does here!
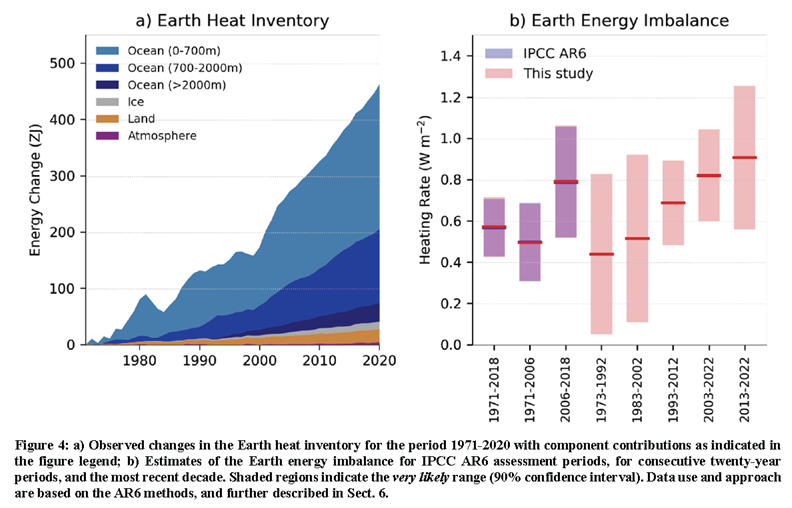
Because Earth currently suffers an imbalance between the solar energy it receives and what it radiates away to outer space as heat energy, the difference between energy received and energy radiated is stored as heat by raising the temperature of various components of planet’s mass (i.e., as the heat inventory). Figure 3a shows that the vast bulk is being stored at different water levels in the ocean, with virtually all of the remained represented by melted ice and the surface layer of soil. Again, if we are to even begin to reduce the rate of global warming, the graph of energy change must be changed to a down slope rather than the continuously rising one show here.
Figure 3b compares the IPCC’s estimates with the somewhat higher estimates presented in this paper.
Conclusion
There is absolutely no good news in the vast array of evidence assembled into these few graphs (assuming the work stands up to peer review, which it almost certainly will). Nothing humans have done to date has had a visible impact on the ominous trends into the climate crisis of the 6th global mass extinction in a ‘Hothouse Earth’ that will simply be too hot for many keystone species to survive physiologically. Beginning with Steffen et al’s, “Trajectories of the Earth System in the Anthropocene” and “Tripping down the road to Earth’s Hothouse Hell and Global Mass Extinction“, a series of articles in Climate Sentinel News explains that falling into the hothouse hell will be as easy as falling off a cliff.
As noted herein above, if we are to get off that road to Hell before it is too steep for that to be possible, we basically have to turn the graphs shown above upside down, so the trends are back towards where they were in the first half of the last century. We won’t be able to do this as long as our governments continue protecting and subsidizing the fossil fuel industries that are still making things worse from one year to the next. Basically our governments will have to work together and mobilize a global war against the climate emergency. Individually, as is the case in global war, we’ll probably have to accept rationing of critical or polluting resources and some curtailment of our usual freedoms to make things worse….
It will be hard, but consider this: It took us more about 100 years from beginning in 1927 with 2 bn people and steampunk technology to accidentally warm the planet to its present state. Starting now, with 2023’s highly advanced and incredibly more powerful technologies and scientific knowledge, we should be able cool the planet back to a sustainable temperature.
The first step has to be fixing our political systems so they work for all humans rather than working to make a few vested special interests become insanely wealthy and powerful individuals at the expense of the planetary biosphere.
Featured Image:
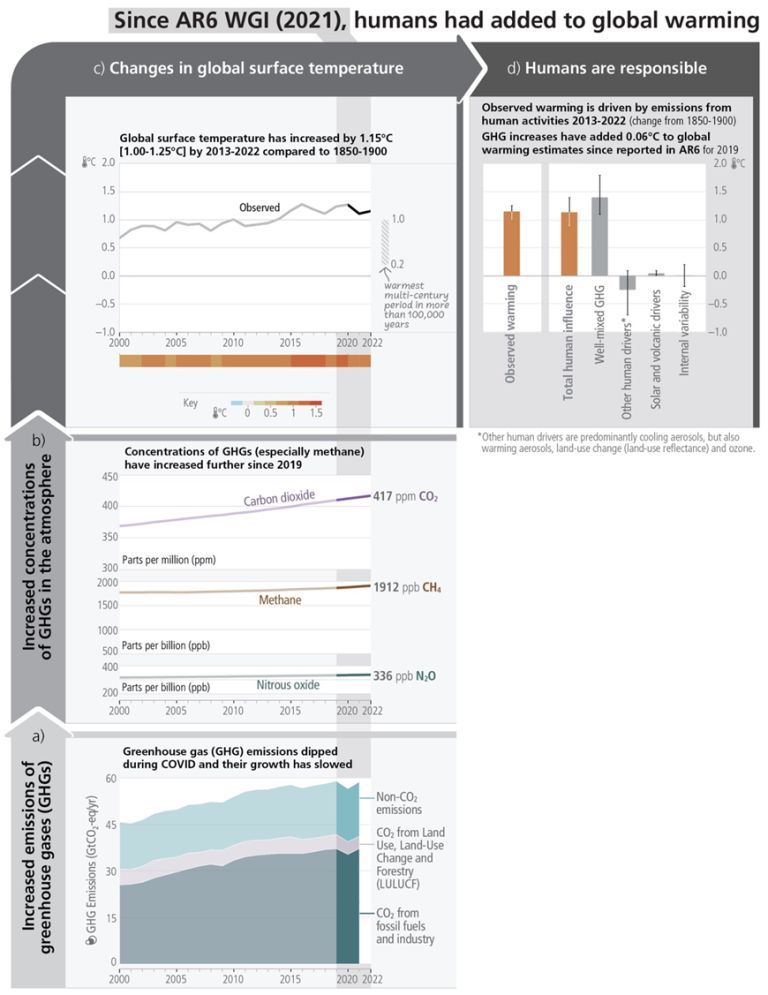
Summary from the Copernicus ESDD article bringing reported values from IPCC AR6 report up to date at the end of 2022. The causal chain from emissions to resulting warming of the climate system. Emissions of GHG have 1190 increased rapidly over recent decades (panel a). These emissions have led to increases in the atmospheric concentrations of several GHGs including the three major well-mixed GHGs (panel b). The global surface temperature (shown as annual anomalies from an 1850–1900 baseline) has increased by around 1.15°C since 1850–1900 (panel c). The human-induced warming estimate is a close match to the observed warming (panel d). Whiskers show 5% to 95% ranges. Figure is modified from AR6 SYR (Figure 2.1, Lee et al., 2023).