July 2022 Climate – still on road to extinction

Australia has a new government. Every month we fail to stop global warming is a month closer to global mass extinction. Still no visible progress towards solution.

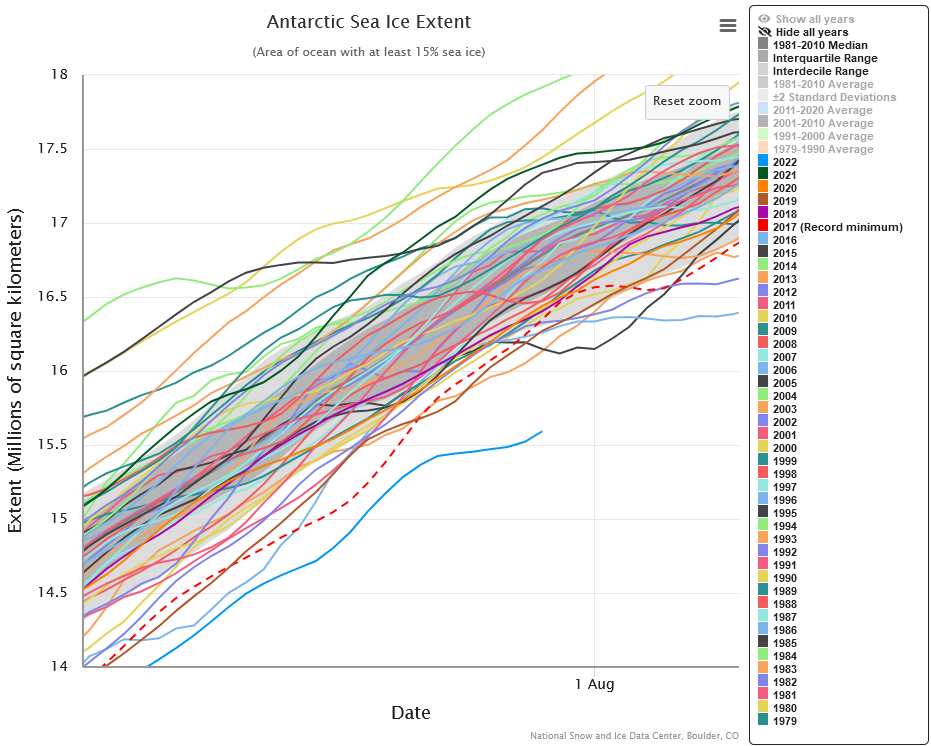
The graphic above downloaded today shows the current state of sea-ice surrounding the Antarctic continent. Despite what seems to be a cold winter in Victoria, its coverage indicated by the teal blue line in the chart is 530 km2 smaller than it has ever been before for this time of the year. There are many more indicators that the climate is still deteriorating towards making Earth uninhabitable for its present life forms (including humans!) at an accelerating rate.
The following news items underline the dangers this represents for humans.

by Bob Hensen, 17/07/2022 in Eye on the Storm, Yale Climate Connections
Horrific heat descends upon Western Europe: 104°F in London
Dozens of all-time record highs melted on Monday and Tuesday under a searing, deadly European heat wave that has caused at least 1,169 heat-related deaths in Spain and Portugal. The heat wave has also brought the hottest day on record for many locations in France and the hottest temperatures — by far — ever observed in the United Kingdom.
The record-smashing heat in Europe’s normally mild, maritime northwest corner was eerily comparable to the astounding heat wave in the U.S. Pacific Northwest and far southwest Canada in June 2021. The latter was found to have been “virtually impossible” without human-produced climate change.
By 9 a.m. GMT on Tuesday, July 19, London’s Heathrow Airport had already surged past 90°F, and at 12:50 p.m., the airport’s official observing site for London recorded what, if confirmed, would be the hottest temperature in London history: 40.2 degrees Celsius, or 104.4 degrees Fahrenheit.
…
Read the complete article
:extract_focal()/https%3A%2F%2Fi.guim.co.uk%2Fimg%2Fmedia%2F65e9cae2687f5a39dc83141bc1ab8061c2525f8e%2F0_234_5150_3090%2Fmaster%2F5150.jpg%3Fwidth%3D1300%26quality%3D85%26fit%3Dmax%26s%3Dc3ce63aa3e7c83e205aece9aed06d2be)
by Robin McKie, 31/07/2022 in the Guardian
‘Soon it will be unrecognisable’: total climate meltdown cannot be stopped, says expert
Blistering heatwaves are just the start. We must accept how bad things are before we can head off global catastrophe, according to a leading UK scientistRobin McKie.
The publication of Bill McGuire’s latest book, Hothouse Earth, could not be more timely. Appearing in the shops this week, it will be perused by sweltering customers who have just endured record high temperatures across the UK and now face the prospect of weeks of drought to add to their discomfort.
And this is just the beginning, insists McGuire, who is emeritus professor of geophysical and climate hazards at University College London. As he makes clear in his uncompromising depiction of the coming climatic catastrophe, we have – for far too long – ignored explicit warnings that rising carbon emissions are dangerously heating the Earth. Now we are going to pay the price for our complacence in the form of storms, floods, droughts and heatwaves that will easily surpass current extremes.
…
Read the complete article
In the run-up to the May 21st Federal Election, I posted many more articles documenting the increasing risk of mass extinction that humans face if we do not stop and reverse the runaway acceleration that is flipping our global climate to the Hothouse Earth state.
In the Election Australians replaced the Liberal/National COALition with a more climate friendly Labor government supported by an extensive cross-bench of climate-friendly independents (‘teals‘) and Greens.
The Government has very little time (if any – see the article above) to act to stop carbon emissions and to do what we can to remove some of the past excesses from the atmosphere.
TIME IS OF THE ESSENCE!
Featured image:
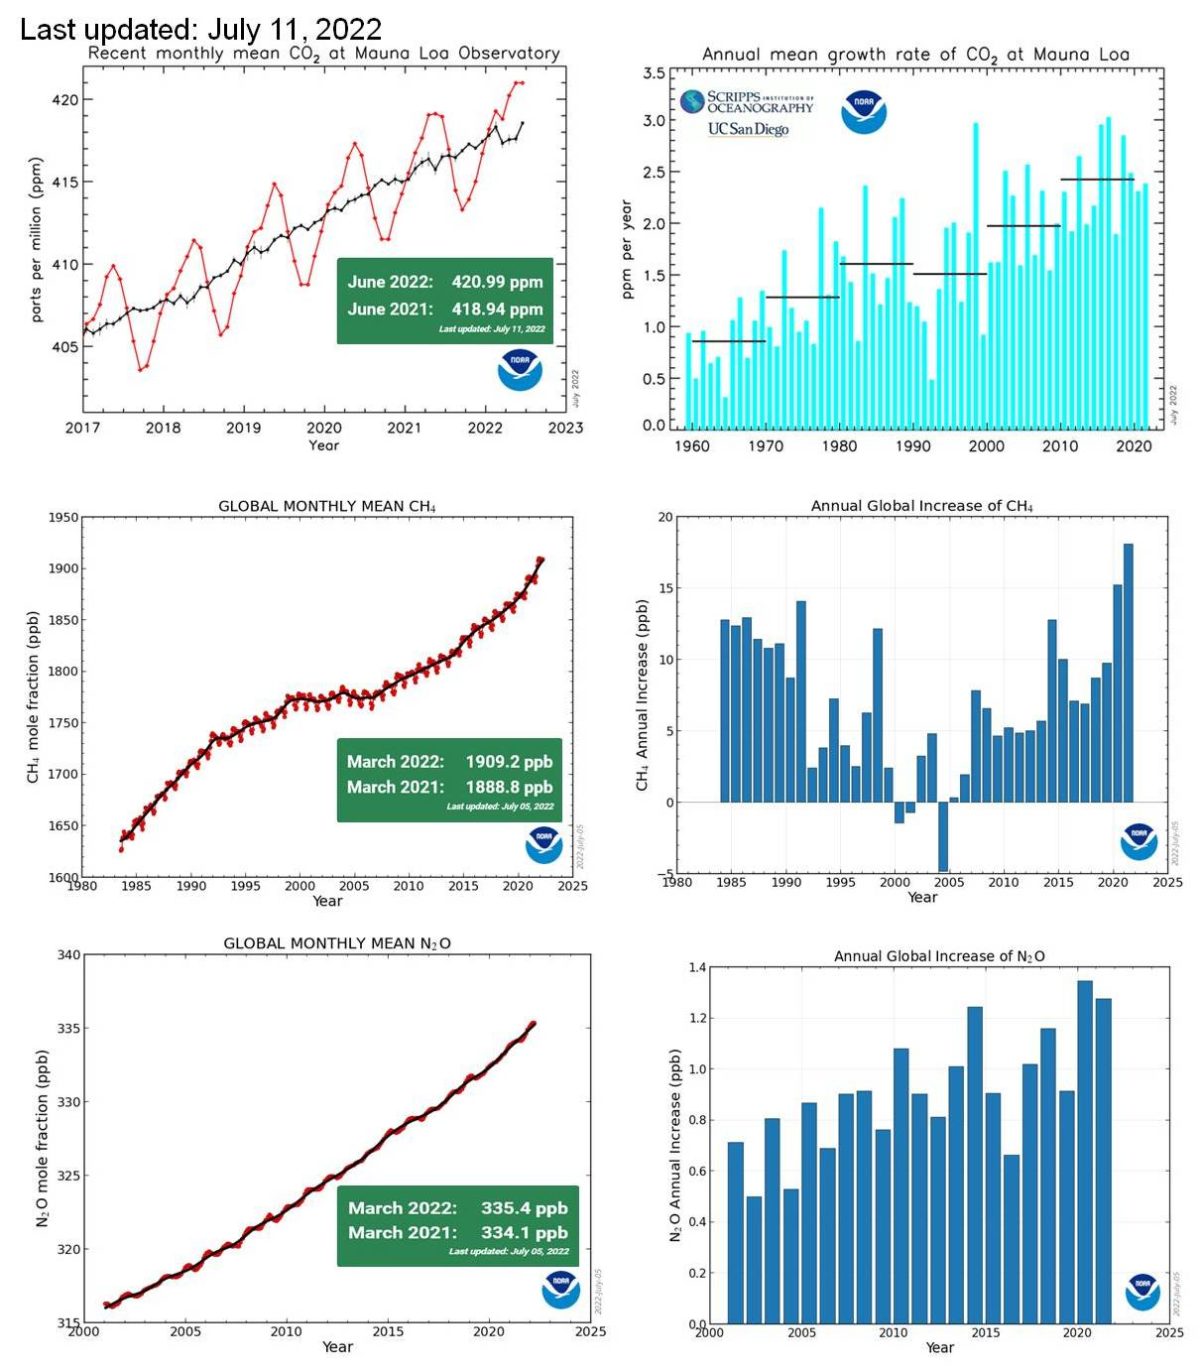
Time series graphs showing the variation in the three most important greenhouse gases as observed and recorded by the US National Oceanic and Atmospheric Administration, Global Monitoring Laboratory at Mauna Loa Observatory, Hawaii.
The carbon dioxide data on Mauna Loa shown in the top row constitute the longest record of direct measurements of CO2 in the atmosphere. They were started by C. David Keeling of the Scripps Institution of Oceanography in March of 1958 at a facility of the National Oceanic and Atmospheric Administration [Keeling, 1976]. The first graph shows atmospheric CO2 concentrations over the last five complete years of the Mauna Loa CO2 record plus the current year. The second graph shows annual mean CO2 growth rates for Mauna Loa. In the graph, decadal averages of the growth rate are also plotted, as horizontal lines for 1960 through 1969, 1970 through 1979, and so on.
The middle row charts the growth of atmospheric methane: the first graph shows the full NOAA time-series starting in 1983, The red circles are globally averaged monthly mean values centered on the middle of each month. The black line and squares show the long-term trend (in principle, similar to a 12-month running mean) where the average seasonal cycle has been removed.The second graph summarizes annual increases in atmospheric CH4 based on globally averaged marine surface data.
The bottom row charts the growth of atmospheric N2O (Nitrous oxide) beginning in 2001, when NOAA began to have confidence in the data. Values for the last year are preliminary pending recalibrations of standard gases and other quality control steps. The second graph plots the annual increase in atmospheric N2O in a given year, i.e., the increase in its abundance (mole fraction) from January 1 in that year to January 1 of the next year, after the seasonal cycle has been removed (as shown by the black lines in the first figure). It represents the sum of all N2O added to, and removed from, the atmosphere during the year by human activities and natural processes.
As yet, there is NO evidence that any of these values are beginning to stop increasing, let alone decrease, as the result of any human actions.