If we don’t reverse the climate system’s growing energy imbalance it will soon drive us over the lethal fall into global mass extinction
ALL the global climate indicators are at or near all-time records so extreme that by September last year staid climate professionals have called the readings “gobsmackingly bananas.” — a phrase that is now in common usage in the climate science community. To some, the readings spell doom is nigh. But, here, i’m with the Guardian’s Fiona Katsaukas and her friend in the green shirt.
These gobsmacking records bear witness that Earth’s climate system has shifted into a new kind of rapidly evolving climate regime that is not encompassed or anticipated by existing climate forecasting models (at least not before 2050…). Every month since September has set new, still more extreme records.ALL the global climate indicators are at or near all-time records so extreme that by September last year staid climate professionals have called the readings “gobsmackingly bananas.” — a phrase that is now in common usage in the climate science community. These records bear witness that Earth’s climate system has shifted into a new kind of rapidly evolving climate regime that is not encompassed or anticipated by existing climate forecasting models (at least not before 2050…). Every month since September has set new, still more extreme records.
In 1985, the renowned planetary systems scientist and cosmologist (also one of the best communicators of hard science to the public the world has known), Karl Sagan addressed the U.S. Senate Environment and Public Works Subcommittee on Hazardous Wastes and Toxic Substances hearing on the greenhouse effect to explain the then scientific understanding of global warming. The 17 minute video on YouTube of his speech is extracted here by C-SPAN. C-SPAN also has the full 2 hour, 24 min video of the hearing. I mention this to triply underline the fact that the science of global warming and its consequences was already clearly understood four decades ago. The only fault in Sagan’s exposition is that the predicted dire consequences are happening sooner than he anticipated. This is still a common problem in climate science today where most climatologists trained in maths or physics still fail to appreciate the importance of fundamental non-linearity and chaos of complex dynamical systems like climate. The existential emergency Sagan predicted for the latter half of the 21st Century has already started now.
Because the [greenhouse] effects occupy more than a human generation there is a tendency to say that they are not our problem. Of course, then nobody’s problem, not on my tour of duty, not on my term of office… It’s something for the next century. Let the next century worry about it. But the problem is that the greenhouse effect is one of them which have long time constants. If you don’t worry about it now, it’s too late later on; and so in this issue, as in so many other issues, we are passing on extremely grave problems for our children when the time to solve the problems if they can be solved at all is now.
Carl Sagan, 1985, transcribed from C-SPAN video [2:30-3:15]
Today’s screams heard now from continually breaking climate records are the realities anticipated 39 years ago in this address;
In my “Feb. 2024 climate extremes” report (published March 12) I review the records as they were being broken in the February peak of the global climate cycle. I am currently trying to finish an update on the first anniversary of setting continuous daily record high global sea surface temperatures. detailing the piling up energy flows through the climate system (as described by Sagan) from the time solar energy is absorbed in the climate system and is eventually emitted back to space in the form of infrared emissions leaving the Earth. I have posted the current state of the first part, “Considering the first anniversary of a new climate regime — Accelerating down the road to extinction in Earth’s Hothouse Hell?” in the Google Docs format (that everyone should be able to read). Completing this is difficult because many indicators are literally breaking records faster than I can write about them. The most important of these regularly breaking records is the daily average sea surface temperature (SST), which is the first place excess solar energy piles up in the climate system. On 9 May SST is still more than 0.1 °C above 2023’s 9 May record – the 423 day of continuous daily records. The graph below focuses mainly on the part of the years where this year’s record is on top of last year’s. Note that Sagan also predicted rapidly rising sea levels. Today’s Washington Post describes how the southeastern US is currently being affected by this rise (probably because hot water is being backed up in the slowing Gulf Stream).
However, so people can see the evidence that is driving us here in @VoteClimateOne to do what we can to fight the emergency, I have also been posting to X-Twitter, and I include a couple of samples here:
If not this year, the next 1 or 2 years will see Kim Stanley Robinson's million-death heat wave: The Ministry for the Future (https://t.co/6ifnrqiIzP). If we ignore this emergency and fail to totally mobilize to reverse Earth's energy imbalance before society collapses, we'll… https://t.co/4eKQiB9Egypic.twitter.com/TBAblGHNtf
Copernicus offers no good news. Their news is amplified by a small sample from other sources. Global mass extinction (including us) is virtually certain unless we reverse the energy imbalance. However, given that humans created the climate crisis with 19th-century tech, we should… https://t.co/GxBU3LXd67pic.twitter.com/u9xdLI8iHI
As ever increasing numbers of climate scientists and aware commentators are crying out that it is time to sound the emergency alarms and urgently mobilize to fight the global emergency while there is still some chance that with our far greater knowledge and more powerful science than Sagan knew about (he suggested that by now it would be too late to stop the inevitable catastrophic end), it might still be possible for us reverse the solar energy imbalance that is rapidly driving our planet’s temperatures towards runaway feedbacks that will ensure global mass extinction is truly under way before the end of the 21st Century.
Another new fact in today’s in box hit me in the face. The record high rate of increase in CO₂ causing a majority the backup of the solar energy that is cooking us is still ACCELERATING UPWARDS at a record high RATE OF ACCELERATION. To me this suggests that runaway warming driven by positive feedbacks with temperature has well and truly started. ‘Natural’ emissions are already coming out of the ground, permafrost, wetlands, forests, and oceans faster than we are reducing fossil fuel emissions.
I’m like the girl in the green shirt in Katsaukas’s cartoon. I think it is well and truly time to sound all the emergency alarms and start total global mobilization to fight the crisis. My knowledge and experience tell me that if enough of us are willing to accept the reality of the danger and work together as a disciplined emergency force, we have sufficient knowledge and technological prowess to turn off the road to extinction and find some way to sustain at least some of the living world we know today.
Born in 1939, I’m old enough to remember living in a blacked out house in Los Angeles, and then the successful ending of WWII in 1945 little more than 4 years after America mobilized and joined the war at the end of 1941. At least in 1941-42 Americans managed the kind of mobilization we need today. I think we might still be able to defeat the runaway warming enemy if we start soon enough and fight hard enough to find a place in a still sustainable biosphere. On the other hand, I’m as close to certain that if continue to avoid looking at the grim and (for some) terrifying reality in hopes of continuing with business as usual, we will be burning up in the midst of the worst global mass extinction (i.e., even worse than the End Permian extinction ~ 250 million years ago).
As well as learning about global mass extinction when I learned to read from my father’s university textbooks in geology and paleontology, I grew up in navy towns started university as a pre-engineering student before changing my major to zoology and earning my PhD in evolutionary biology as well as teaching a variety of genetic, organismic, systems and population biology courses. I also worked professionally as a radiation ecologist and for the last 17 years before ‘retiring’ I designed a variety of documentation and knowledge management systems for Australia’s then largest defense engineering company. There, my systems helped ensure the on-time, on-budget completion of the ~7 billion $AU ANZAC Ship Project. (This is one of the very few large defense projects in world history that did not end up years overdue and billions of dollars of cost overruns, thanks in good part to systems I designed specifically to solve the kinds of management and engineering change issues that defeat most large defense projects). Finally in retirement I have spent some 15 years researching and writing on the coevolution of humans and our technologies prior to deciding that doing what I could to address the climate crisis was far more important than finishing a book for a society doing nothing to save itself from extinction.
In @VoteClimateOne.org we have thought a lot about what we can do to help the mobilization. It is clear that most governments in the world today are being run by fools, useful idiots, or puppets owned and led by already insanely rich fossil fuel and other special interests will do or say almost anything to gather more wealth. Political party discipline means that a majority government can be controlled by a handful of ‘strong’ party members and functionaries in leadership roles. For example, in Australia, the supposedly ‘climate friendly’ Labor majority government has just demonstrated its fealty to its puppet masters over effective climate action.
@VoteClimateOne.org has a two-pronged approach to try to change governments into supporters and even leaders of the climate emergency mobilization effort.
Given how urgent the need for action is, we hope to convince the puppets and other blockers that climate action is far more important and urgent than whatever benefits they gain from catering to the desires of their patrons and masters. However, this will take a massive effort – much more than just supplying truthful information that is easily ignored or actively denied. Minds might be changed if enough people piled on each and every recalcitrant parliamentarian – but this would take the concerted action of a large number of climate and environment action groups that has to this point not been forthcoming.
The other prong in the spear, is to actually replace enough of the recalcitrant parliamentarians with progressive community representatives or small party members who truly understand and accept the crisis and the need for action; and who are willing to put in the effort to get elected — to prevent either major party from forming a majority government. Not only will there be more sensible and effective parliamentarians, but any party forming government will have to listen to and compromise with genuine community representatives to do anything, even if this requires them to mobilize an effective climate action.
Our home page, ACT NOW, and TRAFFIC LIGHT VOTING explain how this all works, and provides examples of how we have addressed past elections. Hopefully all voters will have the chance to see and think about what these pages have to offer, and inform their voting decisions with the climate crisis in mind. As elections approach, CLIMATE SENTINEL NEWS will be providing frequent updates on the state of the climate and relevant political news.
Our grandchildren tell us all to “vote climate one” so they can have a happy future rather than the descent into Earth’s hothouse hell (like Sagan and most climate scientists until the last few months, the authors of the referenced paper have overestimated just how much time we have left for effective action).
WE MUST BEGIN ACTION NOW!
Views expressed in this post are those of its author(s), not necessarily all Vote Climate One members.
On Saturday the Sea Surface Temperature (SST) was less than 0.1 °C below last year’s record set in August. Traditionally the global peak temperature for the year is reached in March. This year will probably be well and truly off this chart, yet humans are still burning fossil fuels at an increasing rate driving us ever faster towards global mass extinction in runaway warming as polar permafrosts and retreating ice-sheets release vast stores of soil carbon as methane and CO2.
Note that about 90% of the excess solar energy absorbed by our planet goes into the upper layers of the oceans before being redistributed via increased atmospheric humidity and heat to fuel increasingly extreme and lethal climates and weather events.
The only hope our species has to stop this apocalypse is to reverse greenhouse emissions (stop new emissions and ‘draw down’ and sequester some of the existing excess) and reflect more solar energy away from Planet Earth.
Isn’t it time we made our governments work towards this rather than increasing the obscene profits of their mates and patrons in the fossil fuel industries?
If you want more evidence in favor of this choice, please read my past posts on Climate Sentinel News. As well as using your vote effectively, Vote Climate One suggests a number of things you can do between elections to pressurize your governments to work with you (rather than against) to solve the climate emergency.
What’s this article about, and why is the date important?
As I write this, the average climate for our WHOLE PLANET is changing so freaking fast we can see visibly measurable changes in the averages from one day to the next!
The sudden speed up of changes in several climate indicators at the same time suggests that we may be crossing a critical tipping point in the complex interactions of important temperature related feedbacks controlling the behavior of Earth’s Climate System, as shown in the Featured Image. The speed-up is highlighted by the fact that the average air temperature 2 meters above the surface of our planet is at an all time record (and especially in the satellite era beginning in 1979). These changes will affect the whole 8,000,000,000+ humans and alive today along with all other life on the planet. The charts and maps presented here graphically illustrate measurements of important climate variables up to the last 1 to 4 days.
Fig. 1. ClimateReanalyzer’s Time Series plotting of Earth’s global average temperature at 2 meters above the surface from the NCEP Climate Forecast System (CFS) version 2 (April 2011 – present) and CFS Reanalysis (January 1979 – March 2011). CFS/CFSR is a numerical climate/weather modeling framework that ingests surface, radiosonde, and satellite observations to estimate the state of the atmosphere at hourly time resolution onward from 1 January 1979. The horizontal gridcell resolution is 0.5°x0.5° (~ 55km at 45°N). The time series chart displays area-weighted means for the selected domain. For example, if World is selected, then each daily temperature value on the chart represents the average of all gridcells 90°S–90°N, 0–360°E and accounts for the convergence of longitudes at the poles.
Again, every day since July 3 has been hotter than any maximum temperature recorded for any prior year back to 1979 when these records were compiled.
@EliotJacobson on Twitter shows this data a bit more legibly. The first record high was on 3 July, and daily average temperatures have remained in annual record high regions for a total of 12 ! continuous days through 14 July. The record is now 21 days!
Fig. 2. Progression of global temperatures higher than all time record temperatures back to 1979. ref. Eliot Jacobson.
The time gap between the instants of measurement depicted in the plots and charts and when they were printed are due to time delays between:
automatically recording millions of readings from hundreds of thousands of networked physical sensors and more millions of readings from remote sensors on a plethora of artificial satellites whizzing around our revolving planet several times a day (“Intensity of observation”, below, illustrates just how comprehensive the sensor network is);
accumulating and assembling the recorded data over the world-wide communications network;
proofing, processing and tabulating the received data on the world’s largest supercomputers; reanalyzing and plotting the observations in the form of charts and graphs comprehensible to humans;
publishing and publishing these outputs onto the public web, where they are accessible to anyone with a computer and the knowledge to find and understand the representations.
Based on the most recent measurements, the ongoing climate changes are accelerating in directions and speeds that will inevitably be lethal to the human and many other species within another century, more or less, if the changes are not stopped and reversed. These changes are a direct consequence of an unplanned experiment that humans began around 1½ centuries ago to burn geologically significant quantities of fossil carbon (e.g., coal, oil, ‘natural’ gas) into usable energy and greenhouse gases trapping an ever growing proportion of the total solar energy striking Planet Earth.
However, some of the combustion energy released by burning fossil carbon has also fueled an exponential growth of knowledge and technology able to produce the I am showing here. These plots provide the evidence our experiment is changing our global climate system to a state that will have existentially catastrophic consequences for Earth’s complex forms of life. This Hellish state is known as “Hothouse Earth“.
This fact that we now have the tools to actually see the evidence of our likely doom gives me some hope that our still exponentially improving technology may also provide us with the ability to stop further damage caused by our rogue experiment and repair enough of the damage already caused, to allow our species to continue evolving into the foreseeable future.
This raises the unavoidable and fraught question: Do we humans have the political will and capability to marshal and mobilize our technologies to engineer solutions that will allow us to avoid the abyss? This is the single most important issue facing the world today. If we don’t solve it, no other issue matters because — before long — no one will be left to worry about it.
Problematically, the world’s governments are dominated by puppets of the fossil fuel industry and related interests. They are doing as much as they can to PREVENT, DELAY, or MINIMIZE any actions that might hamper fossil fuel’s greed and short term interests for the world to burn yet more fuel. Hoping that we humans can solve this single, most important issue, VoteClimateOne is working to revolutionize our governments by replacing or changing parliamentary puppets to prioritize actions to solve the climate crisis first. Also, I am writing articles such as this to demonstrate and explain why this revolution is so urgent and necessary.
To demonstrate just how rapidly we are currently moving down the road to doom in what will be Earth’s Hothouse Hell, this article will be updated at least once a week until there is evidence of a downward trend to safer readings. We are certainly not seeing them yet!
Measuring progress towards existential catastrophe on Hothouse Earth
The world’s polar regions are critical. Ice and snow covering land and ocean reflects around 90% of the solar energy striking it. As temperature rises, more of the frozen water melts, allowing the exposed earth and water to absorb a much greater proportion of the solar energy during 24 hour-long polar polar daylight (open ocean absorbs ~94% of the energy striking it) , causing polar and global temperatures to rise in a potentially accelerating feedback cycle. In the animated graphic below, this process is clearly visible since the mid 1930s. This particular cycle won’t be broken until the ice is essentially all melted. By then there are several other feedbacks that will likely be in full swing.
Fig. 3. Zonal-mean (averaged over longitude) temperature anomalies for each year from 1900 to 2022. The x-axis is latitude (not scaled by distance), and the y-axis is the temperature anomaly. Data is from Berkeley Earth Surface Temperatures (BEST; http://berkeleyearth.org/data/) using a reference period of 1951-1980. (Zachary Labe 2023. Climate Indicators.
Ocean measurements are critical
Because most humans live on continental land masses, immersed in the atmosphere, most climatologists are primarily concerned with what goes on in the atmosphere. However, because water covers some 70% of our planet’s surface and because of water’s physical properties, around 90% of the excess solar energy striking Earth is absorbed in the World Ocean. Heat is then transported around the planet in currents and is available to be released to drive climate. See belowfor explanations of how the major heat engines driving Earth’s Climate System interact and work.
Fig. 4. Growing heat content held by our warming Ocean Current to Feb. 2023 (NOAA data)
Because these climate ‘engines’ are complex dynamical systems with many interacting components, where the interactions are often non-linear and sometimes even chaotic (in a mathematical sense their behavior is inherently unpredictable to any statistically define degree. Positive feedbacks in such systems can be potentially destructive because they lead to exponentially growing changes that lead to system breakdown (because infinity is impossible in the real world). Mathematical modeling of the interactions of small sets of variables can provide an appreciation of how such breakdowns may occur. Systems engineering as practiced in large defence engineering projects is based around a MilStd known as Failure Modes Effects and Criticality Analysis (FMECA) to identify such kinds of failure modes in order to engineer system solutions mitigate or totally avoid circumstances where they might arise.
The charts and maps below show how some measures of the behavior of Global Climate System have been behaving over the last few months and days. I consider these to be critical because they are likely to be evolved in the kinds of positive feedbacks that can grow exponentially to cause systems failure or collapse.
A definition
Many of the charts represent values of particular variables averaged over the surface of the whole Earth (or some specified region) at a specified point or interval of time. Most maps use colors to indicate the value of a specified variable at a specified point or averaged over an interval of time. In most such cases these measures are presented in the form of “anomalies”. An anomaly is the difference between the particular measurement and the long-term ‘baseline’ average for that measure on that day or interval of the year. For example, the graph immediately below uses a 30 year average (from 1971-2000) for its baseline average. Anomaly plots are particularly useful to highlight changes taking place over time.
Critical Variables
Global Sea-Surface Temperature
The global sea surface temperature anomaly broke into all-time record for the day of the year around 15 March, and by the end of March it was an all time record high since 1981, 0.1 °C above the previous record set on 6 March 2015. This value is so extreme, that along with other variables noted below it suggests that the average rate of global warming observed over the last few decades may be shifting into a new regime where the rate of ocean-surface warming is skyrocketing. As at 29 June it is still 0.2 °C above the previous record for that date – with an uptick after 4 days of downward trend).
Fig. 5a. Time series visualizations of daily mean Sea Surface Temperature (SST) up to 23 July. Data from NOAA Optimum Interpolation SST (OISST) version 2.1. OISST is a 0.25°x0.25° gridded dataset that provides estimates of temperature based on a blend of satellite, ship, and buoy observations. The datset spans 1 January 1982 to present with a 1 to 2-day lag from the current day. Data are preliminary for about two weeks until a finalized product is posted by NOAA. This status is identified on the maps by “[preliminary]” appearing in the title, and applies to the time series as well. SST anomalies, which are included in the OISST dataset, are based on 1971–2000 climatology. The time series chart displays area-weighted means for the selected domain. For example, if World 60S-60N is selected, then each daily SST value on the chart represents the average of all ocean gridcells between 60°S and 60°N across all longitudes, and accounts for the convergence of longitudes at the poles. Hide or display individual time series by clicking the year below the chart; Hide All and Show All buttons are at the chart lower right. The map can be switched between SST and SST anomaly by clicking the toggle button at the map top-left. A sea ice mask is applied to the SST and anomaly maps for gridcells where ice concentration is >= 50%
Fig. 5b. Sea Surface Temperature Anomalies. Significant positive heat anomalies exist in normal sinking zones for cooled salty water.Fig. 5c. Sea Surface Temperatures. ClimateReanalyzer’s SST current SST data can be accessed here.
The North Atlantic’s fever is still has a fever is still growing on 13 July. Warmer than usual water flooding up around southern Greenland right up to the edge of the melting sea-ice, with what looks like cold fresh meltwater flowing out of Baffin Bay along the west side.
Note that the ocean surface temperature is 5 °C right up to the edge of the sea ice, with warmer water than that intruding nearly as far as the ice front in Baffin Bay. The cooler (purple shaded) water flowing down close to the Canadian shoreline has been pushed back into Baffin Bay (between Greenland and Canada. There is no sign in either of the SST maps of ‘cool spots’ which are thought to be the sources of the ‘salty cold water’ forming the deep water branches of the thermohaline circulation in the North Atlantic. In fact, the ocean in these areas seems to be 10-15 °C. Northern Hemisphere ice extents are low for the date but not yet near record lows, unlike the South!
Fig. 6a.Record Sea Surface temperature in North Atlantic for July 23, only 0.1 °C short of the previous all-time record, set more than a month later last year.Fig 6b.Sea Surface Temperature distribution in North Atlantic for 23 July 2023.
Global Sea Ice
Antarctic Sea ice
Around the same time the global average sea-surface temperature began to skyrocket, the rate of sea-ice formation around Antarctica slowed — as would be expected if the surrounding ocean was becoming progressively warmer than has ever before been the case for this time of the year.
Fig. 7a. Time series showing he full annual cycle of the melting and freezing of sea ice around Antarctica from Jan 1979 up to 23 July. Seaice.visuals.Earth.
Fig 7b. Time series showing daily anomalies in the extent of sea ice around Antarctica from Jan 1979 up to 23 July highlighting the substantial slowing of freezing. Note differences in scale to 5a. The deviation is 7.12σ. Dark green shading = 3 sigma, light green = 5 sigma.
Sea ice extent anomaly is strongest in the Weddell and Bellingshausen Sea region. With the Indian Ocean region also showing what looks like the beginning of a strong deviation. The illustration is from the article from the Australian Antarctic Program Partnership that discusses the significance of the anomaly.
Fig. 8. Monthly anomalies in Antarctic sea-ice concentration and sea-surface temperatures for June 2023, showing more negative (i.e., reduced ice freezing) than positive anomalies. Note deep red is -70%, and lack of sea ice in Bellingshausen Sea (west of Antarctic Peninsula). Even though Antarctica is in mid-freeze season, Bellingshausen Sea is almost at summer sea-ice levels. (Source: interactive chart accessed at nilas.org). see also Polar View.
Sea ice extent anomaly is strongest in the Weddell Sea (area above the Antarctic Peninsula) and Bellingshausen Sea region (indicated by the arrow above). With the Indian Ocean region also showing what looks like the beginning of a strong deviation. See especially the article from the Australian Antarctic Program Partnership that discusses the significance of the anomaly.
Fig. 9.Color-coded animation displaying the last 2 weeks of the daily sea ice concentrations. Sea ice concentration is the percent areal coverage of ice within the data element (grid cell) in the Southern Hemisphere. These images use data from the AMSR-E/AMSR2 Unified Level-3 12.5 km product. The different shades of gray over land indicate the land elevation with the lightest gray being the highest elevation.
This graphic from NASA Earth Science’s Current State of Sea Ice Cover shows the slow rate of ice formation around Antarctica. The almost complete absence of ice in the Bellingshausen Sea is remarkable. It is only now in the last few days that it is beginning to ice over. There is also significant open water within the extent of the sea ice.
Nature. (2017). Garabato et al. 9 Feb (2017). Vigorous lateral export of the meltwater outflow from beneath an Antarctic ice shelf. 10.1038/nature20825. Free PDF
Nature 29 Mar (2023). Qian Li, et al.. Abyssal ocean overturning slowdown and warming driven by Antarctic meltwater. 10.1038/s41586-023-05762-w [paywalled!]
Nature Climate Change, 2 June (2023). Zhou et al. Slowdown of Antarctic Bottom Water export driven by climatic wind and sea-ice changes. https://doi.org/10.1038/s41558-023-01695-4.
So far, melting of the Arctic sea ice has not been particularly exceptional. With regard to sea-ice at both poles, it is also important to consider thickness and volume. Ice that is only a meter or two thick is accumulated over winter when there is no solar heating (sun largely or completely below the horizon) is normally only a year old. Solid ice reflects most of the solar energy heating it. However, the thinner the ice is, the faster it can melt as it begins to heat under the summer sun and possibly even rain(!), to say nothing of warm currents from the tropics. Around the North Pole, all of the bluish and purple ice shown in the map here can disappear fairly quickly as summer continues to leave open ocean to absorb most of the solar energy striking it that will delay freezing in the following winter.
Fig. 11. Thickness of Arctic Sea Ice for the month of July 2023. This is an animated reanalysis and forecast system developed by the US Naval Research Labs, based on the global database. It is one of several oceanographic data plotting visualizations for the Arctic (see System information). Presumably in the light lavender areas the remaining ice could disappear in a few days of warm temperatures. See also Danish Arctic Research Institution’s Polar Portal for current info on the northern polar region.
Arctic sea ice beginning to thin and break up as far as the North Pole. Shades of blue within the ice cap show regions where less than 100 percent of the quadrangle are covered by ice. (Either due to exposed ocean water or puddles of rain/melt-water on top of the ice). In either case this is bad news for reflectivity of the ice cap.
Fig. 12. Color-coded animation displaying the last 2 weeks from June 25 of the daily sea ice concentrations in the Northern Hemisphere. These images use data from the AMSR-E/AMSR2 Unified Level-3 12.5 km product. The different shades of gray over land indicate the land elevation with the lightest gray being the highest elevation. From Current State of Sea Ice Cover
Atmosphere and land
Jet streams
Fig. 13a. Jet streams in the Southern Hemisphere.
Fig. 13b. Jet streams in the Northern Hemisphere
Fig. 13c. Global distribution of jet streams.
Jet streams are the atmospheric equivalents to major ocean currents that influence all of the other weather systems on the planet to keep them moving latitudinally around the planet. They are driven by temperature differences between the tropical and polar regions of the Earth and Coreolus effects as winds blow towards or away from the poles. Where the temperature differs strongly between poles and equator the jet streams are well organized with high winds. As temperature differences decrease so do the wind speeds, and the streams begin to slowly meander until they may become quite chaotic. Winds less than 60 kt are not considered to be jet streams. At present there has been very little change in the pattern that existed a week and a half ago (as shown in Fig 8b) there are virtually NO jet streams at all in the Northern Hemisphere, and the winds that do exist are completely chaotic — a highly unusual situation. This leaves major heat domes basically motionless, facilitating the buildup and maintenance of record high temperatures.
Fig. 14. The taiga biome is found throughout the high northern latitudes, between the tundra and the temperate forest, from about 50°N to 70°N, but with considerable regional variation. (Wikipedia).
Some of the greatest impacts of the disrupted jet stream system are seen over the boreal/taiga forest zones of North America and Eurasia. Arctic tundra and much of the taiga is underlain by carbon rich peat and peaty permafrost soils that are thought to contain at least 2x more carbon than the current amount of carbon in our atmosphere. Depending on circumstances, significant amounts of that carbon can be released in the form of methane, that has more than 80x the greenhouse potential of CO2 over the first 20 years of emission (20x over 100 years). Aside from greenhouse gases emitted by the burning forests and soils, significant amounts of the black carbon ‘ash’ will settle on Arctic snow and ice – speeding their melting when exposed to sunlight. Collectively, at least over the first few years following wildfire, the burning will provide yet another powerful positive feedback to speed snow and ice melting. Over a longer term, re-vegetation will sequester some atmospheric CO2, but only if the forest is not burned again.
Fig. 15.By the end of June Canadian wildfires mainly in boreal forests have burned more area before the fire season is half over than in the previous record for a full year in 1989. Phys Org (30 June 2023). As at 24 July 11,582,531 ha have burned. The graph here, sourced from Natural Resources Canada gives the status as at 15 July. This is literally ‘off the chart’, and represents about 1.1% of Canada’s total land area.
If the burning releases more greenhouse emissions than can readily be recaptured by re-vegetating forests. These emissions may more than replace any emissions humans cut — providing positive feedback to drive global temperatures still higher. This is one of several crucial tipping points associated with stopping the thermohaline circulation.
Intensity of observation
A hint to how little you can trust claims of reality denying trolls, puppets, and the like, is provided by the number monitoring points that physically monitor the atmosphere at those locations around the surface of the planet we live on used PER DAY.
Atmospheric monitoring
The European Centre for Medium-Range Weather Forecasts (ECMWF) for the charts plotted on 6 July 2023 as shown below are based on measurements from 92,702 locations. Note 1: this map does not NOT include ocean monitoring points. Note 2: The DATA COLLECTED EVERY DAY by this web of sensors is available to, used, and interpreted by several different national and institutional climate monitoring centers. In other words, the conclusions are cross checked between different centers many times over. The charts above depict scientific facts, not hunches and personal opinions. For more detail on how the accuracy of the observations is controlled see ECMWF’s Monitoring of the observing system.
Fig. 19. The type and location of 92,702 separate observations used on 6 July 2023 between 3:00 and 9:00 PM for 6 hourly data coverage used by the ECMWF data assimilation system (4DVAR). Each plot shows the available data for a family of observations. The current day’s chart can be downloaded here. SYNOP refers to encoded information collected and transmitted every 6 hours by more than 7600 manned and unmanned meteorological stations and more than 2500 mobile stations around the world and is used for weather forecasting and climatic statistics. SHIP METAR is a format for reporting weather information. A METAR weather report is predominantly used by aircraft pilots, and by meteorologists, who use aggregated METAR information to assist in weather forecasting.
Oceanographic monitoring
Argo
Argo floats profiles physical properties of the surrounding water, minimally ocean temperature, salinity, pressure (i.e., depth). Each float operates on a 10 day cycle, spending most of the cycle ‘resting’ at an intermediate depth. On the 10th day it sinks to a specified depth and begins recording inputs from its sensors as it floats up to the surface. The standard float sinks to a depth of 2 km (2,000 m) and records all the way up to the surface, where it then determines its GPS position to within a few meters and messages a passing relay satellite with its location and profile data before sinking to its resting depth waiting for the next profile position. As shown on the world map here, for June 2023, shows the locations of 3849 profiles received over the month. Of these ~1,400 recorded the profile from 2 km deep in the ocean to the surface. Some floats are designed to sink to the bottom and thus record a profile for the full depth of the ocean. A few include several additional sensors to levels for things like acidity, oxygen, nitrate, light level, and some more I don’t recognize. The Argo system is really quite amazing.
Some even have ice sensors allowing them to operate even in ice-covered waters by warning if they might be fatally damaged by striking ice overhead. For these, if they sense ice, they’ll record the profile in memory, and drop back and rest until the next cycle (which may again prevent surfacing). These interrupted cycles will keep repeating until the float can safely surface — in which case all of the aborted profiles will be messaged to the satellite relay along with the current one (better late than never!)
Fig. 20. Argo floats operational in June 2023. For the latest data see Ocean Ops dashboard
And then there is a plethora of other ocean sensor systems. The full gamut of them shown next. The various different types are named in the legend. Collectively, on 26 June 2023, the ocean sensing system measuring in-situ variables includes 7973 ‘platforms’ (including the different kinds of Argo Floats) and results from 104 ‘cruises’ of ships ranging from specialized oceanographic vessels to fishing boats. Some of these non-Argo systems also record partial or complete (i.e., to the bottom) profiles.
Almost all of the data collected from the range of sensors is freely accessible via the public World Wide Web.
Fig. 21. Location of ocean sensor platforms.
Satellite remote sensing systems
As if the plethora of physical systems for directly measuring weather and climate is not enough. There is now a cloud of satellite-based remote sensing systems buzzing around our planet, making literally millions of observations every day of critical weather and climate variables. NASA EarthData’s What is remote sensing? gives a high level overview of some of the capabilities of these systems. You can be assured that the measurements made by the earth-based and space-based sensing systems are carefully cross calibrated to ensure the various systems are all working together towards a common view of the actual physical reality.
Major heat engine domains of the Earth System
Dynamic changes in the Universe through time are driven by spontaneous flows and transformations of energy from ‘sources’ at high potential to entropy and ‘sinks’ at lower potentials (e.g., water flowing down a hill). This flux can be used to drive other processes through a system of coupled interactions forming a thermodynamic system or heat engine. As governed by the universal physical Laws of Thermodynamics (especially the Second Law), as long as there is a potential difference between source and sink, the flux of energy between them will continue to spontaneously flow through the system/heat engine as long as long as the system’s net entropy production remains positive.
The ‘Earth System’ includes all the shell-like layered components of the planet from the edge of outer space to its center. The three main ones concerning us here from inside out are the geosphere, hydrosphere, and atmosphere. The biosphere formed in the interface between atmosphere and geosphere (on the planetary scale) is a microscopically thin turbulent layer of carbonaceous macromolecules and water combined with other elements and molecules exhibiting the properties of life. We humans form part of that biosphere.
The heat engines described here circulate masses of matter that transport heat energy from place to place within the Earth System.
Geosphere
The geosphere comprises Planet Earth’s, solid (‘rocky’) components. The geosphere’s heat engine is based on the geologically slow process of plate tectonics that drives continental drift.
Fig. 22. Geological heat engine at work. Mantle convection may be the main driver behind plate tectonics. Image via University of Sydney.
The plate tectonics engine is driven by the slow radioactive decay of unstable isotopes of elements such as potassium, uranium and thorium remaining from the formation of Earth some 4.5 billion years ago.
Enough heat has and is being generated by this decay to melt the planet’s core and heat and expand the overlying mantle rocks enough to make them less dense and plastic enough for them to form convection cells like you see in a pan of nearly boiling water. Hotter and less dense rocks float up towards Earth’s harder crust and spread out (carrying surface crust and even lighter continental rocks, i.e., ‘plates’) to become cool enough for gravitational force to pull the solidified plates back towards the molten core in subduction zones that also form oceanic trenches.
Heat transported from radioactive decay is released into the hydrosphere and atmosphere from conduction through the crust + hot springs and geysers; by molten basalt lava coming to the surface in oceanic and terrestrial spreading (‘rift zones’); and volcanoes associated with localized ‘hot spots of rising magma or with the rift zones. Lavas associated with the latter type of volcanoes are formed of lighter, lower melting point rocks forming a scum on top of the denser crustal rocks of the drifting plates.
Hydrosphere
Earth’s hydrosphere is the thin film of water between the geosphere and atmosphere forming the salty Ocean covering around 70% of the planetary surface along with lakes and streams of generally nearly salt-free water serving as feeding tendrils draining water condensed from the land. The hydrosphere also includes a solid component of ice and a gaseous component of vapor. These components have very different properties compared to water and each other.
The liquid component of the hydrospheric heat engine absorbs solar energy in the form of heat warming volumes of water, in the form of latent heat of fusion (i.e., melting of ice) absorbing about 80 cal/gm of ice melted, and latent of vaporization (i.e., turning liquid water into an atmospheric gas) absorbing about 540 cal/gm of water vaporized (6.75 times as much energy as required to melt the gm of ice). The heat absorbed becomes ‘latent’ in that the energy transforms the state from liquid to solid or from liquid to gas without changing the measurable or feel-able (i.e., ‘sensible’) temperature of the mass. When the water vapor condenses or the water freezes, of course the latent energies are released in the form of sensible heat.
Basically, the hydrospheric heat engine is driven by the absorption of excess amounts solar radiation (the source) in equatorial, tropical, and subtropical regions of the planet that is mainly carried by ocean currents towards the polar and sub-polar regions where the an excess of heat energy released from water and freezing ice is carried away from the planet in the form of long-wave infrared radiation to the cold sink of outer space. Many different local, regional, and global ocean currents are involved in moving energy around the planetary sphere. Proportionately, a small amount of geothermal heat energy is absorbed from the geospheric heat engine by water, and larger amounts of heat are exchanged with the atmospheric heat engine(s) in a variety of ways.
Water has some very peculiar properties that play very important roles in the climate system and biospheric systems, especially around the freezing point. Most materials contract and become denser as they cool. This is also true for pure water, down to a temperature of 4 °C when it begins to expand and become less dense until it begins to freeze. Ice at 0°C is even lighter such that it easily floats. This is because water molecules are shaped like boomerangs with the oxygen atom at the apex and the two hydrogen atoms sticking out at angles. When they are warmer they jitter around in a relatively random way, such that warming makes the molecules jitter faster and further, while as they cool the jitter slows and they come closer such that a given number of molecules take up less space. As the jitter slows further at and below 4 °C, molecules tend to spread out some to form a quasi crystalline structure approaching that of ice where they are more or less locked into that structure, where the solid water is significantly lighter than the liquid. The presence of dissolved salts and minerals depresses the freezing temperature. As as ice freezes, crystallization of the water also tends to concentrate and expel dissolved minerals and gases in extra-cold plumes of particularly dense and very cold salty water (i.e., brine) — cold enough that tubes of ice may form from the less salty water around the brine.
Water is also a god solvent, able to carry substantial amounts of gases, (e.g., oxygen, CO2, methane – CH4), salts, carbonates, nitrates, sulfates, metal ions, etc). The ocean carries a lot of salt – enough to play an important role in the ocean circulation system. Oxygen and CO2 play essential roles in living systems, CO2 and carbonates play important roles in interactions between water, the Geosphere and the atmosphere. CO2 and methane in the atmosphere, along with water vapor, are the most important greenhouse gases, etc…..
Fig. 23. A summary of the path of the thermohaline circulation. Blue paths represent deep-water currents, while red paths represent surface currents. This map shows the pattern of thermohaline circulation also known as “meridional overturning circulation”. This collection of currents is responsible for the large-scale exchange of water masses in the ocean, including providing oxygen to the deep ocean. The entire circulation pattern takes ~2000 year. Wikipedia
The principal current system driving ocean heat transport is known as the ‘thermohaline circulation‘. Basically, seawater is warmed in the equatorial, tropical and subtropical regions of the world. It also increases in density due to the evaporation of water vapor into the atmosphere. However, parcels of water are kept hot enough that thermal expansion more than compensates for the densification from becoming saltier. However, as currents carry the hot, salty surface water further towards the poles, the water begins to cool until the warm salty water carrying a full load of oxygen becomes dense enough around 4 °C to sink through layers of still warmish but less salty water, carrying a full load of oxygen down to the bottom of the ocean. The salt in this descending water is diluted by mixing with relatively fresh ice water from terrestrial runoffs, melting glacial and sea ice, etc sourced from zones even closer to the poles than where the dense salty water normally sinks.
The main source of power that drives the thermohaline circulation heat engine is the conversion gravitational potential energy in the sinking masses of water as they sink to the ocean floor this sinking helps to pull surface waters into the ‘sinkhole’. Further assists to the circulation are provided by prevailing atmospheric winds pushing surface waters away from continental shores, pulling up cold, deoxygenated, CO2 and mineral rich deep waters to the surface where they fertilize the blooms of micro-algae that add more oxygen and feed the whole food chains of larger organisms in the oceans.
Atmosphere
Fig. 24. (top)Plan and (bottom) cross-section schematic view representations of the general circulation of the atmosphere. Three main circulations exist between the equator and poles due to solar heating and Earth’s rotation: 1) Hadley cell – Low-latitude air moves toward the equator. Due to solar heating, air near the equator rises vertically and moves poleward in the upper atmosphere. 2) Ferrel cell – A midlatitude mean atmospheric circulation cell. In this cell, the air flows poleward and eastward near the surface and equatorward and westward at higher levels. 3) Polar cell – Air rises, diverges, and travels toward the poles. Once over the poles, the air sinks, forming the polar highs. At the surface, air diverges outward from the polar highs. Surface winds in the polar cell are easterly (polar easterlies). A high pressure band is located at about 30° N/S latitude, leading to dry/hot weather due to descending air motion (subtropical dry zones are indicated in orange in the schematic views). Expanding tropics (indicted by orange arrows) are associated with a poleward shift of the subtropical dry zones. A low pressure band is found at 50°–60° N/S, with rainy and stormy weather in relation to the polar jet stream bands of strong westerly wind in the upper levels of the atmosphere. From Wikipedia Hadley Cell.
The atmosphere includes the gaseous components of Earth’s global heat engine. The transport and transfer of heat energy and the Coriolis effect are the major drivers. The major sources of heat are direct conduction of sensible heat across the atmosphere : ocean/land interface, the conversion of latent heat into sensible heat through the evaporation and condensation of water vapor (mainly from the oceans), and direct solar heating (note: because the atmosphere is largely transparent to most radiation, most solar energy is not captured by the atmosphere itself.)
The diagram here shows how the transport of heat from the Earth’s surface to the top of the atmosphere where it radiates away as infrared to the heat sink of outer space organizes the wind systems into three major cycles. Note that the moisture laden warm air cools as it rises and releases a lot more energy as the water vapor condenses into rain or hail to keep the rising air warmer for longer.
Biosphere
The Biosphere (“Life”) – the totality of the living components of the planetary sphere, generally residing in the interface between the Atmophere and the Geosphere/Hydrosphere, where living things are characterized by their capacity to self-organize, self-regulate, and self-reproduce their properties of life through time.
Fig. 25. The biosphere of living things (NASA’s Goddard Space Flight Center, via Wikipedia). False colors are used to show seasonal changes in the concentration of chlorophyll over the annual cycle. On land, vegetation appears on a scale from brown (low to zero vegetation) to dark green (lots of vegetation); at the ocean surface, phytoplankton are indicated on a scale from purple (low) to yellow (high) and red (highest). This visualization was created with data from satellites including SeaWiFS, and instruments including the NASA/NOAA Visible Infrared Imaging Radiometer Suite and the Moderate Resolution Imaging Spectroradiometer.
The biosphere’s “Engine of Life” is predominantly driven by the complexly catalyzed formation of high energy chemical bonds from the capture of solar radiant or activation energy from redox reactions to combine oxygen and carbon to produce high energy carbohydrates (i.e., captured by chlorophyll in photosynthesis) used or ‘burned’ to fuel all kinds of metabolic activities and processes in living things. Living components of the Earth System have and depend for their continued survival and reproduction on their capacity to catalyze all kinds of energy transformations within and between the other Earth Systems. Over time the Engine of Life has profoundly affected the other planetary spheres. A tiny fraction of energy is captured in abyssal depths and deep in the earth through the process of chemosynthesis
Over evolutionary time the emergence and evolution Life has affected major global transformations involving many aspects of Earth’s other subsystems. Evolutionary processes are complexly dynamic and many of them include many potentially powerful positive feedbacks able to drive changes at exponential rates. All life can evolve genetically to live under a wide variety of environmental conditions over multi generational time scales due to natural selection at the genetic level.
A few species and humans in particular, can evolve culturally at intra-generational timescales to drive changes at exponentially explosive rates to the extent that WE are literally threatening all complex life on the planet with global mass extinction – quite possibly within two or three of our own generations!
Interpersonal competition to gain ever more personal power from the burning of globally significant quantities of fossil carbon in less than a century that was accumulated in the geosphere over millions of years by life processes has destabilized Earth’s Climate System. TODAY, we seem to be in the midst of flipping the global climate system from the Glacial-Interglacial Cycle most life has adapted genetically to live under, to the Hothouse Earth regime that very few organisms will be able to survive in without hundreds or thousands of generations or more of genetic adaptation. SEE FEATURED IMAGE!
Views expressed in this post are those of its author(s), not necessarily all Vote Climate One members.
What’s this article about, and why is the date in the title important?
As I write this, the average climate for our WHOLE PLANET is changing so freaking fast we can see visibly measurable changes in the averages from one day to the next!
The sudden speed up of changes in several climate indicators at the same time suggests that we may be crossing a critical tipping point in the complex interactions of important temperature related feedbacks controlling the behavior of Earth’s Climate System, as shown in the Featured Image. The speed-up is highlighted by the fact that the average air temperature 2 meters above the surface of our planet is at an all time record (and especially in the satellite era beginning in 1979). These changes will affect the whole 8,000,000,000+ humans and alive today along with all other life on the planet. The charts and maps presented here graphically illustrate measurements of important climate variables up to the last 1 to 4 days.
Fig. 1. ClimateReanalyzer’s Time Series plotting of Earth’s global average temperature at 2 meters above the surface from the NCEP Climate Forecast System (CFS) version 2 (April 2011 – present) and CFS Reanalysis (January 1979 – March 2011). CFS/CFSR is a numerical climate/weather modeling framework that ingests surface, radiosonde, and satellite observations to estimate the state of the atmosphere at hourly time resolution onward from 1 January 1979. The horizontal gridcell resolution is 0.5°x0.5° (~ 55km at 45°N). The time series chart displays area-weighted means for the selected domain. For example, if World is selected, then each daily temperature value on the chart represents the average of all gridcells 90°S–90°N, 0–360°E and accounts for the convergence of longitudes at the poles. Hide or display individual time series by clicking the year below the chart
The time gap between the instants of measurement depicted in the plots and charts and when they were printed are due to time delays between:
automatically recording millions of readings from hundreds of thousands of networked physical sensors and more millions of readings from remote sensors on a plethora of artificial satellites whizzing around our revolving planet several times a day (“Intensity of observation”, below, illustrates just how comprehensive the sensor network is);
accumulating and assembling the recorded data over the world-wide communications network;
proofing, processing and tabulating the received data on the world’s largest supercomputers; reanalyzing and plotting the observations in the form of charts and graphs comprehensible to humans;
publishing and publishing these outputs onto the public web, where they are accessible to anyone with a computer and the knowledge to find and understand the representations.
Based on the most recent measurements, the ongoing climate changes are accelerating in directions and speeds that will inevitably be lethal to the human and many other species within another century, more or less, if the changes are not stopped and reversed. These changes are a direct consequence of an unplanned experiment that humans began around 1½ centuries ago to burn geologically significant quantities of fossil carbon (e.g., coal, oil, ‘natural’ gas) into usable energy and greenhouse gases trapping an ever growing proportion of the total solar energy striking Planet Earth.
However, some of the combustion energy released by burning fossil carbon has also fueled an exponential growth of knowledge and technology able to produce the I am showing here. These plots provide the evidence our experiment is changing our global climate system to a state that will have existentially catastrophic consequences for Earth’s complex forms of life. This Hellish state is known as “Hothouse Earth“.
This fact that we now have the tools to actually see the evidence of our likely doom gives me some hope that our still exponentially improving technology may also provide us with the ability to stop further damage caused by our rogue experiment and repair enough of the damage already caused, to allow our species to continue evolving into the foreseeable future.
This raises the unavoidable and fraught question: Do we humans have the political will and capability to marshal and mobilize our technologies to engineer solutions that will allow us to avoid the abyss? This is the single most important issue facing the world today. If we don’t solve it, no other issue matters because — before long — no one will be left to worry about it.
Problematically, the world’s governments are dominated by puppets of the fossil fuel industry and related interests. They are doing as much as they can to PREVENT, DELAY, or MINIMIZE any actions that might hamper fossil fuel’s greed and short term interests for the world to burn yet more fuel. Hoping that we humans can solve this single, most important issue, VoteClimateOne is working to revolutionize our governments by replacing or changing parliamentary puppets to prioritize actions to solve the climate crisis first. Also, I am writing articles such as this to demonstrate and explain why this revolution is so urgent and necessary.
To demonstrate just how rapidly we are currently moving down the road to doom in what will be Earth’s Hothouse Hell, this article will be updated at least once a week until there is evidence of a downward trend to safer readings.
Measuring progress towards existential catastrophe on Hothouse Earth
Ocean measurements are critical
Because most humans live on continental land masses, immersed in the atmosphere, most climatologists are primarily concerned with what goes on in the atmosphere. However, because water covers some 70% of our planet’s surface and because of water’s physical properties, around 90% of the excess solar energy striking Earth is absorbed in the World Ocean. Heat is then transported around the planet in currents and is available to be released to drive climate. See belowfor explanations of how the major heat engines driving Earth’s Climate System interact and work.
Fig. 2. Growing heat content held by our warming Ocean Current to Feb. 2023 (NOAA data)
Because these climate ‘engines’ are complex dynamical systems with many interacting components, where the interactions are often non-linear and sometimes even chaotic (in a mathematical sense their behavior is inherently unpredictable to any statistically define degree. Positive feedbacks in such systems can be potentially destructive because they lead to exponentially growing changes that lead to system breakdown (because infinity is impossible in the real world). Mathematical modeling of the interactions of small sets of variables can provide an appreciation of how such breakdowns may occur. Systems engineering as practiced in large defence engineering projects is based around a MilStd known as Failure Modes Effects and Criticality Analysis (FMECA) to identify such kinds of failure modes in order to engineer system solutions mitigate or totally avoid circumstances where they might arise.
The charts and maps below show how some measures of the behavior of Global Climate System have been behaving over the last few months and days. I consider these to be critical because they are likely to be evolved in the kinds of positive feedbacks that can grow exponentially to cause systems failure or collapse.
A definition
Many of the charts represent values of particular variables averaged over the surface of the whole Earth (or some specified region) at a specified point or interval of time. Most maps use colors to indicate the value of a specified variable at a specified point or averaged over an interval of time. In most such cases these measures are presented in the form of “anomalies”. An anomaly is the difference between the particular measurement and the long-term ‘baseline’ average for that measure on that day or interval of the year. For example, the graph immediately below uses a 30 year average (from 1971-2000) for its baseline average. Anomaly plots are particularly useful to highlight changes taking place over time.
Critical variables
Global sea-surface temperature
The global sea surface temperature anomaly broke into all-time record for the day of the year around 15 March, and by the end of March it was an all time record high since 1981, 0.1 °C above the previous record set on 6 March 2015. This value is so extreme, that along with other variables noted below it suggests that the average rate of global warming observed over the last few decades may be shifting into a new regime where the rate of ocean-surface warming is skyrocketing. As at 29 June it is still 0.2 °C above the previous record for that date – with an uptick after 4 days of downward trend).
Fig. 3a. This chart provides time series visualizations of daily mean Sea Surface Temperature (SST) up to 4 July from NOAA Optimum Interpolation SST (OISST) version 2.1. OISST is a 0.25°x0.25° gridded dataset that provides estimates of temperature based on a blend of satellite, ship, and buoy observations. The datset spans 1 January 1982 to present with a 1 to 2-day lag from the current day. Data are preliminary for about two weeks until a finalized product is posted by NOAA. This status is identified on the maps by “[preliminary]” appearing in the title, and applies to the time series as well. SST anomalies, which are included in the OISST dataset, are based on 1971–2000 climatology. The time series chart displays area-weighted means for the selected domain. For example, if World 60S-60N is selected, then each daily SST value on the chart represents the average of all ocean gridcells between 60°S and 60°N across all longitudes, and accounts for the convergence of longitudes at the poles. Hide or display individual time series by clicking the year below the chart; Hide All and Show All buttons are at the chart lower right. The map can be switched between SST and SST anomaly by clicking the toggle button at the map top-left. A sea ice mask is applied to the SST and anomaly maps for gridcells where ice concentration is >= 50%
Fig. 3b. Sea Surface Temperature AnomaliesFig. 3c. Sea Surface Temperatures. ClimateReanalyzer’s SST current SST data can be accessed here.
The North Atlantic still has a fever on 4 July. Warmer than usual water flooding up around southern Greenland right up to the edge of the melting sea-ice, with what looks like cold fresh meltwater flowing out of Baffin Bay along the west side.
Note that the ocean surface temperature is 5 °C right up to the edge of the sea ice, with warmer water than that intruding nearly as far as the ice front in Baffin Bay. Cooler water may be flowing out close to the Canadian shoreline. There is no sign in either of the SST maps of ‘cool spots’ which are thought to be the sources of the ‘salty cold water’ forming the deep water branches of the thermohaline circulation in the North Atlantic. In fact, the ocean in these areas seems to be 10-15 °C. Northern Hemisphere ice extents are low for the date but not yet near record lows, unlike the South!
Fig. 4a. Record Sea Surface temperature in North Atlantic for Jul 4.Fig 4b. Sea Surface Temperature distribution in North Atlantic.
Sea ice
Around the same time the global average sea-surface temperature began to skyrocket, the rate of sea-ice formation around Antarctica slowed — as would be expected if the surrounding ocean was becoming progressively warmer than has ever before been the case for this time of the year.
Fig. 5a. Time series showing he full annual cycle of the melting and freezing of sea ice around Antarctica from Jan 1979 up to 3 July. Seaice.visuals.Earth.
Fig 5b. Time series showing daily anomalies in the extent of sea ice around Antarctica from Jan 1979 up to 3 July highlighting the substantial slowing of freezing. Note differences in scale to 5a.
Sea ice extent anomaly is strongest in the Weddell and Bellingshausen Sea region. With the Indian Ocean region also showing what looks like the beginning of a strong deviation. The illustration is from the article from the Australian Antarctic Program Partnership that discusses the significance of the anomaly.
Fig. 6. Monthly anomalies in Antarctic sea-ice concentration for early June 2023, showing more negative than positive anomalies. Note colour bar (deep red is -70%), and lack of sea ice in Bellingshausen Sea (arrowed). Even though Antarctica is in mid-freeze season, Bellingshausen Sea is almost at summer sea-ice levels. (Source: nilas.org). see also Polar View.
Sea ice extent anomaly is strongest in the Weddell Sea (area above the Antarctic Peninsula) and Bellingshausen Sea region (indicated by the arrow above). With the Indian Ocean region also showing what looks like the beginning of a strong deviation. See especially the article from the Australian Antarctic Program Partnership that discusses the significance of the anomaly.
Fig. 7. Color-coded animation displaying the last 2 weeks of the daily sea ice concentrations Sea ice concentration is the percent areal coverage of ice within the data element (grid cell) in the Southern Hemisphere. These images use data from the AMSR-E/AMSR2 Unified Level-3 12.5 km product. The different shades of gray over land indicate the land elevation with the lightest gray being the highest elevation.
This graphic from NASA Earth Science’s Current State of Sea Ice Cover shows the slow rate of ice formation around Antarctica. The almost complete absence of ice in the Bellingshausen Sea is remarkable. There is also significant open water within the extent of the sea ice.
Nature. (2017). Garabato et al. 9 Feb (2017). Vigorous lateral export of the meltwater outflow from beneath an Antarctic ice shelf. 10.1038/nature20825. Free PDF
Nature 29 Mar (2023). Qian Li, et al.. Abyssal ocean overturning slowdown and warming driven by Antarctic meltwater. 10.1038/s41586-023-05762-w [paywalled!]
Nature Climate Change, 2 June (2023). Zhou et al. Slowdown of Antarctic Bottom Water export driven by climatic wind and sea-ice changes. https://doi.org/10.1038/s41558-023-01695-4.
Is all this part of an early warning that a tipping point is being approached…. Or is it the real thing?
So far, melting of the Arctic sea ice has not been particularly exceptional. With regard to sea-ice at both poles, it is also important to consider thickness and volume. Ice that is only a meter or two thick is accumulated in the winter when there is no solar heating (sun largely or completely below the horizon) is normally only a year old. Solid ice reflects most of the solar energy heating it. However, the thinner the ice is, the faster it can melt as it begins to heat under the summer sun and possibly even rain(!), to say nothing of warm currents from the tropics. Around the North Pole, all of the bluish and purple ice shown in the map here can disappear fairly quickly as summer continues to leave open ocean to absorb most of the solar energy striking it that will delay freezing in the following winter. (Danish Arctic Research Institution’s Polar Portal).
Fig. 9. Thickness of Arctic Sea Ice on 5 July 2023. Note the Danish Polar Portal provides an animated time series of changes from 1 Jan 2004.
Jet streams
Fig. 10a. Jet streams in the Southern Hemisphere.
Fig. 10b. Jet streams in the Northern Hemisphere
Fig. 10c. Global distribution of jet streams.
Jet streams are the atmospheric equivalents to major ocean currents that influence all of the other weather systems on the planet to keep them moving latitudinally around the planet. They are driven by temperature differences between the tropical and polar regions of the Earth and Coreolus effects as winds blow towards or away from the poles. Where the temperature differs strongly between poles and equator the jet streams are well organized with high winds. As temperature differences decrease so do the wind speeds, and the streams begin to slowly meander until they may become quite chaotic. Winds less than 60 kt are not considered to be jet streams. At present (as shown in Fig 8b, there are virtually NO jet streams at all in the Northern Hemisphere, and the winds that do exist are completely chaotic — a highly unusual situation. This leaves major heat domes and cold patches basically motionless, facilitating the buildup of record temperatures.
Fig. 11. The taiga is found throughout the high northern latitudes, between the tundra and the temperate forest, from about 50°N to 70°N, but with considerable regional variation. (Wikipedia).
Some of the greatest impacts of the disrupted jet stream system are seen over the boreal/taiga forest zones of North America and Eurasia. Arctic tundra and much of the taiga is underlain by carbon rich peat and peaty permafrost soils that are thought to contain at least 2x more carbon than the current amount of carbon in our atmosphere. Depending on circumstances, significant amounts of that carbon can be released in the form of methane, that has more than 80x the greenhouse potential of CO2 over the first 20 years of emission (20x over 100 years).
Fig. 12.By the end of June Canadian wildfires mainly in boreal forests have burned more area before the fire season is half over than in the previous record for a full year in 1989. Phys Org (30 June 2023). As at 6 July 8.782,952 have burned (Canadian Interagency Forest Fire Centre).
If the burning releases more greenhouse emissions than can readily be recaptured by re-vegetating forests. These emissions may more than replace any emissions humans cut — providing positive feedback to drive global temperatures still higher. This is one of several crucial tipping points associated with stopping the thermohaline circulation.
Intensity of observation
A hint to how little you can trust claims of reality denying trolls, puppets, and the like, is provided by the number monitoring points that physically monitor the atmosphere at those locations around the surface of the planet we live on used PER DAY.
Atmospheric monitoring
The European Centre for Medium-Range Weather Forecasts (ECMWF) for the charts plotted on 6 July 2023 as shown below are based on measurements from 92,702 locations. Note 1: this map does not NOT include ocean monitoring points. Note 2: The DATA COLLECTED EVERY DAY by this web of sensors is available to, used, and interpreted by several different national and institutional climate monitoring centers. In other words, the conclusions are cross checked between different centers many times over. The charts above depict scientific facts, not hunches and personal opinions. For more detail on how the accuracy of the observations is controlled see ECMWF’s Monitoring of the observing system.
Fig. 13. This chart maps the type and location of 92,702 separate observations used on 6 July 2023 between 3:00 and 9:00 PM for 6 hourly data coverage used by the ECMWF data assimilation system (4DVAR). Each plot shows the available data for a family of observations. The current day’s chart can be downloaded here. SYNOP refers to encoded information collected and transmitted every 6 hours by more than 7600 manned and unmanned meteorological stations and more than 2500 mobile stations around the world and is used for weather forecasting and climatic statistics. SHIP METAR is a format for reporting weather information. A METAR weather report is predominantly used by aircraft pilots, and by meteorologists, who use aggregated METAR information to assist in weather forecasting.
Oceanographic monitoring
Argo
Argo floats profiles physical properties of the surrounding water, minimally ocean temperature, salinity, pressure (i.e., depth). Each float operates on a 10 day cycle, spending most of the cycle ‘resting’ at an intermediate depth. On the 10th day it sinks to a specified depth and begins recording inputs from its sensors as it floats up to the surface. The standard float sinks to a depth of 2 km (2,000 m) and records all the way up to the surface, where it then determines its GPS position to within a few meters and messages a passing relay satellite with its location and profile data before sinking to its resting depth waiting for the next profile position. As shown on the world map here, for June 2023, shows the locations of 3849 profiles received over the month. Of these ~1,400 recorded the profile from 2 km deep in the ocean to the surface. Some floats are designed to sink to the bottom and thus record a profile for the full depth of the ocean. A few include several additional sensors to levels for things like acidity, oxygen, nitrate, light level, and some more I don’t recognize. The Argo system is really quite amazing.
Some even have ice sensors allowing them to operate even in ice-covered waters by warning if they might be fatally damaged by striking ice overhead. For these, if they sense ice, they’ll record the profile in memory, and drop back and rest until the next cycle (which may again prevent surfacing). These interrupted cycles will keep repeating until the float can safely surface — in which case all of the aborted profiles will be messaged to the satellite relay along with the current one (better late than never!)
And then there is a plethora of other ocean sensor systems. The full gamut of them shown next. The various different types are named in the legend. Collectively, on 26 June 2023, the ocean sensing system measuring in-situ variables includes 7973 ‘platforms’ (including the different kinds of Argo Floats) and results from 104 ‘cruises’ of ships ranging from specialized oceanographic vessels to fishing boats. Some of these non-Argo systems also record partial or complete (i.e., to the bottom) profiles.
Almost all of the data collected from the range of sensors is freely accessible via the public World Wide Web.
Fig. 15.
Satellite remote sensing systems
As if the plethora of physical systems for directly measuring weather and climate is not enough. There is now a cloud of satellite-based remote sensing systems buzzing around our planet, making literally millions of observations every day of critical weather and climate variables. NASA EarthData’s What is remote sensing? gives a high level overview of some of the capabilities of these systems. You can be assured that the measurements made by the earth-based and space-based sensing systems are carefully cross calibrated to ensure the various systems are all working together towards a common view of the actual physical reality.
Major heat engine domains of the Earth System
Dynamic changes in the Universe through time are driven by spontaneous flows and transformations of energy from ‘sources’ at high potential to entropy and ‘sinks’ at lower potentials (e.g., water flowing down a hill). This flux can be used to drive other processes through a system of coupled interactions forming a thermodynamic system or heat engine. As governed by the universal physical Laws of Thermodynamics (especially the Second Law), as long as there is a potential difference between source and sink, the flux of energy between them will continue to spontaneously flow through the system/heat engine as long as long as the system’s net entropy production remains positive.
The ‘Earth System’ includes all the shell-like layered components of the planet from the edge of outer space to its center. The three main ones concerning us here from inside out are the geosphere, hydrosphere, and atmosphere. The biosphere formed in the interface between atmosphere and geosphere (on the planetary scale) is a microscopically thin turbulent layer of carbonaceous macromolecules and water combined with other elements and molecules exhibiting the properties of life. We humans form part of that biosphere.
The heat engines described here circulate masses of matter that transport heat energy from place to place within the Earth System.
Geosphere
The geosphere comprises Planet Earth’s, solid (‘rocky’) components. The geosphere’s heat engine is based on the geologically slow process of plate tectonics that drives continental drift.
Fig. 16. Geological heat engine at work. Mantle convection may be the main driver behind plate tectonics. Image via University of Sydney.
The plate tectonics engine is driven by the slow radioactive decay of unstable isotopes of elements such as potassium, uranium and thorium remaining from the formation of Earth some 4.5 billion years ago.
Enough heat has and is being generated by this decay to melt the planet’s core and heat and expand the overlying mantle rocks enough to make them less dense and plastic enough for them to form convection cells like you see in a pan of nearly boiling water. Hotter and less dense rocks float up towards Earth’s harder crust and spread out (carrying surface crust and even lighter continental rocks, i.e., ‘plates’) to become cool enough for gravitational force to pull the solidified plates back towards the molten core in subduction zones that also form oceanic trenches.
Heat transported from radioactive decay is released into the hydrosphere and atmosphere from conduction through the crust + hot springs and geysers; by molten basalt lava coming to the surface in oceanic and terrestrial spreading (‘rift zones’); and volcanoes associated with localized ‘hot spots of rising magma or with the rift zones. Lavas associated with the latter type of volcanoes are formed of lighter, lower melting point rocks forming a scum on top of the denser crustal rocks of the drifting plates.
Hydrosphere
Earth’s hydrosphere is the thin film of water between the geosphere and atmosphere forming the salty Ocean covering around 70% of the planetary surface along with lakes and streams of generally nearly salt-free water serving as feeding tendrils draining water condensed from the land. The hydrosphere also includes a solid component of ice and a gaseous component of vapor. These components have very different properties compared to water and each other.
The liquid component of the hydrospheric heat engine absorbs solar energy in the form of heat warming volumes of water, in the form of latent heat of fusion (i.e., melting of ice) absorbing about 80 cal/gm of ice melted, and latent of vaporization (i.e., turning liquid water into an atmospheric gas) absorbing about 540 cal/gm of water vaporized (6.75 times as much energy as required to melt the gm of ice). The heat absorbed becomes ‘latent’ in that the energy transforms the state from liquid to solid or from liquid to gas without changing the measurable or feel-able (i.e., ‘sensible’) temperature of the mass. When the water vapor condenses or the water freezes, of course the latent energies are released in the form of sensible heat.
Basically, the hydrospheric heat engine is driven by the absorption of excess amounts solar radiation (the source) in equatorial, tropical, and subtropical regions of the planet that is mainly carried by ocean currents towards the polar and sub-polar regions where the an excess of heat energy released from water and freezing ice is carried away from the planet in the form of long-wave infrared radiation to the cold sink of outer space. Many different local, regional, and global ocean currents are involved in moving energy around the planetary sphere. Proportionately, a small amount of geothermal heat energy is absorbed from the geospheric heat engine by water, and larger amounts of heat are exchanged with the atmospheric heat engine(s) in a variety of ways.
Water has some very peculiar properties that play very important roles in the climate system and biospheric systems, especially around the freezing point. Most materials contract and become denser as they cool. This is also true for pure water, down to a temperature of 4 °C when it begins to expand and become less dense until it begins to freeze. Ice at 0°C is even lighter such that it easily floats. This is because water molecules are shaped like boomerangs with the oxygen atom at the apex and the two hydrogen atoms sticking out at angles. When they are warmer they jitter around in a relatively random way, such that warming makes the molecules jitter faster and further, while as they cool the jitter slows and they come closer such that a given number of molecules take up less space. As the jitter slows further at and below 4 °C, molecules tend to spread out some to form a quasi crystalline structure approaching that of ice where they are more or less locked into that structure, where the solid water is significantly lighter than the liquid. The presence of dissolved salts and minerals depresses the freezing temperature. As as ice freezes, crystallization of the water also tends to concentrate and expel dissolved minerals and gases in extra-cold plumes of particularly dense and very cold salty water (i.e., brine) — cold enough that tubes of ice may form from the less salty water around the brine.
Water is also a god solvent, able to carry substantial amounts of gases, (e.g., oxygen, CO2, methane – CH4), salts, carbonates, nitrates, sulfates, metal ions, etc). The ocean carries a lot of salt – enough to play an important role in the ocean circulation system. Oxygen and CO2 play essential roles in living systems, CO2 and carbonates play important roles in interactions between water, the Geosphere and the atmosphere. CO2 and methane in the atmosphere, along with water vapor, are the most important greenhouse gases, etc…..
Fig. 17. A summary of the path of the thermohaline circulation. Blue paths represent deep-water currents, while red paths represent surface currents. This map shows the pattern of thermohaline circulation also known as “meridional overturning circulation”. This collection of currents is responsible for the large-scale exchange of water masses in the ocean, including providing oxygen to the deep ocean. The entire circulation pattern takes ~2000 year. Wikipedia
The principal current system driving ocean heat transport is known as the ‘thermohaline circulation‘. Basically, seawater is warmed in the equatorial, tropical and subtropical regions of the world. It also increases in density due to the evaporation of water vapor into the atmosphere. However, parcels of water are kept hot enough that thermal expansion more than compensates for the densification from becoming saltier. However, as currents carry the hot, salty surface water further towards the poles, the water begins to cool until the warm salty water carrying a full load of oxygen becomes dense enough around 4 °C to sink through layers of still warmish but less salty water, carrying a full load of oxygen down to the bottom of the ocean. The salt in this descending water is diluted by mixing with relatively fresh ice water from terrestrial runoffs, melting glacial and sea ice, etc sourced from zones even closer to the poles than where the dense salty water normally sinks.
The main source of power that drives the thermohaline circulation heat engine is the conversion gravitational potential energy in the sinking masses of water as they sink to the ocean floor this sinking helps to pull surface waters into the ‘sinkhole’. Further assists to the circulation are provided by prevailing atmospheric winds pushing surface waters away from continental shores, pulling up cold, deoxygenated, CO2 and mineral rich deep waters to the surface where they fertilize the blooms of micro-algae that add more oxygen and feed the whole food chains of larger organisms in the oceans.
Atmosphere
Fig. 18. (top)Plan and (bottom) cross-section schematic view representations of the general circulation of the atmosphere. Three main circulations exist between the equator and poles due to solar heating and Earth’s rotation: 1) Hadley cell – Low-latitude air moves toward the equator. Due to solar heating, air near the equator rises vertically and moves poleward in the upper atmosphere. 2) Ferrel cell – A midlatitude mean atmospheric circulation cell. In this cell, the air flows poleward and eastward near the surface and equatorward and westward at higher levels. 3) Polar cell – Air rises, diverges, and travels toward the poles. Once over the poles, the air sinks, forming the polar highs. At the surface, air diverges outward from the polar highs. Surface winds in the polar cell are easterly (polar easterlies). A high pressure band is located at about 30° N/S latitude, leading to dry/hot weather due to descending air motion (subtropical dry zones are indicated in orange in the schematic views). Expanding tropics (indicted by orange arrows) are associated with a poleward shift of the subtropical dry zones. A low pressure band is found at 50°–60° N/S, with rainy and stormy weather in relation to the polar jet stream bands of strong westerly wind in the upper levels of the atmosphere. From Wikipedia Hadley Cell.
The atmosphere includes the gaseous components of Earth’s global heat engine. The transport and transfer of heat energy and the Coriolis effect are the major drivers. The major sources of heat are direct conduction of sensible heat across the atmosphere : ocean/land interface, the conversion of latent heat into sensible heat through the evaporation and condensation of water vapor (mainly from the oceans), and direct solar heating (note: because the atmosphere is largely transparent to most radiation, most solar energy is not captured by the atmosphere itself.)
The diagram here shows how the transport of heat from the Earth’s surface to the top of the atmosphere where it radiates away as infrared to the heat sink of outer space organizes the wind systems into three major cycles. Note that the moisture laden warm air cools as it rises and releases a lot more energy as the water vapor condenses into rain or hail to keep the rising air warmer for longer.
Biosphere
The Biosphere (“Life”) – the totality of the living components of the planetary sphere, generally residing in the interface between the Atmophere and the Geosphere/Hydrosphere, where living things are characterized by their capacity to self-organize, self-regulate, and self-reproduce their properties of life through time.
The “Engine of Life” is predominantly driven by the complexly catalyzed formation of high energy chemical bonds from the capture of solar radiant or activation energy from redox reactions to combine oxygen and carbon to produce high energy carbohydrates used or ‘burned’ to fuel all kinds of metabolic activities and processes in living things. Living components of the Earth System have and depend for their continued survival and reproduction on their capacity to catalyze all kinds of energy transformations within and between the other Earth Systems. Over time the Engine of Life has profoundly affected the other planetary spheres.
Over evolutionary time the emergence and evolution Life has affected major global transformations involving many aspects of Earth’s other subsystems. Evolutionary processes are complexly dynamic and many of them include many potentially powerful positive feedbacks able to drive changes at exponential rates. All life can evolve genetically to live under a wide variety of environmental conditions over multi generational time scales due to natural selection at the genetic level.
A few species and humans in particular, can evolve culturally at intra-generational timescales to drive changes at exponentially explosive rates to the extent that WE are literally threatening all complex life on the planet with global mass extinction – quite possibly within two or three of our own generations!
Interpersonal competition to gain ever more personal power from the burning of globally significant quantities of fossil carbon in less than a century that was accumulated in the geosphere over millions of years by life processes has destabilized Earth’s Climate System. TODAY, we seem to be in the midst of flipping the global climate system from the Glacial-Interglacial Cycle most life has adapted genetically to live under, to the Hothouse Earth regime that very few organisms will be able to survive in without hundreds or thousands of generations or more of genetic adaptation. SEE FEATURED IMAGE!
Views expressed in this post are those of its author(s), not necessarily all Vote Climate One members.
Climate change, driven by burning fossil fuels, contributing to the Great Deluge, is consigning Australia to escalating climate disasters
Most of Australia’s East Coast from Cape York south to the Victorian border has had over a meter of rain by the end of October — with the rains still continuing. Some of these areas have had more than 2 meters, and a few more than 3 meters! Many rainfall records have been smashed in all of the eastern states: Queensland, New South Wales, Victoria, Tasmania; leading to almost constant flooding through the whole area that is continuing today. The latest reports from the BOM tell us the rains will continue into summer.
This is clearly a function of global warming. Physical laws dictate that as air temperatures rise, the air can carry more water vapor before it begins to condense as rain. Higher temperatures increase the rate of evaporation of water from soils and standing water – encouraging drought. Seemingly contradictory warmer air can precipitate more water in areas where it is raining. As the water condenses out as rain it also releases its ‘heat of fusion’ — and more heat is available to drive more extreme winds able to carry rain to high elevations before the rain freezes to fall back to Earth in devastating hail storms. Over larger areas there is also more energy available to fuel increasingly powerful cyclones.
Increased water means increased plant growth, increased temperature increases the rate at which soils and vegetation dry out — ensuring ever more catastrophic wildfires.
Ever more floods, fires and tempests cause increasing damage to infrastructure and people’s livelihoods and property until the catastrophes follow one another so closely that there are simply not physical or human resources left to repair the damage from one catastrophe before the next catastrophe causes even more damage. If the warming is not stopped this progression leads inevitably leads to social collapse (as we are already seeing in parts of the world), agricultural collapse (and famines as we are already beginning to see in Africa and the Middle East), ecological collapse (as we are already seeing in marine habitats with coral reef communities, kelp beds, sea grass meadows), and finally, population collapses when the land has literally been swept bare (areas in Africa are already on the edge of the cliff).
With the collapse of society, humans will quickly lose the scientific and engineering capabilities to fight further climate change already dialed into the system, such that there will be little hope of avoiding near-term global mass extinction. Continuing ‘business as usual’ support of the fossil fuel industry more-or-less ensures this grim outcome.
The Climate Council’s report, presented below, presents the facts and explains what they mean here in Australia, and some of the things we can to moderate and mitigate the expected damages. This is a good start, but I would be a silly liar if I said this was all we need to do in order to keep from utterly destroying our future.
Vote Climate One will continue to do whatever we can do to encourage serious government leadership and action to fight climate change. Please do what you can to pressure your representatives to counteract the self-serving special interests who consume our resources and return little or nothing from the super-profits they take overseas.
If we can help get climate savvy governments on the problems that really matter, they may be able to mobilize enough action so we can survive our accidental disruption of Earth’s Climate System so our kids and grandkids inherit a world they can live in….
Let’s hope that we can stop global warming soon enough to leave them with a future where they can survive and flourish
Featured Image: Rainfall and Flooding 2022 – Queensland to Tasmania. Current year data from 1 January to 2 November, sourced from Bureau of Meteorology, 2022. Graphic from Chapter 2, The Great Deluge: Climate Extremes in Action, in the featured article.
Views expressed in this post are those of its author(s), not necessarily all Vote Climate One members.
We live in dangerous times. Our state and federal parliaments will make life and death decisions about the climate crisis
Global warming is real. It was triggered by the ‘greenhouse effects’ in the atmosphere of exponentially increasing amounts of CO₂ emitted by humanity’s prodigious burning of fossil carbon beginning with the Industrial Revolution. The rate of warming is also slowly accelerating to a point of crisis, where positive feedbacks driving further acceleration may be unstoppable by anything humans can do. If the warming runs away, there is no evidence that natural processes will stop heating before the ensuing Hothouse Earth condition causes global mass extinction – including our own species.
These statements are real world facts substantiated by a vast array of scientific evidence. We deny the reality at our own peril.
Here is a tiny bit of the evidence:
Estimated changes in annual global mean surface temperatures (°C, color bars) and CO2 concentrations (thick black line) over the past 150 years relative to twentieth century average values. Carbon dioxide concentrations since 1957 are from direct measurements at Mauna Loa, Hawaii, while earlier estimates are derived from ice core records. The scale for CO2 concentrations is in parts per million by volume (ppm), relative to the twentieth century mean of 333.7 ppm, while the temperature anomalies are relative to a mean of 14 °C. Also given as dashed values are the preindustrial estimated values, where the value is 280 ppm, with the scale in orange at right for carbon dioxide. From Trenbarth & Cheng (2022), A perspective on climate change from Earth’s energy imbalance. Environ. Res.: Climate1 013001 (Creative Commons Attribution 4.0 license)
Berkeley Earth corroborates Trenbarth & Cheng’s temperature observations above in great detail.
The rising concentrations of CO2 and other important greenhouse gases (GHGs) in our atmosphere are meticulously plotted by US National Oceanic and Atmospheric Administration Global Monitoring Laboratory’s Carbon Cycle Greenhouse Gases project’s Trends pages:
The Carbon Cycle Greenhouse Gases – Trends pages show the most up to date measurements and rates of changes of the three most important greenhouse gases. Links to the individual graphs are: (1) Atmospheric CO2; (2) Annual Increase of CO2; (3) Global Monthly Mean CH₄ / Annual Global Increase of CH₄; and (4) Global Monthly Mean N₂O / Annual Global Increase of N₂O. These links also explain how the data were collected and analyzed to produce the graphs.
The ‘pump handle’ graph below begins by showing monthly readings from the various sampling sites around the world on the left (with the distance from the equator – S to N plotted on the horizontal axis), and the global averages on the graph to the right.
The northern (right) end of the plot of monthly readings jumps up and down showing the marked annual variation in the atmospheric CO2 as the gas is consumed by plants’ photosynthesis in the spring and released by dead and decaying vegetation in the fall. More CO2 is released into the atmosphere in each year than plants can use, causing the average to ratchet upward each year. The excess CO2 is mostly from the burning of fossil fuels that has exceeded the biosphere’s capacity to use it to support plant growth.
The inset map shows the the location of each site from which the CO2 in each month.
When the present time is reached the graph begins looking backwards in time. The different colors represent the different sources of information for the older readings back into the Ice Age.
History of atmospheric carbon dioxide from 800,000 years ago until the end of the most recent GLOBALVIEW+ CO2 collection. From NOAA’s Carbon Cycle Greenhouse Gases / Trends in CO2.
As shown by the first series of graphs, CO2 is currently the dominant GHG because of its high concentration, but on a molecule-by-molecule basis methane (CH₄) and oxides of nitrogen (mainly N20) are much more powerful. At the rate methane is being released compared to the other gases, it will soon replace CO2 as the dominant GHG. Because permafrost and frozen soil above and below sea level presently holds vast amounts of methane inertly as ice-like hydrates, a warming Arctic has the capacity to release many times the present volume of atmospheric methane.
All three gases are released from natural sources at a greater rates as the ambient temperature rises. This causes positive feedbacks on global average temperatures that are effectively beyond human control. To slow the natural emissions we must reduce those GHG emissions we can control FASTER than positive feedbacks are driving them higher or reduce the strength of the greenhouse either by actively removing and safely sequestering GHGs or by actively cooling the WHOLE PLANET by some kind of geoengineering process(es) that reflects solar energy before it is trapped in the Earth System. The point beyond which we cannot stop the warming process is literally a point of no return on the road to runaway global warming.
The observations show that there is actually a very real and very high risk of near term human extinction (i.e., an EXISTENTIAL RISK) if we do not act to stop global warming
Ample evidence shows there is enough carbon readily available for release in a runaway warming scenario in the Earth System to to raise global average temperatures by 5-10 °C within a century or so of passing the point of no return.
The truth is so dire and scary that even most scientists fear (consciously or subconsciously) to use the EXTINCTION word
As I argued in my 2022 presentation, linked above, this is especially the case of academic modelers with training in physics (rather than, say, systems engineering). Three issues likely have significant influences:
Scientific reticence – you don’t win grants or tenure or get promoted if you work too far outside the boundaries of your academic furrows (i.e., what your academic peers expect of you) – and this is especially true of you come to scary or unpopular conclusions,
Failure to understand how to deal with risks associated with non-linear feedbacks and mathematical chaos in complex dynamical systems: e.g., discarding models that sporadically ‘blow up’ and break, rather than accepting that these are more likely valuable indicators of how such system can behave in the real world. Systems engineers know systems break, and observe/test them until they do break (preferably many times in many different ways), and even have a discipline dedicated to that approach: ‘Failure Modes and Effects (Criticality) Analysis‘. Mathematical modelers work very hard to remove real-world chaos from their models because the underlying belief of most physicists is that physical processes should be exactly repeatable.
Failure to accept that an ‘existential’ risk is actually actually a factual statement that personal, species, and global mass extinction is a very real and even likely result if a runaway situation occurs. Physics happens irrespective of what any human might wish.
Mathematical models are useful for understanding possible behaviors of complex climate systems, but should not be accepted and acted on as accurate representations of how probable or costly a particular event or excursion might be. If an existential event occurs, its cost to humans will literally be infinite, because the denominator will be zero. The cost to society will huge in that no society will be left to pay it…..
However, even the prestigious science journal Proceedings of the (US) National Academy of Sciences (PNAS) does not take the consequences of civilization’s collapse in the face of runaway warming to the logical conclusion. Nevertheless, it follows from the substantial array of evidence on Climate Sentinel News and covered in the presentations linked above that we are already trending towards collapse. It follows from these considerations that:
Only mobilization of a massive and coordinated effort to stop ongoing human carbon emissions will suffice to stop the feedbacks from running away.
As temperatures continue rising increasing ecological changes will begin debilitating an increasing percentage of the human population, making areas of our planet effectively uninhabitable; and lead to the effective extinction of keystone species in natural and agricultural ecosystems – leading to their effective collapses.
Human organizations, economies, nation states, civilizations will be increasingly stressed until they too begin to collapse as a consequence of mass disablements and deaths from heat stress, famine, social disruption, disorder and lethal conflicts probably including nuclear warfare over dwindling resources.
As 3 progresses, at some (probably relatively early point in the process), humanity would no longer have the resources, coordination or physical capacity to mount the massive and coordinated effort to stop and reverse the accelerating warming process.
Given that surviving humans are no longer capable of stopping the warming process, the planet will continue to strengthen greenhouse warming until
the feedback is slowed as most of the readily available inert carbon in the Earth System has been burned and converted into greenhouse gases; or
some currently unknown process will kick in at some point on the temperature scale that allows Earth to shift its radiation balance from absorbing more solar energy than it can emit to emitting as much or more heat energy than the solar energy it is absorbing.
Earth’s geological record shows several heat spikes occurred over an ‘instant’ of geological time (e.g., the End Permian is the most obvious case) where global temperatures peaked so fast that most life on the planet could not adapt genetically fast enough to survive when their physiological limits were exceeded — resulting in global mass extinction events. Given the exponential nature of feedback-driven processes, runaway warming could easily raise global temperatures by 10 or more degrees within a century or two, that large, slowly reproducing organisms like humans simply could not adapt to genetically in 5 or 10 generations. This is because the knowledge for genetic engineering and the capacity to make the very sophisticated high technology required would be lost in the very early stages of societal collapse.
Thus, if humans fail to stop and reverse global warming very soon, human extinction within a century or two is highly probable. At the very best a few subsistence hunters and gathers might survive along with a few other remnant species in far polar regions. However, their chance of surviving with an intact knowledge base, infrastructure, and resources for any kind of industrial or high technology would seem to be nil. Fossil fuels will have been burned up into greenhouse gases even assuming other mineral resources could be found within the still livable areas of the planet.
The truth is….
As grim and frightening as this prospect should be to anyone facing the future reality with a family of loved ones, humans as we know ourselves would be fully extinct with no progeny, or at best our heritage would be no more than a few implausible myths and fairy tales told around camp fires in a few tribes of hunters and gatherers……
The truth also is we have a choice…. If humans can start working together with enough determination and effort, we probably still can stop and reverse the warming…
Personally, I do not think we have passed the point of no return, but that we are already close enough to it that by implementing world-war scale global mobilization of people and industry, and the expenditure of massive resources we, still have the capacity to turn the warming process around. Human efforts might seem to be too piddling to have any effect on planetary scale processes. However, consider this…. Accidentally, without thinking, human activities have managed to increase atmospheric CO₂ concentration from around 316 ppm to 416 ppm since (around 30%) since controlled measurements began to be made in 1958; or from an inferred 280 ppm (around 49%) since the beginning of the industrial revolution as shown in the Featured Image – a snapshot showing growth since the beginning of the Industrial Revolution that began around 1750.
Given that humans were able to have this degree of impact on Earth’s atmosphere more or less by accident, to me it is reasonable to believe that with total mobilization of human and modern technological resource we have enough knowledge to stop and reverse the warming. If the alternative to doing nothing is extinction, there is a strong business case for doing whatever it takes to stop extinction, however much it costs.
Unavoidably an intensely political process will be required to achieve the necessary mobilization and expenditure of resources.
It seems to have taken the clear thinking of Greta Thunberg, a 16 year-old girl who concluded school was pointless as long as humans continued their blind ‘business as usual’ rush towards extinction.
Listen to Greta’s speech live at the World Economic forum in Davos 2019. Except for her reliance on the IPCC’s overoptimistic emissions budget, everything she says is spot on that even she, as a child, can understand the alternatives and what has to happen.
In other words, wake up! smell the smoke! see the grimly frightful reality, and fight the fire that is burning up our only planet so we can give our offspring a hopeful future. This is truly the only issue that matters. Even the IPCC’s hyperconservative Sixth Assessment Report that looks at climate change’s global and regional impacts on ecosystems, biodiversity, and human communities makes it clear we are headed for an existential climate catastrophe if we don’t stop the warming process.
In Greta’s words, “even a small child can understand [this]”. People hope for their children’s futures. She doesn’t want your hopium. She wants you to rationally panic enough to wake up, pay attention to reality, and fight the fire…. so our offspring can have some hope for their future.
In our present situation where most of our governments are still supporting and even funding fossil fuel production and use, the most effective actions we can take as individuals is to change our governments to prioritize action on climate change above all other things. Nothing else matters if we have no future….
States are probably even more important than the Federal Government where climate action is concerned
States permit, enable and regulate mining and production of fossil fuels, and many of the important sources of emissions. Planning, industrial, rural, public safety and others are all primarily state concerns where political and administrative decisions may have considerable impact on regulating carbon emissions. Thus, if you are concerned to influence how your state acts in relation to the climate emergency, you need to elect representatives who will do this rather than bow down to wealthy patrons and vested interests who want to protect their short-term profits rather than humanity’s longer-term future.
The Victorian state election on 26 November is our next opportunity to begin focusing our state parliaments on the need to prioritize climate action. For Victorian voters, this may be the most important vote you ever make: Do you support major parties in their business as usual financial and regulatory support of the fossil fuel industry, or will you vote for a minor party or independent who is clearly focused on promoting and facilitating climate action?
Applying your decision to preferential voting on the ballot
If you believe that our present Labor government or the Liberals will govern in your interests rather than protecting and supporting their patrons in the fossil fuel and related industries, then go with the flow and don’t concern yourself with the likely consequences of going down their fossil fueled road towards runaway global warming. On the other hand, if you think it is better to work for a sustainable future where your children and their children can hope for a happy life, Vote Climate One can help you elect a government that will actively lead and support this effort.
Our Climate Lens Traffic Light Assessment process will help you to do this most effectively in both houses of Parliament. Also, our Climate Sentinel News provides access to factual evidence about the growing climate crisis to support your thinking, In the May Federal Election, our Traffic Light Voting System made it easy to use factual evidence about where each candidate in your electorate ranks in relation to their commitment to prioritize action on the climate emergency. We have modified this for the Victorian State Election in November. Part of our assessment process asks independent candidates the following questions:
Peter Trusler’s Self Portrait: Reduction
If we can get climate savvy governments in power soon enough, we may be able to mobilize enough action to survive our accidental disruption of Earth’s Climate System so our kids and grandkids inherit a world they can live in…
Let’s hope that we can stop global warming soon enough to leave them with a future where they can survive and flourish
Featured Image. Annotated snapshot from the from the Trends in CO2 video above. The pre 1958 measurements in orange were made from trapped air bubbles in precisely dated ice cores cut from the Law Dome in Antarctica as explained on the Trends in CO2 website.
Views expressed in this post are those of its author(s), not necessarily all Vote Climate One members.
The UN’s World Meteorological Organization warns us that we have done nothing to slow the global warming caused by our carbon emissions.
Message from the UN’s Secretary-General in the article
Geneva, 13 September 2022 (WMO) – Climate science is clear: we are heading in the wrong direction, according to a new multi-agency report coordinated by the World Meteorological Organization (WMO), which highlights the huge gap between aspirations and reality. Without much more ambitious action, the physical and socioeconomic impacts of climate change will be increasingly devastating, it warns.
The report, United in Science, shows that greenhouse gas concentrations continue to rise to record highs. Fossil fuel emission rates are now above pre-pandemic levels after a temporary drop due to lockdowns. The ambition of emissions reduction pledges for 2030 needs to be seven times higher to be in line with the 1.5 °C goal of the Paris Agreement….
If you are concerned about this visibly escalating climate emergency, but think there is nothing you can do about it, think again!
Major political parties primarily represent the vested interests who fund their candidates and election campaigns and work hard to protect their patrons. Many of these include rich fossil fuel and related industries (many based overseas) who would be harmed by climate action. As single individuals, we have been powerless to change the world against the political might of the ‘patrons’ and their government puppets…. But where your local communities and governments can coordinate together with a common goal to elect governments responsive to their citizens, we CAN change the world.
However, even with Greens support, Labor is still one short of a majority in the Senate. This gives Pocock, a community independent, the deciding vote. As an immigrant rugby player from New Zealand, arguably he has become the most important senator in the Australian Parliament where climate action and integrity are concerned — selected, supported and endorsed by the Climate Change the local ACT community independently from the discipline of any political party.
If you and your local community are unhappy with the way your sitting state or federal parliamentarians are representing your interests, the teal community independents can show you how to empower your communities to change that.
Work with your friends and neighbors to decide what you want from your representative(s) in government, select someone from your community to stand for election, support their campaign, and then vote them into office. My research as Editor of Climate Sentinel News, documents in detail how this works, and introduces the fabulous support network that the the successful teal community independents have developed to help empower other communities to become independent of the special interests supporting major party candidates:
A rising tsunami of teal independents is transforming our democracy representing special interests to a participatory democracy of community representatives.
As noted in my many posts to Climate Sentinel News, it is becoming increasingly evident that humanity on our only planet faces near term extinction if we don’t manage to stop and reverse the global warming process we have started through our profligate burning of fossil fuels. Their emissions are preventing the Earth from radiating away excess solar energy. This imbalance between incoming and outgoing heat energy causes the world to grow warmer. Unfortunately the problem is global and can only be solved on a global scale through the cooperation of governments – which makes it unavoidably political.
The difficulty of solution is only compounded by the fact that the unimaginably rich global fossil fuel industry has been fighting for decades to disrupt and stop effective actions against global warming/climate change to protect their sources of income from the burning of fossil fuels causing the emissions. Even the supposedly most ‘democratic’ governments have been corrupted so they represent the patrons and special interests (mostly fossil fuel industry related) who support and fund major political parties. This influence is so strong that I have been deeply pessimistic that our governments would ever be able to work effectively to combat climate change and stop our progress along the runaway warming road to extinction.
However, the results of Australia’s May 21 Federal Election provide evidence that Australia has begun to transform its government into one truly representing the substantial majority of voters who want action on climate change to be prioritized above any other issue. Finally there is scope for some genuine optimism that our government(s) will actually work seriously to resolve the climate issues….
The featured image heading this post and the video below show the most recent and best documented evidence that nothing humans have done to date has significantly slowed the accelerating rise in global temperatures driving by rising greenhouse gas concentrations from or directly triggered by human activities. If nothing is actively done on a global scale to stop and reverse these increases, it is inevitable that within a few more decades that our planet will have become uninhabitable to humans and the other living resources we need for our survival.
The graphs above and the video here are pretty clear. Objective measures of our planetary atmosphere show that we have done nothing yet in the world that is changing this prediction.
The video from the US National Oceanic and Atmospheric Administration (NOAA) Global Monitoring Laboratory shows the historical fluctuations in CO2 concentrations in the atmosphere we breathe over the last 800,000 years. It begins in 1979 when detailed daily tracking of atmospheric greenhouse gas concentrations began in a serious way across the globe using both physical sampling and measurements combined with satellite remote sensing. The inset map shows sampling locations, the fluctuating line plots CO2 concentrations by distance of the location south or north of the Equator and the graph shows annual fluctuations and the year-by-year rise in the average concentration for the year up through 2021.
When the present is reached, the x-axis of the graph is extended backwards in time from 1979 using a variety of measurement tools, mostly the CO2 concentration in bubbles of atmospheric gas trapped in bubbles of gas frozen into glacial ice from Antarctica. (The modern and ice-core measurements overlapped for long enough to demonstrate that the different sampling technologies were giving the same results.)
Until now I have been quite pessimistic that adequate action would ever be taken to reverse the trends shown on these graphs as our governments will continue greasing the downhill slide into the death and chaos of global mass extinction.
Community independents and Greens know how to change that, and have shown that they actually have the knowledge and ability to cancel remove the power of major political parties to block effective action.
Action is required! Simply voting for a Party may not ensure our survival (or may even speed our demise). Learn how to Vote Climate One!
I am now decidedly optimistic that humans have the knowledge and power to stop the ultimately lethal processes we have accidentally triggered in our profligate burning of Earth’s carbon resources. All it takes is a willingness for communities to be come fully involved in their own interests in avoiding the extinction of their families and heritage.
If you don’t think a major party you have voted for in the past truly represents your interests (rather than those of their immensely wealthy patrons — who may not even be Australian), Vote Climate One will show you how to maximize the chances that your vote will help to elect someone who will actually represent your community interests. See our Vote Climate One page on Voting Guides. At the moment this reflects the past Federal Election, but it will give the idea of the kind of analysis and information we will provide for the Victorian state election in November. The Victorian State Election guide will not be finalized before Sunday Nov.13th when the Victorian Electoral Commission releases the final list of candidates for each electorate. Prepolling starts on Monday Nov. 14th. We should have draft versions of the Victorian guides on-line around the beginning of November.
If you want to maximize the chances that your vote will actually count towards electing a government that will prioritize acting on climate first, we’ll do the work to make it easy for you to vote effectively.
Listen to Greta’s speech live at the World Economic forum in Davos 2019. Except for her reliance on the IPCC’s overoptimistic emissions budget, everything she says is spot on that even she, as a child, can understand the alternatives and what has to happen.
In other words, before you cast your ballot: Wake up! Smell the smoke! See the grimly frightful reality; and fight the fire that is burning up our only planet so we can give our offspring a hopeful future. This is the only issue that matters. Even the IPCC’s hyperconservative Sixth Assessment Report that looks at climate change’s global and regional impacts on ecosystems, biodiversity, and human communities makes it clear we are headed for an existential climate catastrophe if we don’t stop the warming process. To do this our governments must accept the reality, and work effectively to plan and coordinate the necessary mobilization and action. YOUR VOTE IN THE VICTORIAN ELECTION CAN HELP ENSURE THAT THIS HAPPENS: Vote Climate One in November!
No evidence here that humans have done anything yet to stop and reverse GHG emissions to get us off the road to Hothouse Earth and global mass extinction.
As the ocean ice around Antarctic approaches its maximum spread for the year, on 19 August 2022 Antarctic sea-ice extent is the second lowest ever as recorded in the satellite era as recorded by the US National Snow & Ice Data Center. As sunlight again begins to shine on the antarctic polar region more of the ocean surface is exposed to solar heating that will warm the waters surrounding the ice cap to speed glacial melting and slow the formation of more sea-ice next winter.
July’s trends in global warming continue in August. Heatwaves, fires, and droughts in the Northern Hemisphere continue, e.g:
In the run-up to Australia’s May 22 Federal Election many articles on our Climate Sentinel News documented the reality, mechanisms and dangers humans face if global warming is allowed to continue. If global warming runs away due to already documented feedback mechanisms heating will continue at an accelerating rate that will soon rise beyond the capacity anything humans can do to stop it.
Critical time is wasting. It is time for all of our politicians, new and old to lead our country in massive mobilization to stop carbon emissions and start implementing carbon capture and sequestration processes able to extract excess amounts from the atmosphere. Biological processes are likely to scale up a lot more successfully than engineering solutions. Geoengineering to increase Earth’s reflectivity (i.e., albedo reduction) may also help. We know how to stop emissions, but sequestration and albedo reduction will require significant research that needs to start now.
TIME IS OF THE ESSENCE, AND THE URGENCY GROWS WITH EVERY DAY OF DELAY!
Featured image: See July’s report for details.
Views expressed in this post are those of its author(s), not necessarily all Vote Climate One members.
Australia has a new government. Every month we fail to stop global warming is a month closer to global mass extinction. Still no visible progress towards solution.
The graphic above downloaded today shows the current state of sea-ice surrounding the Antarctic continent. Despite what seems to be a cold winter in Victoria, its coverage indicated by the teal blue line in the chart is 530 km2 smaller than it has ever been before for this time of the year. There are many more indicators that the climate is still deteriorating towards making Earth uninhabitable for its present life forms (including humans!) at an accelerating rate.
The following news items underline the dangers this represents for humans.
Model-analyzed temperatures at 12Z Tuesday, July 19, 2022 (noon GMT) were transcending average values for the time of day and season by 12 to 24 degrees Celsius—or 22 to 33 degrees Fahrenheit—over large parts of northwestern Europe. (Image credit: tropicaltidbits.com) [from the article]
by Bob Hensen, 17/07/2022 in Eye on the Storm, Yale Climate Connections
Dozens of all-time record highs melted on Monday and Tuesday under a searing, deadly European heat wave that has caused at least 1,169 heat-related deaths in Spain and Portugal. The heat wave has also brought the hottest day on record for many locations in France and the hottest temperatures — by far — ever observed in the United Kingdom.
The record-smashing heat in Europe’s normally mild, maritime northwest corner was eerily comparable to the astounding heat wave in the U.S. Pacific Northwest and far southwest Canada in June 2021. The latter was found to have been “virtually impossible” without human-produced climate change.
By 9 a.m. GMT on Tuesday, July 19, London’s Heathrow Airport had already surged past 90°F, and at 12:50 p.m., the airport’s official observing site for London recorded what, if confirmed, would be the hottest temperature in London history: 40.2 degrees Celsius, or 104.4 degrees Fahrenheit.
Blistering heatwaves are just the start. We must accept how bad things are before we can head off global catastrophe, according to a leading UK scientistRobin McKie.
The publication of Bill McGuire’s latest book, Hothouse Earth, could not be more timely. Appearing in the shops this week, it will be perused by sweltering customers who have just endured record high temperatures across the UK and now face the prospect of weeks of drought to add to their discomfort.
And this is just the beginning, insists McGuire, who is emeritus professor of geophysical and climate hazards at University College London. As he makes clear in his uncompromising depiction of the coming climatic catastrophe, we have – for far too long – ignored explicit warnings that rising carbon emissions are dangerously heating the Earth. Now we are going to pay the price for our complacence in the form of storms, floods, droughts and heatwaves that will easily surpass current extremes.
In the run-up to the May 21st Federal Election, I posted many more articles documenting the increasing risk of mass extinction that humans face if we do not stop and reverse the runaway acceleration that is flipping our global climate to the Hothouse Earth state.
In the Election Australians replaced the Liberal/National COALition with a more climate friendly Labor government supported by an extensive cross-bench of climate-friendly independents (‘teals‘) and Greens.
The Government has very little time (if any – see the article above) to act to stop carbon emissions and to do what we can to remove some of the past excesses from the atmosphere.
TIME IS OF THE ESSENCE!
Featured image:
Time series graphs showing the variation in the three most important greenhouse gases as observed and recorded by the US National Oceanic and Atmospheric Administration, Global Monitoring Laboratory at Mauna Loa Observatory, Hawaii.
The carbon dioxide data on Mauna Loa shown in the top row constitute the longest record of direct measurements of CO2 in the atmosphere. They were started by C. David Keeling of the Scripps Institution of Oceanography in March of 1958 at a facility of the National Oceanic and Atmospheric Administration [Keeling, 1976]. The first graph shows atmospheric CO2 concentrations over the last five complete years of the Mauna Loa CO2 record plus the current year. The second graph shows annual mean CO2 growth rates for Mauna Loa. In the graph, decadal averages of the growth rate are also plotted, as horizontal lines for 1960 through 1969, 1970 through 1979, and so on.
The middle row charts the growth of atmospheric methane: the first graph shows the full NOAA time-series starting in 1983, The red circles are globally averaged monthly mean values centered on the middle of each month. The black line and squares show the long-term trend (in principle, similar to a 12-month running mean) where the average seasonal cycle has been removed.The second graph summarizes annual increases in atmospheric CH4 based on globally averaged marine surface data.
The bottom row charts the growth of atmospheric N2O (Nitrous oxide) beginning in 2001, when NOAA began to have confidence in the data. Values for the last year are preliminary pending recalibrations of standard gases and other quality control steps. The second graph plots the annual increase in atmospheric N2O in a given year, i.e., the increase in its abundance (mole fraction) from January 1 in that year to January 1 of the next year, after the seasonal cycle has been removed (as shown by the black lines in the first figure). It represents the sum of all N2O added to, and removed from, the atmosphere during the year by human activities and natural processes.
As yet, there is NO evidence that any of these values are beginning to stop increasing, let alone decrease, as the result of any human actions.
Views expressed in this post are those of its author(s), not necessarily all Vote Climate One members.
A major challenge in communicating complex messages about climate change is that the more simplified media reports of these events often have more influence than the science itself.
This worries observers who argue that giving countries the impression that emissions can continue to grow until 2025 would be a disaster for the world.
“We definitely don’t have the luxury of letting emissions grow for yet another three years,” said Kaisa Kosonen from Greenpeace.
“We have eight years to nearly halve global emissions. That’s an enormous task, but still doable, as the IPCC has just reminded us – but if people now start chasing emissions peak by 2025 as some kind of benchmark, we don’t have a chance.”
Editor’s note: Based on my rigorous evaluation of the IPCC’s scientific methodology and writing processes, even the corrected understanding of the IPCC report STILL UNDERSTATES the likelihood of the risk from, and the magnitude of consequences of failures or even delays in stopping the progress of global warming. In reality, the report says it is already too late to avoid global average temperatures rising more than 1.5 °C. By reaching net zero in 2030 AND extracting and sequestering most of the excess CO₂ already in the atmosphere we might be able to bring temperatures back down to 1.5 °C or less. Continuing with business as usual keeps us on the road to runaway warming to Earth’s Hothouse Hell and social collapse leading towards global mass extinction of humans and most other large and complex organisms on the planet.
Featured Image: A dried out reservoir in Chile where drought has forced the government to take emergency measures. / Getty Images / from the article.
Views expressed in this post are those of its author(s), not necessarily all Vote Climate One members.

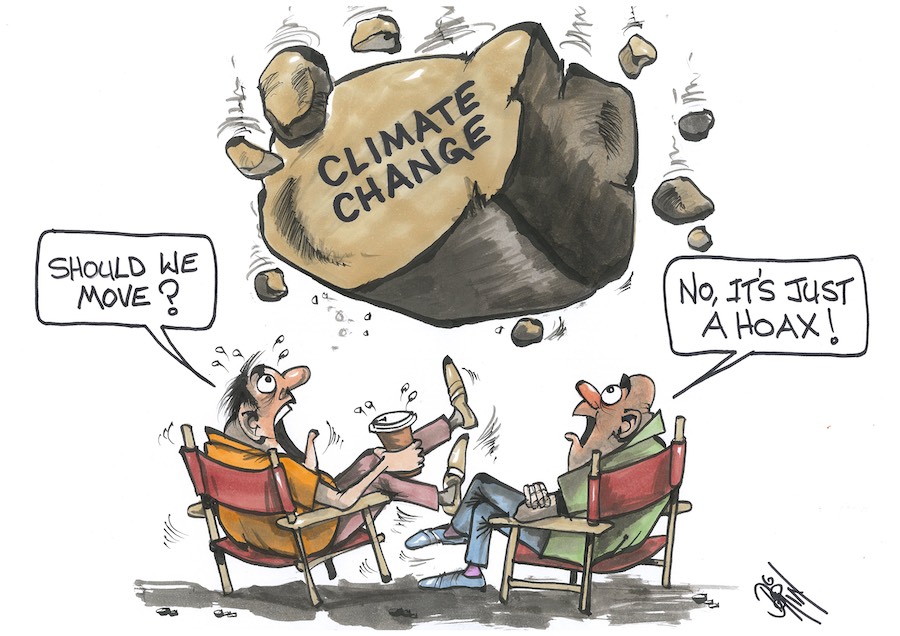
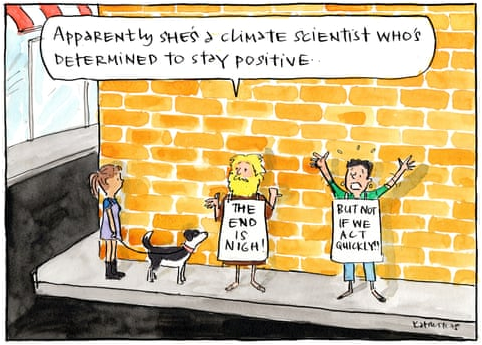

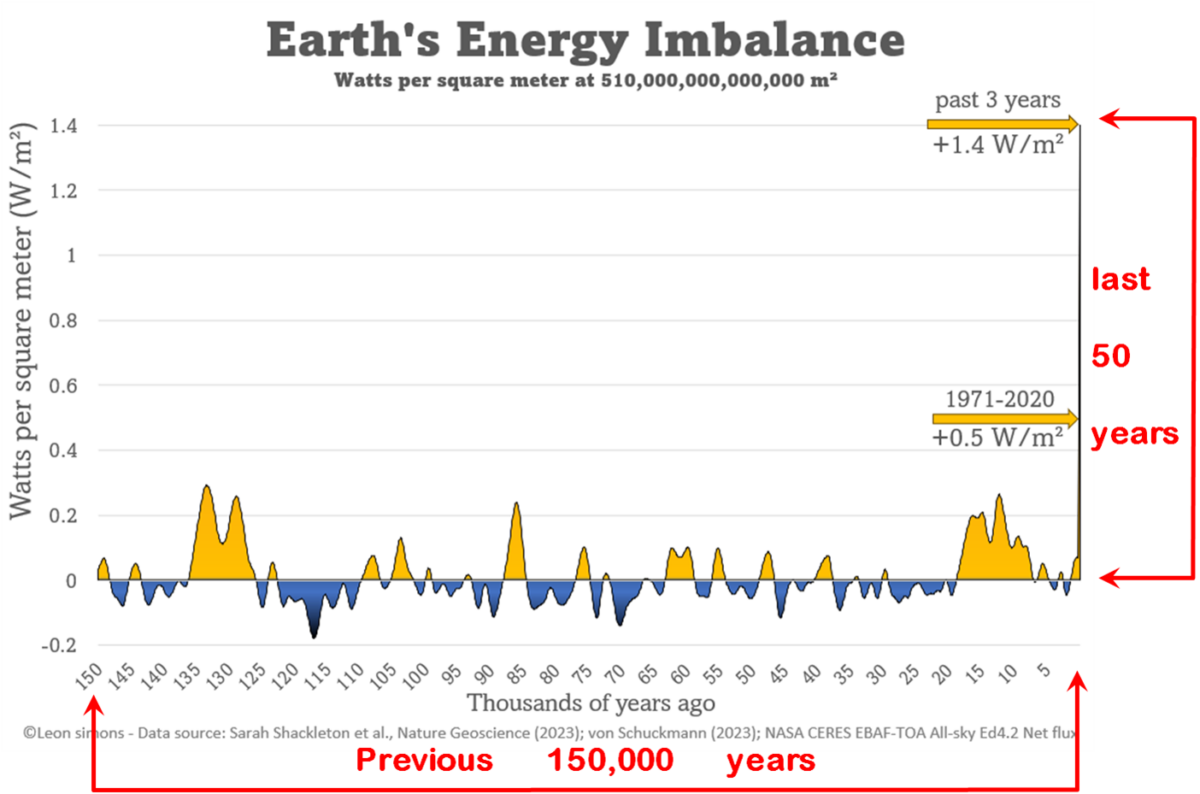
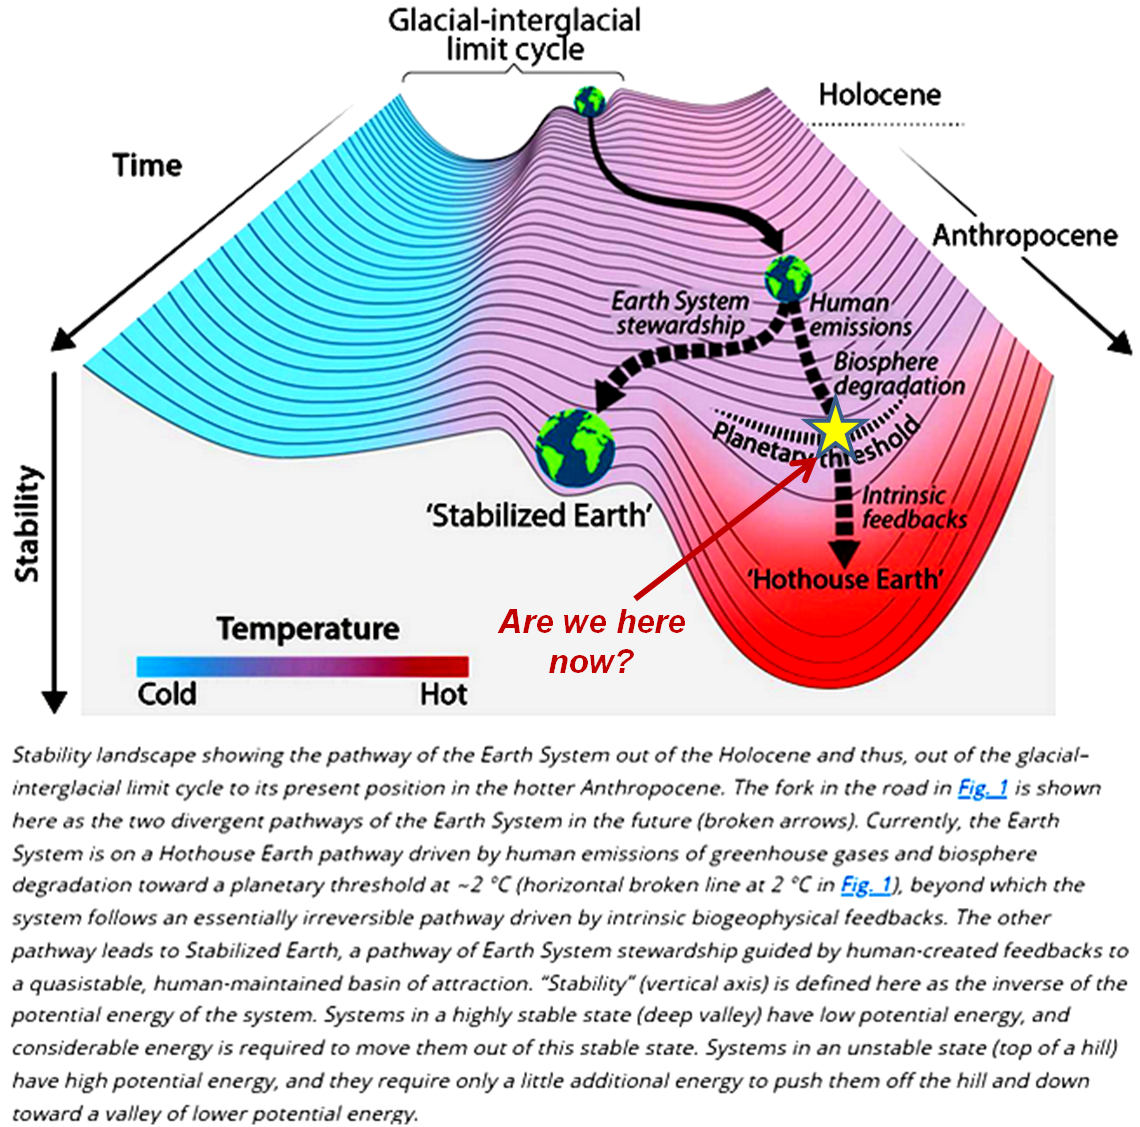

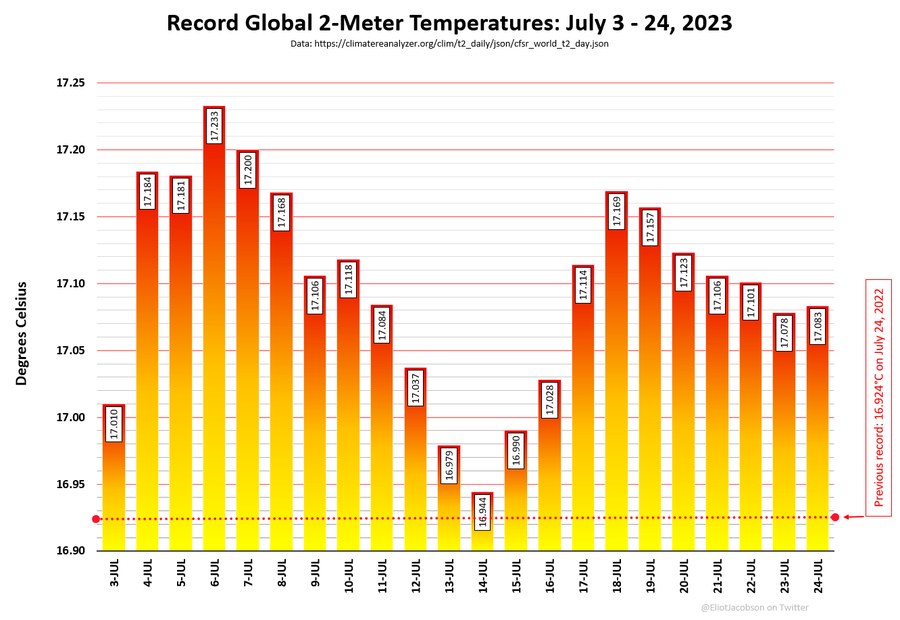

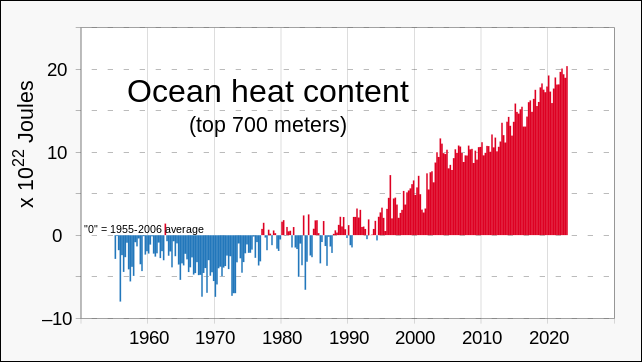
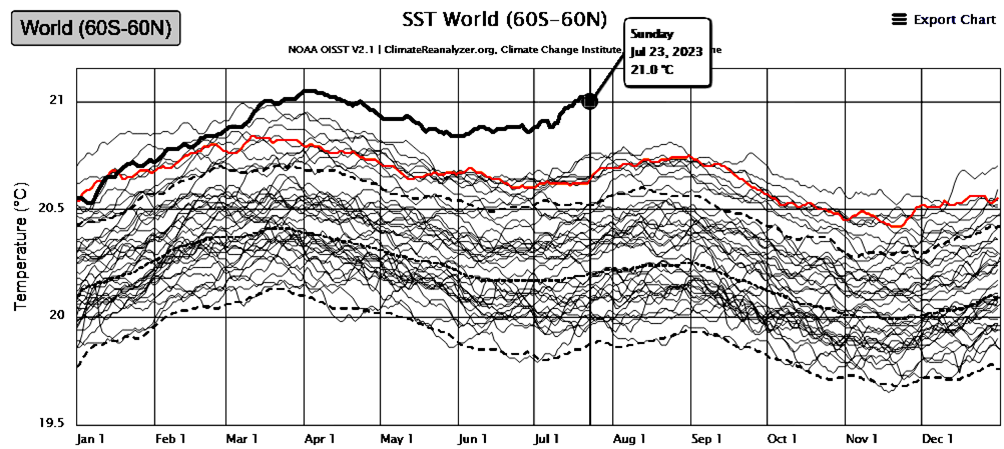


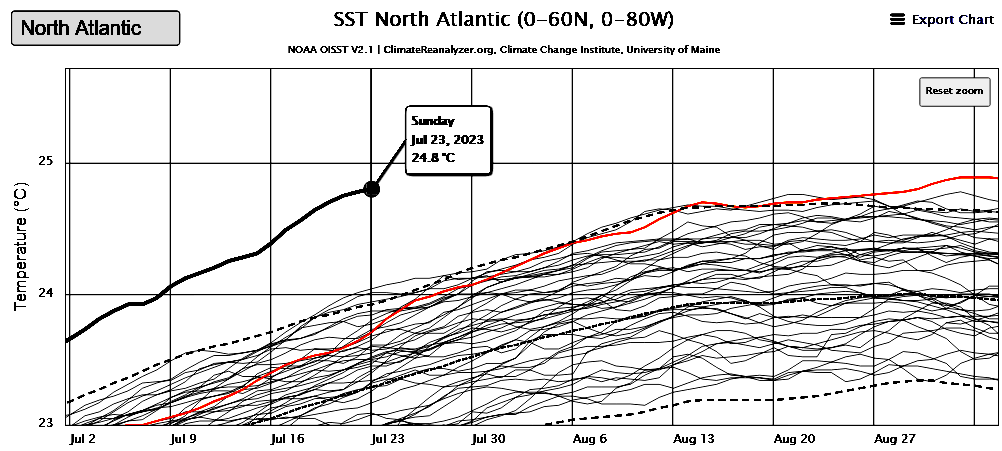

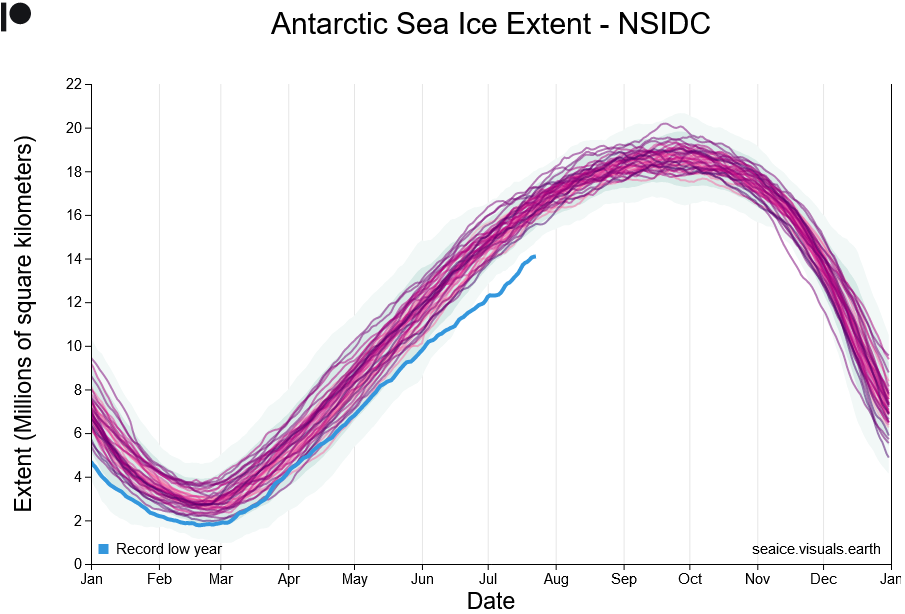
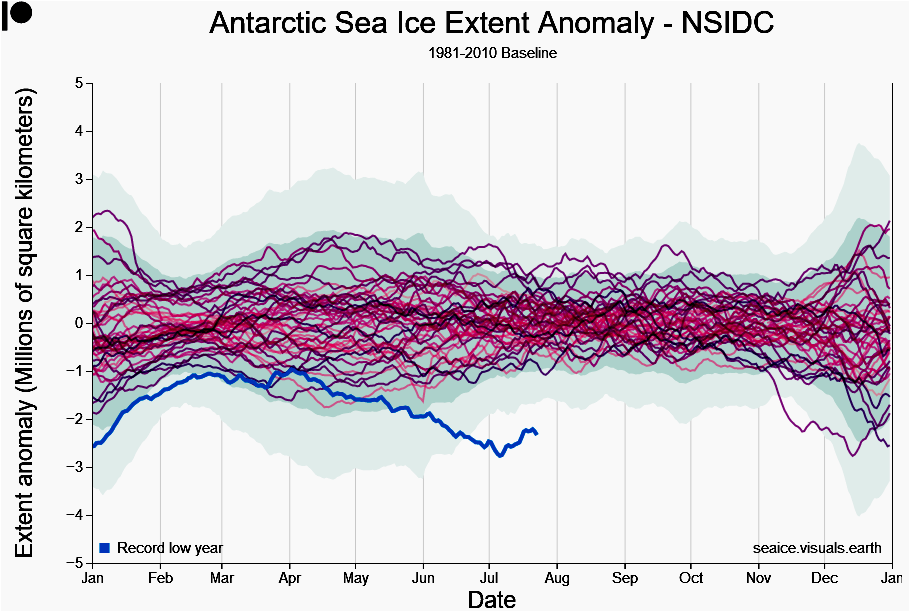
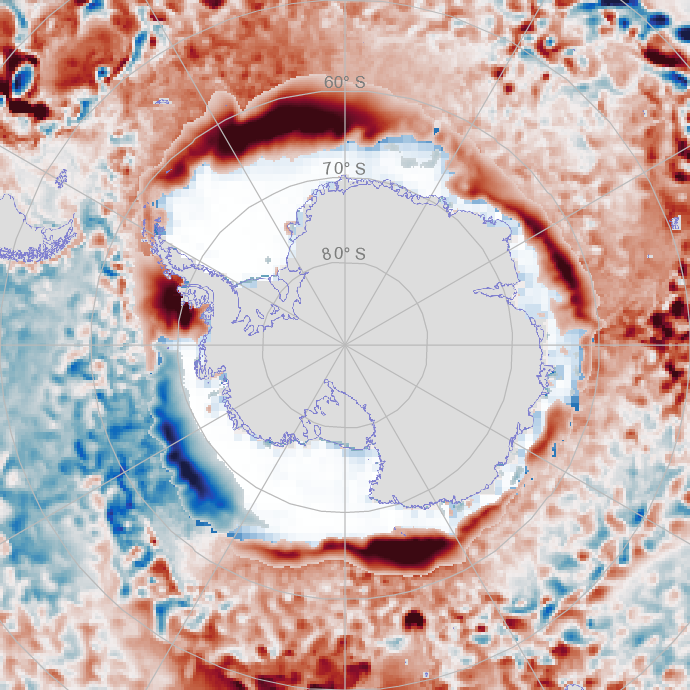

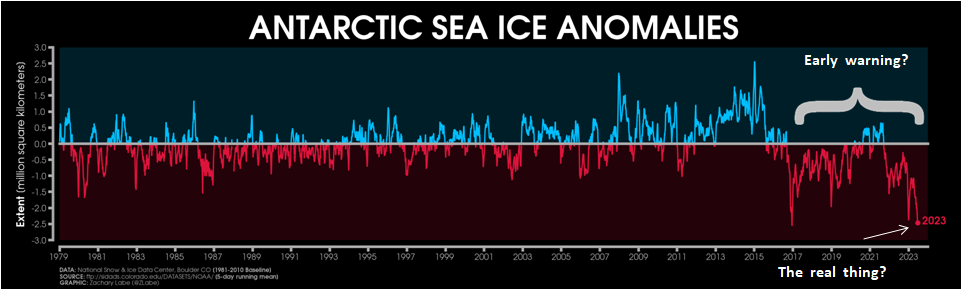

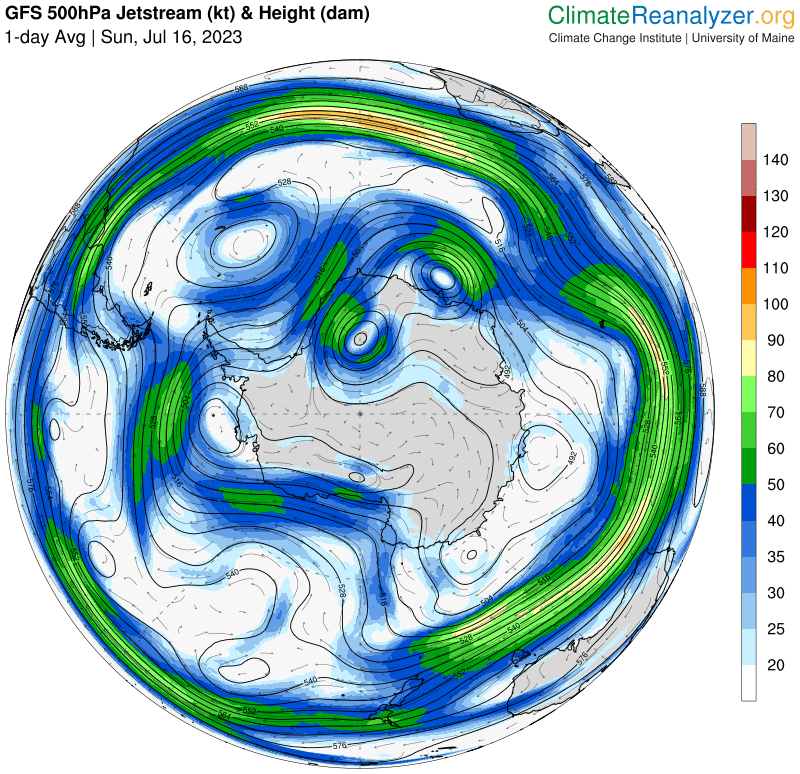
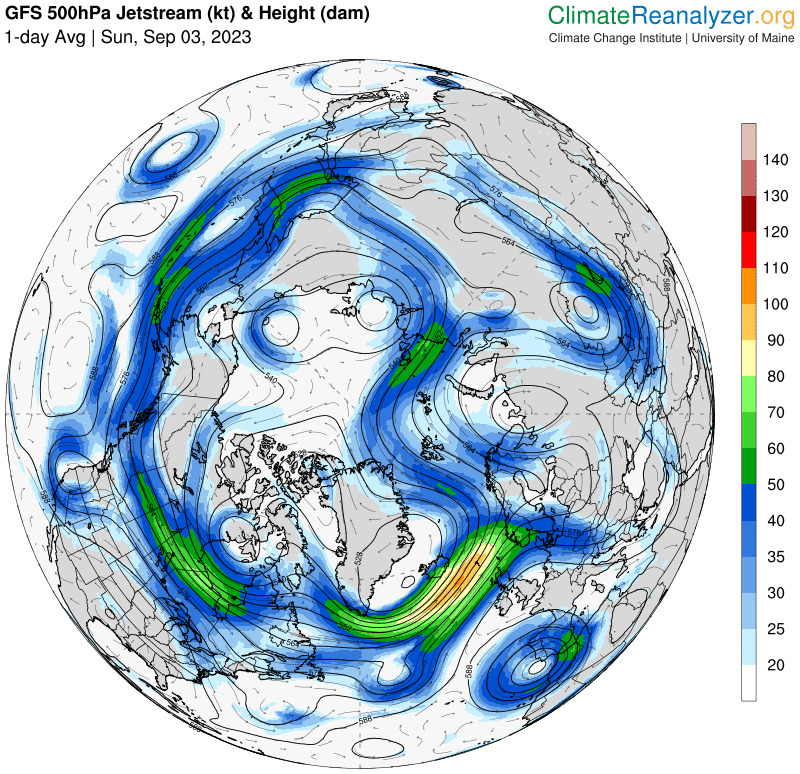
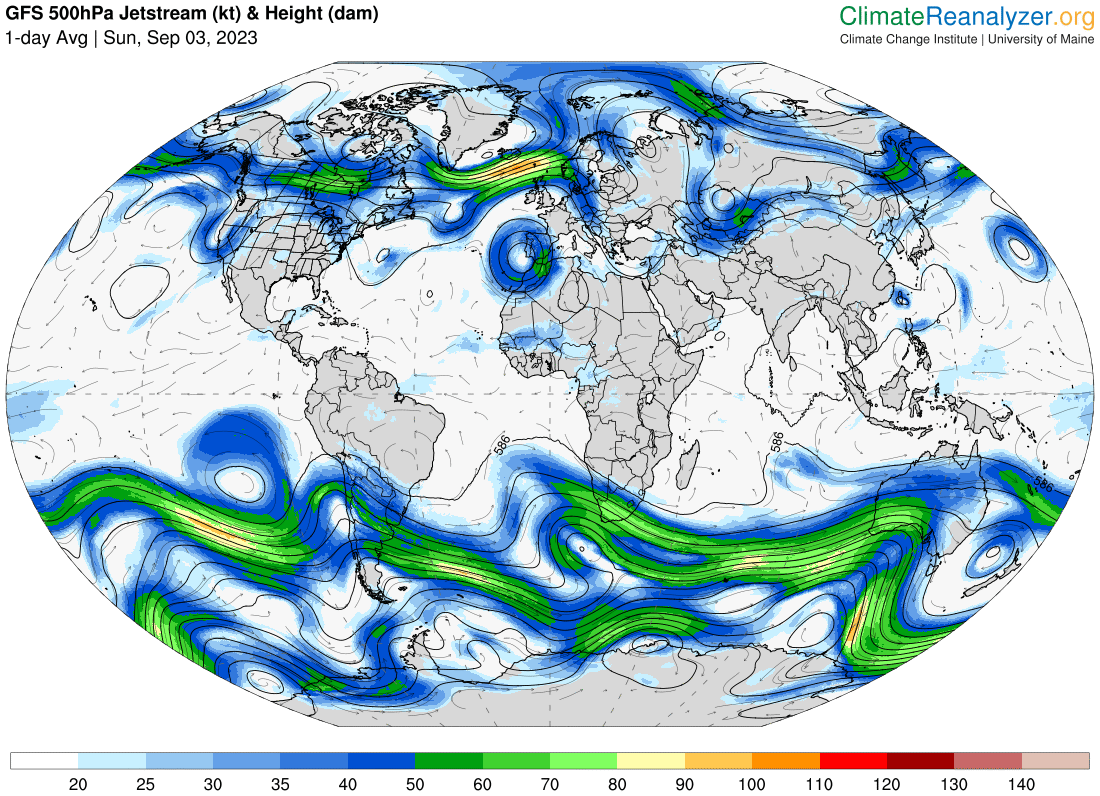
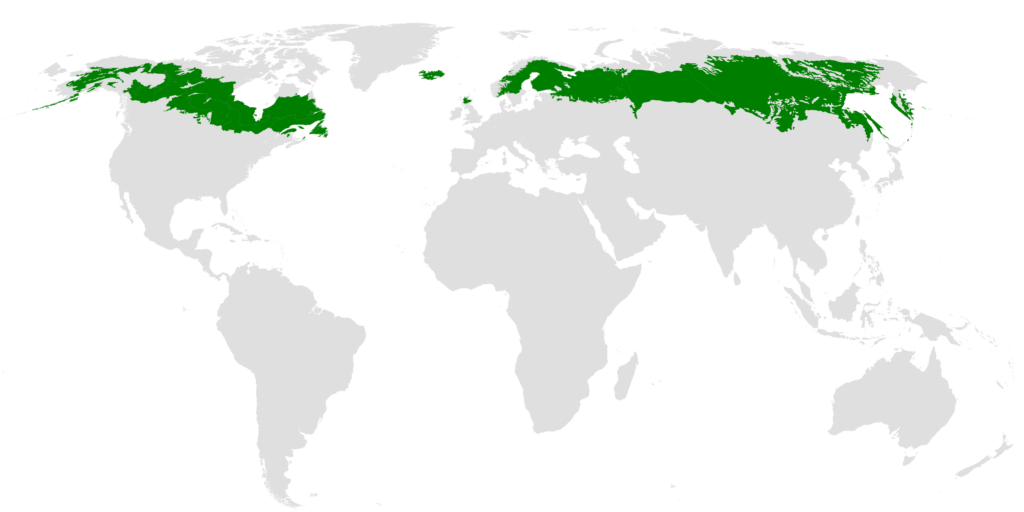
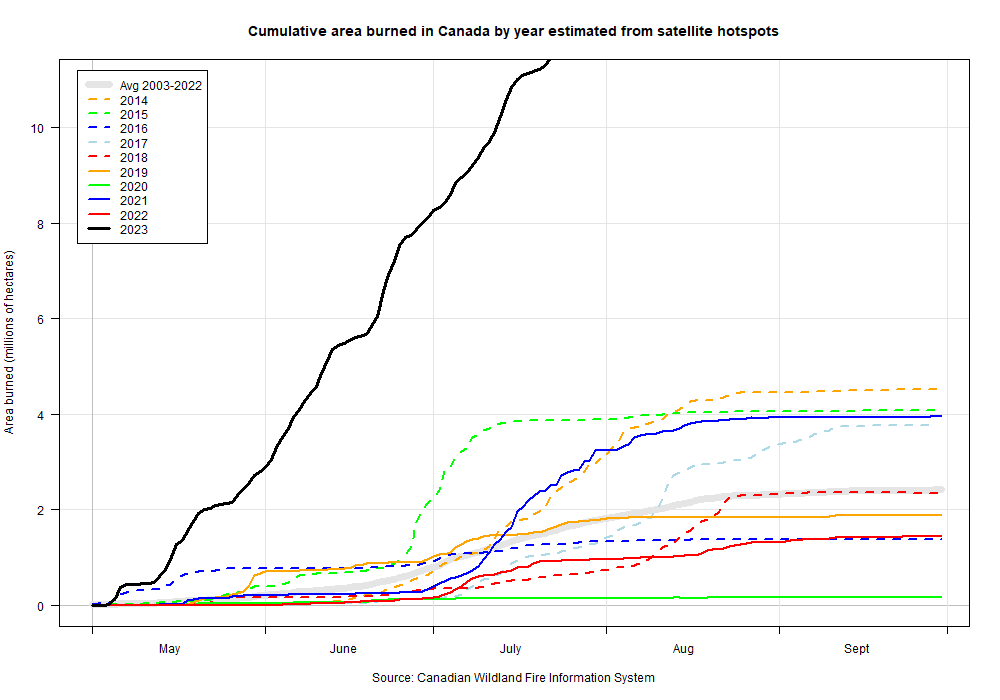
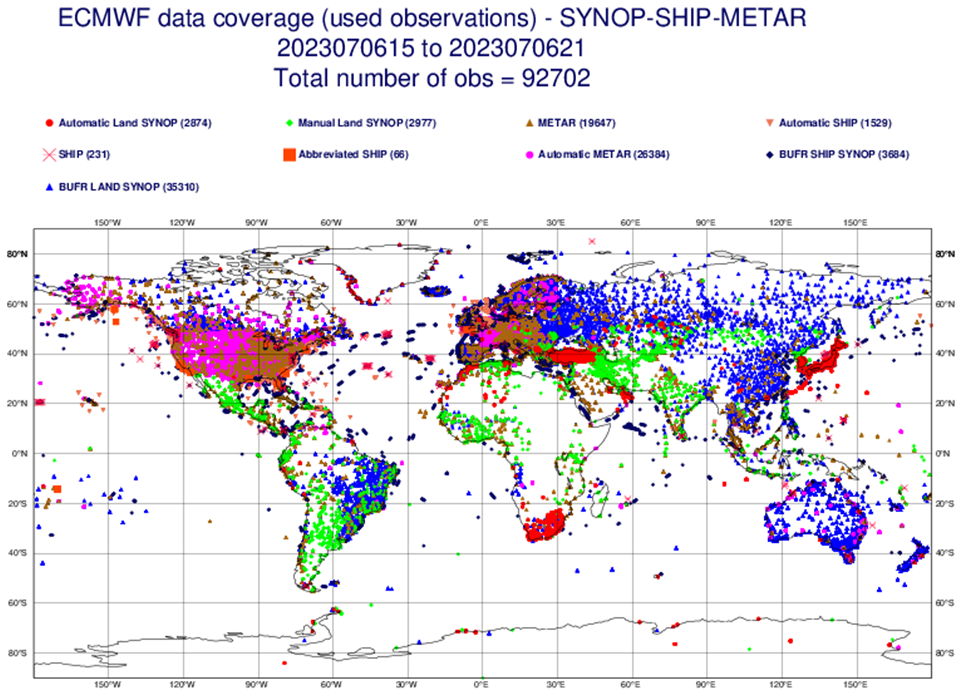
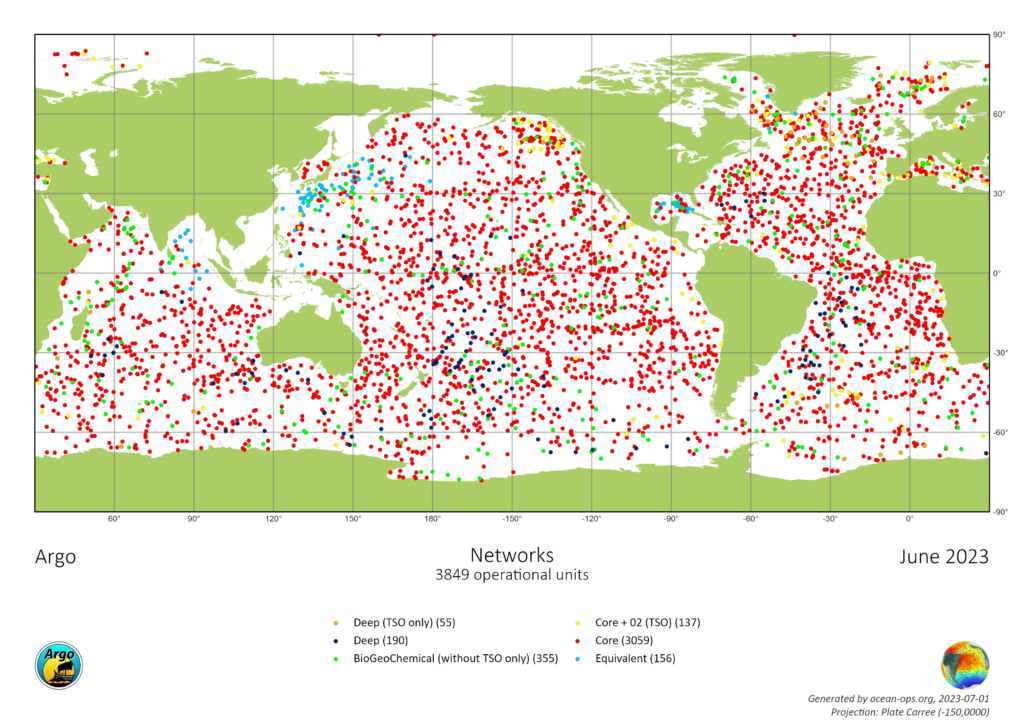
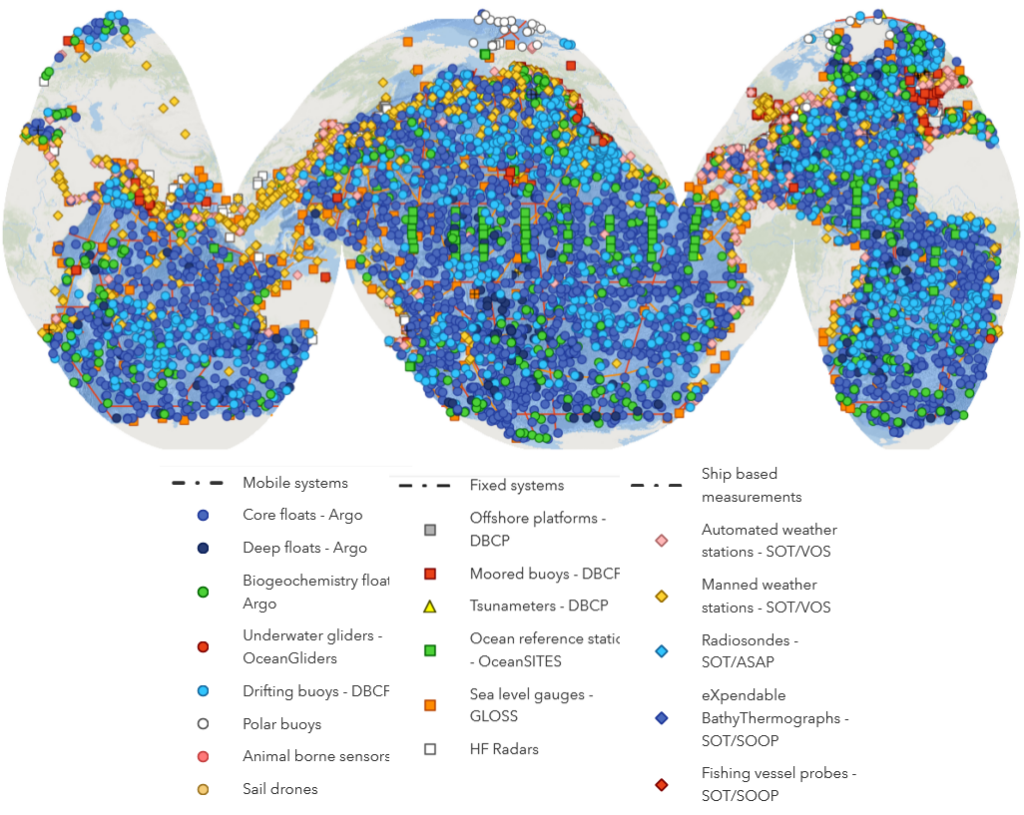
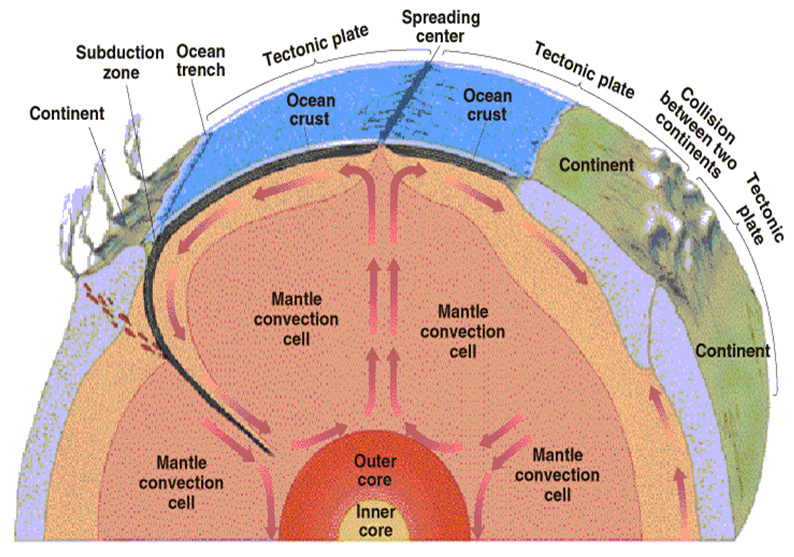

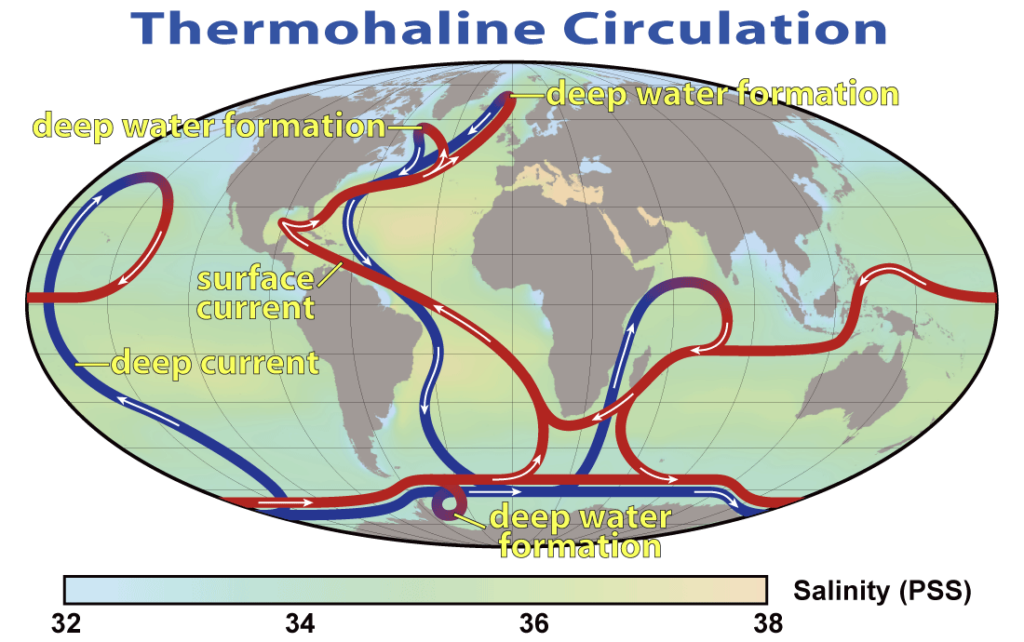
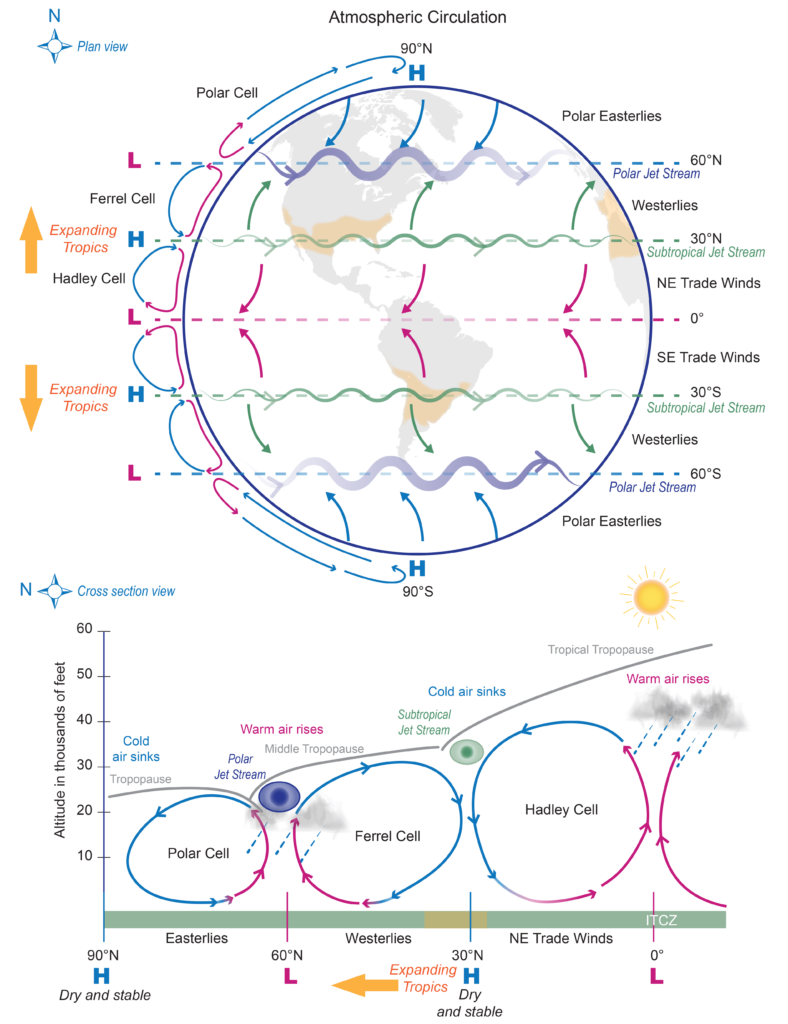
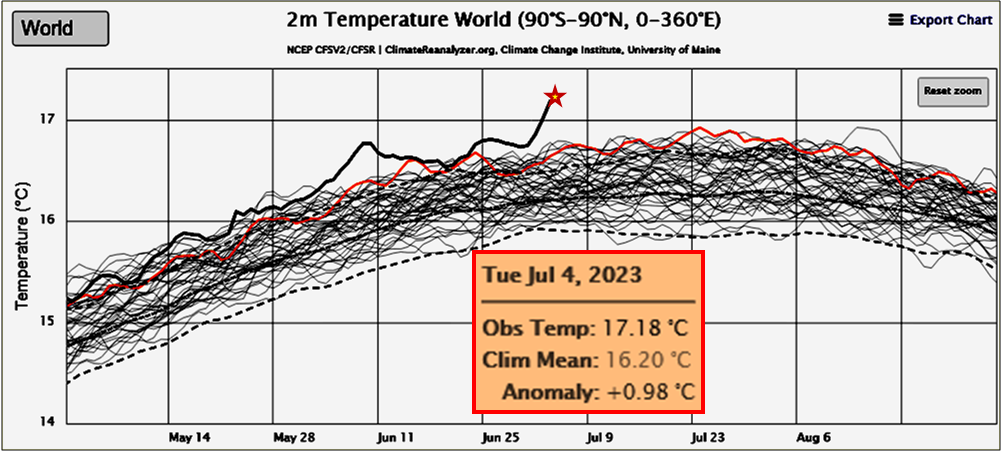
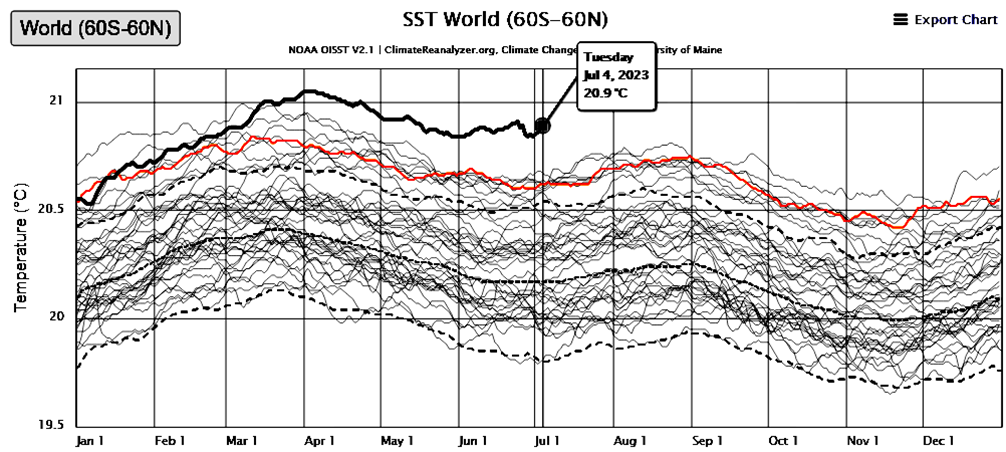
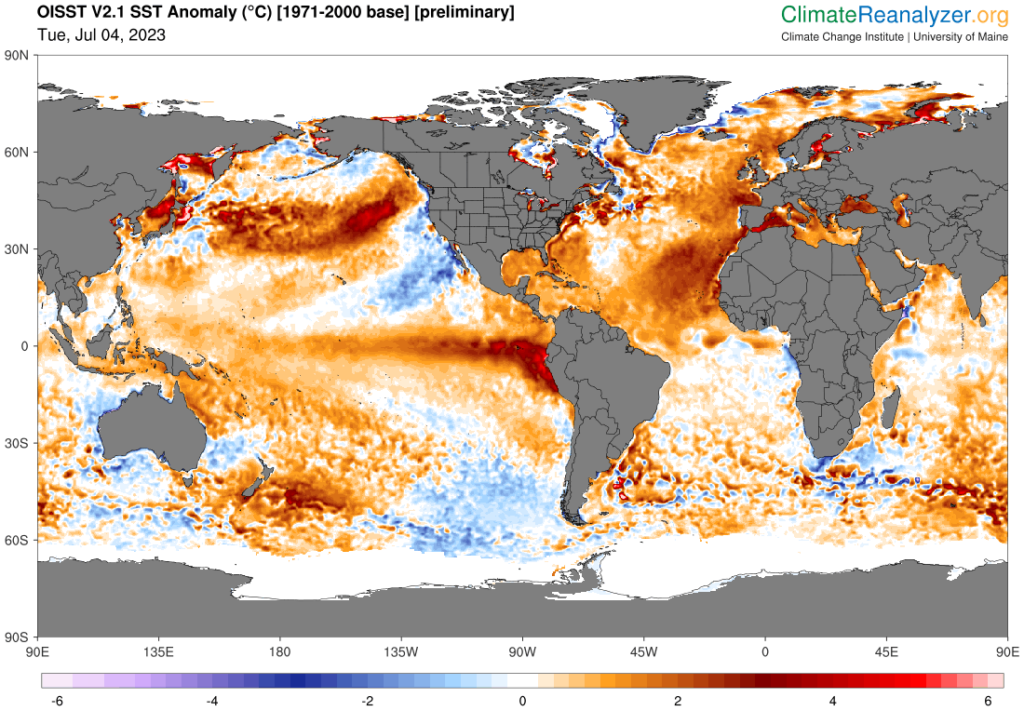
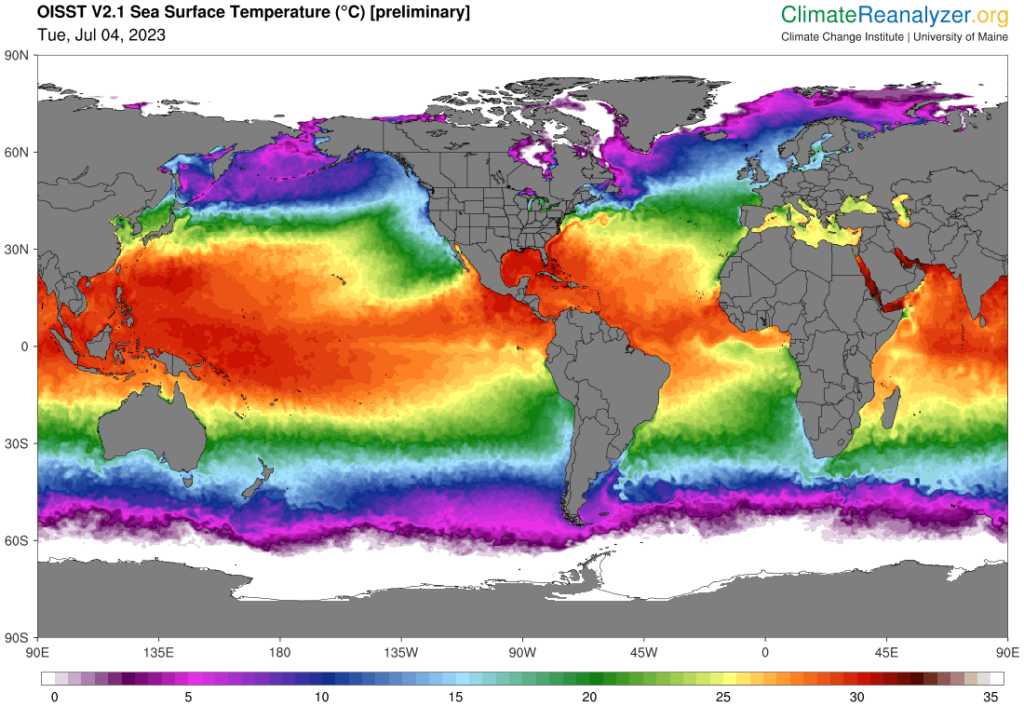

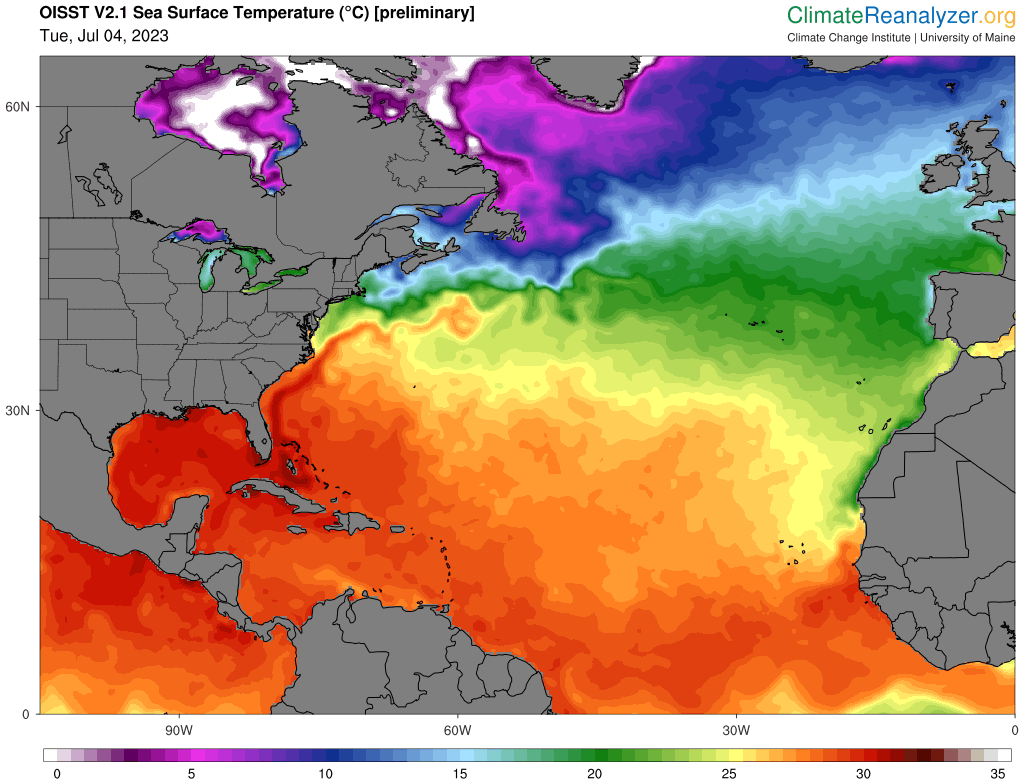
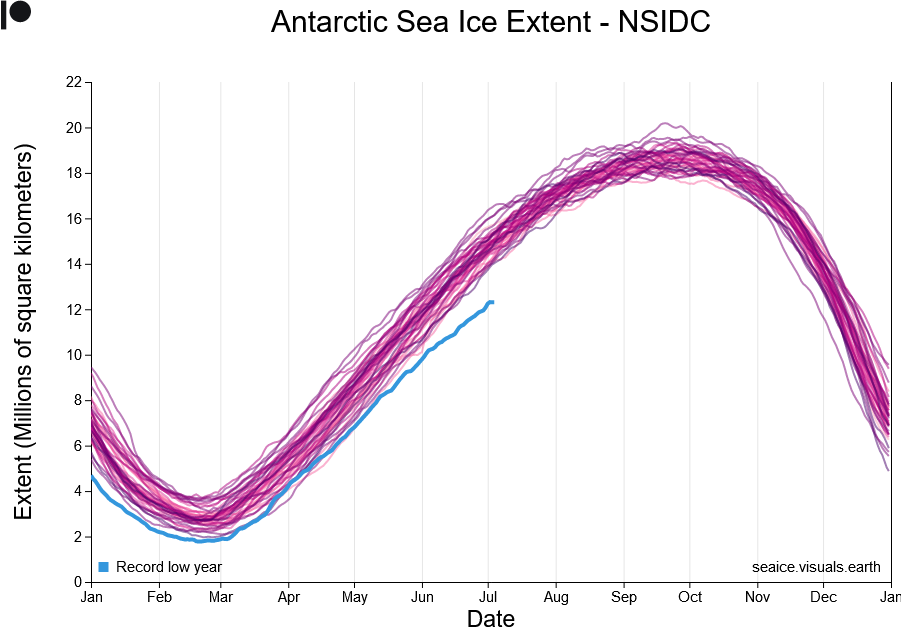
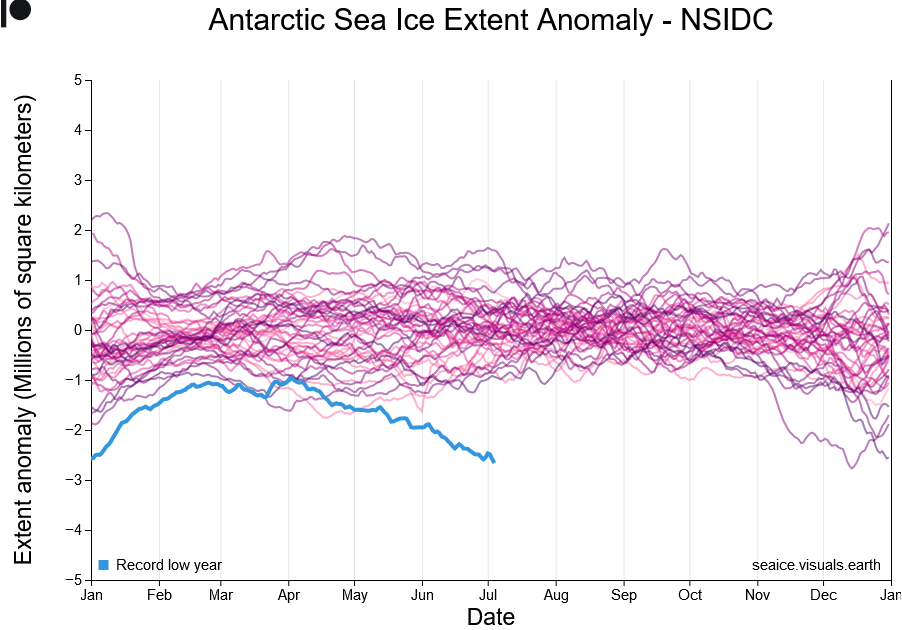
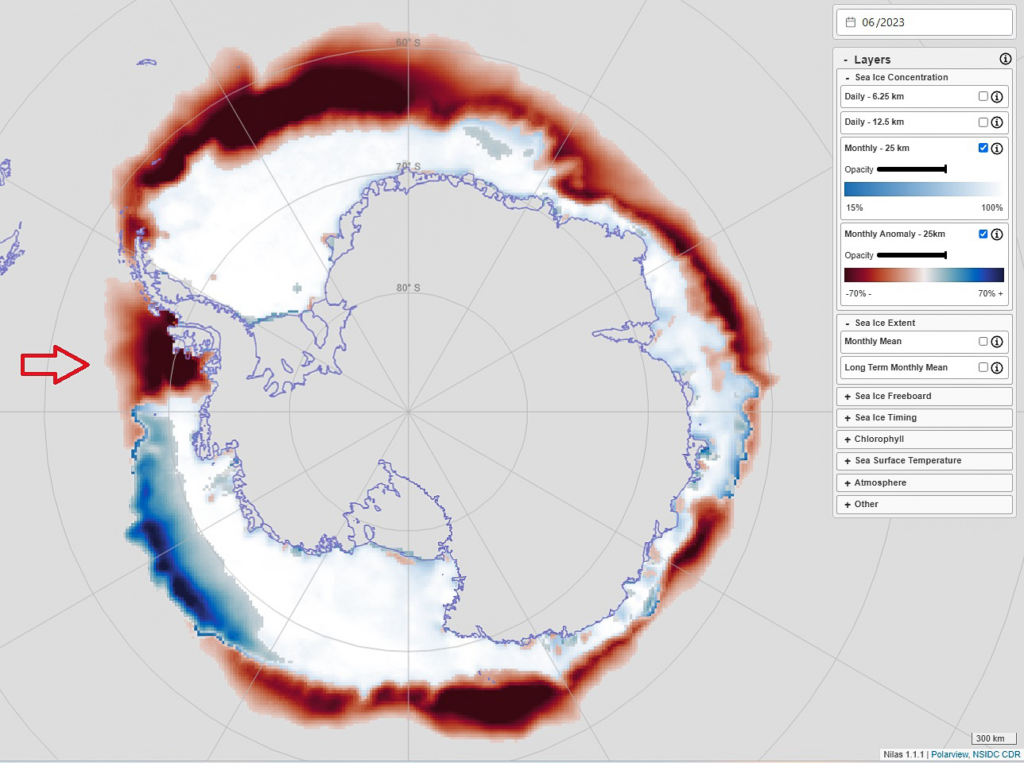
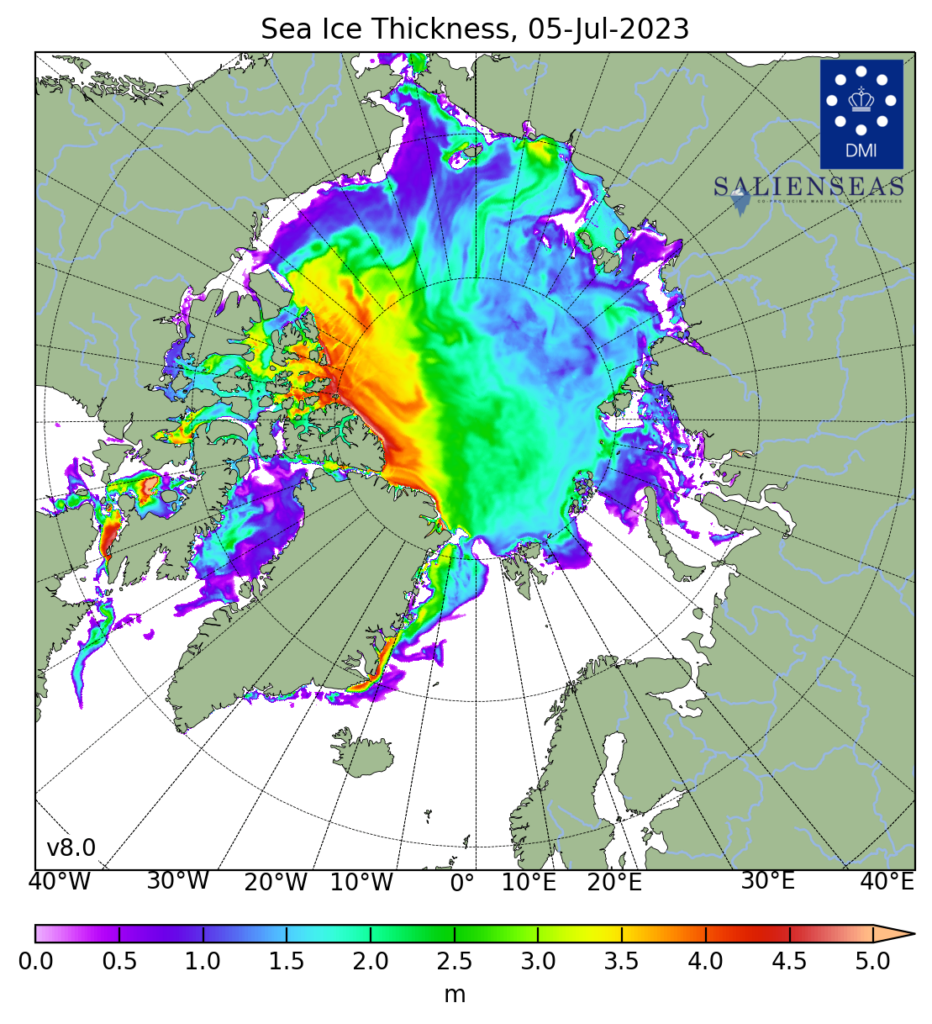
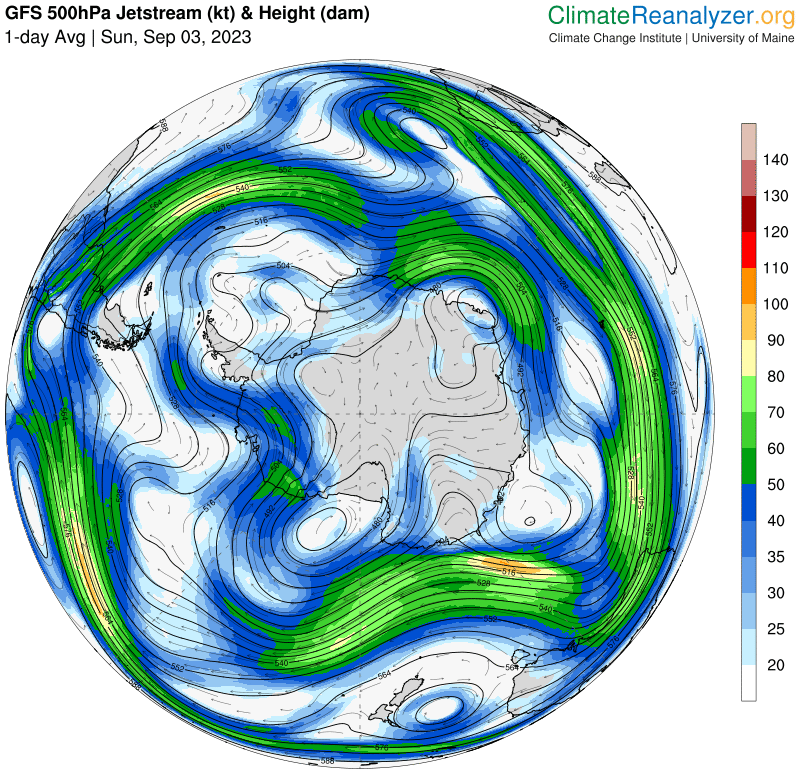
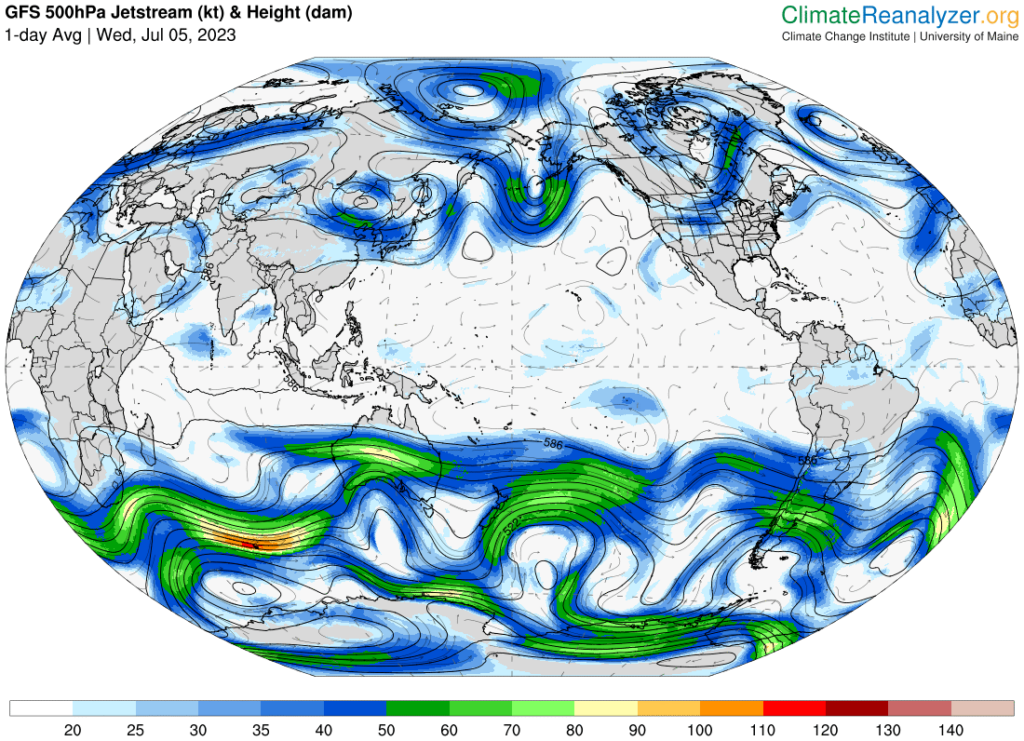
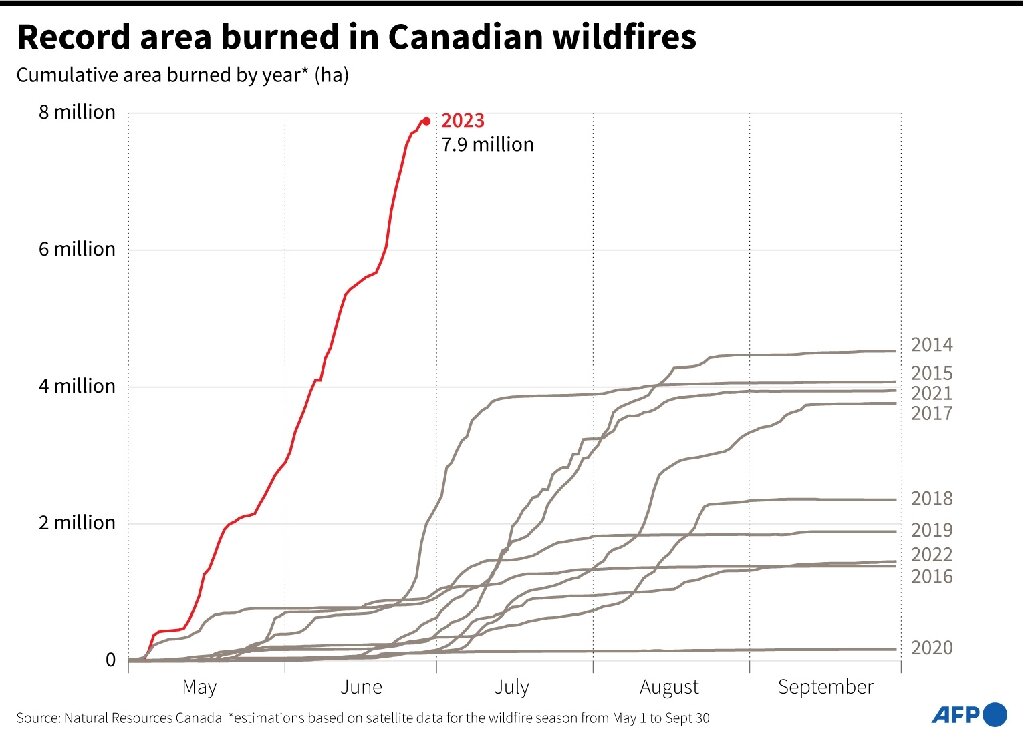
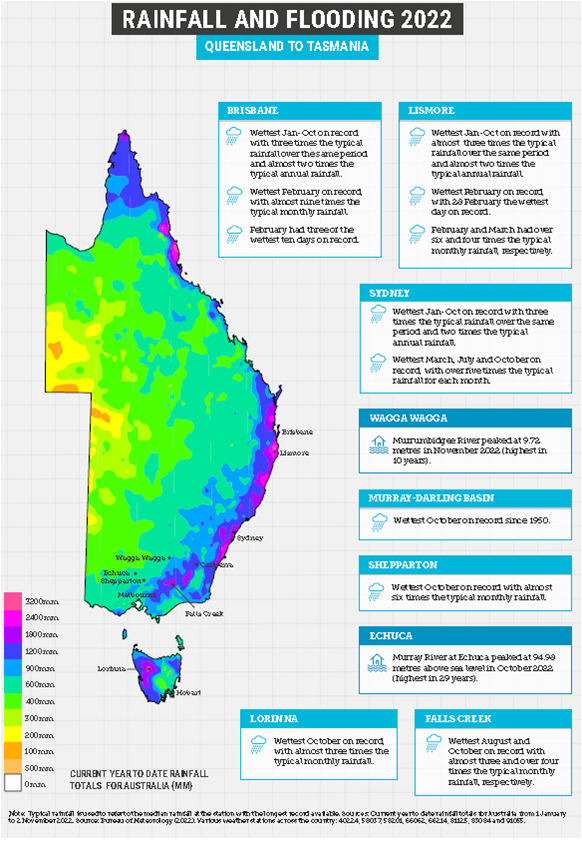

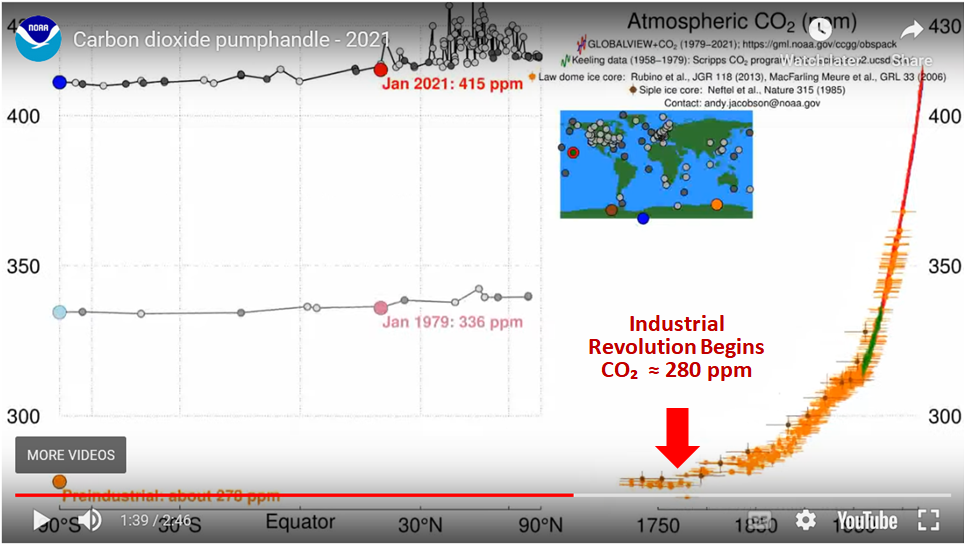
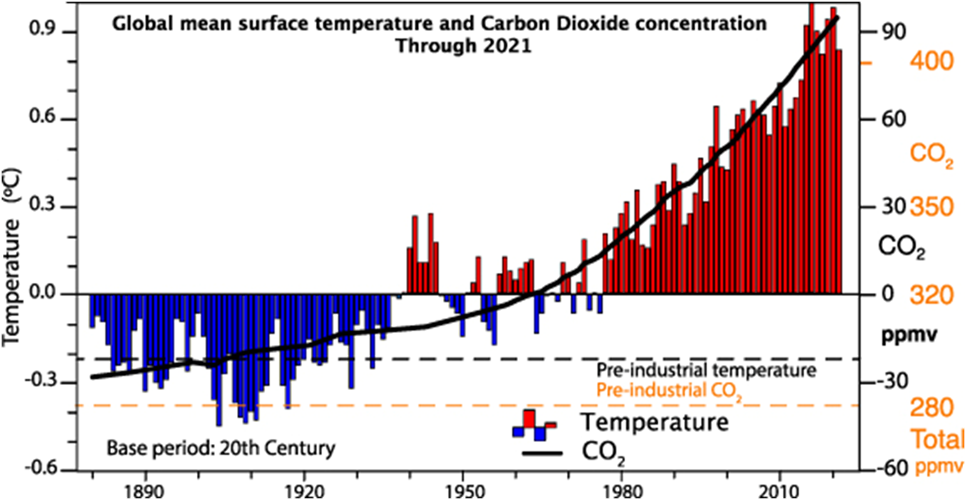
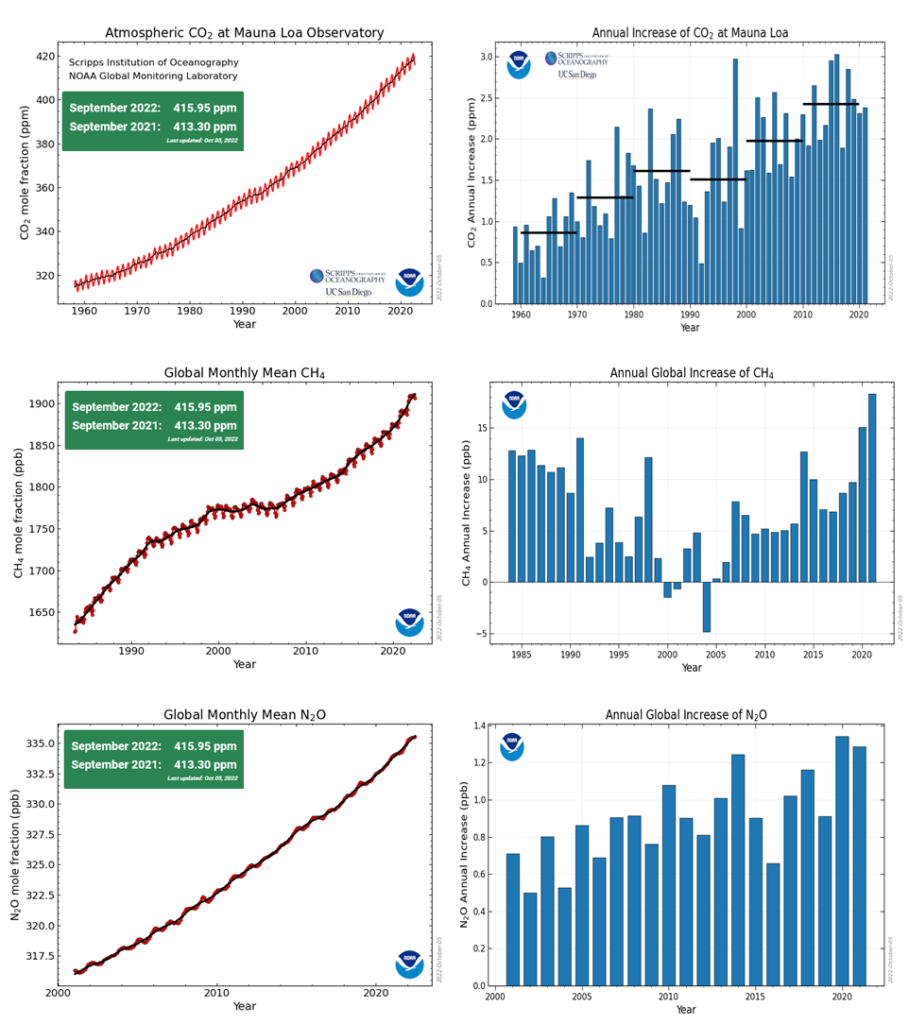

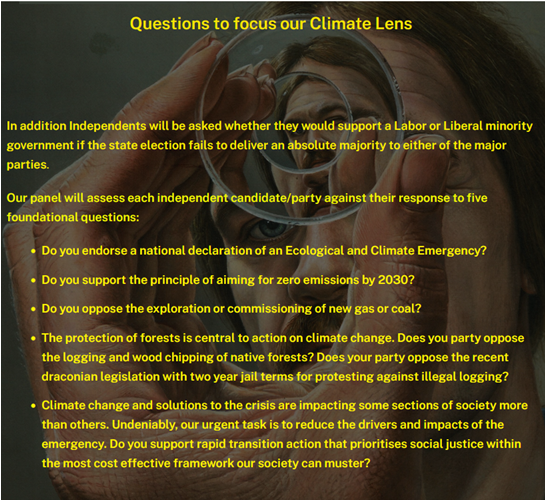
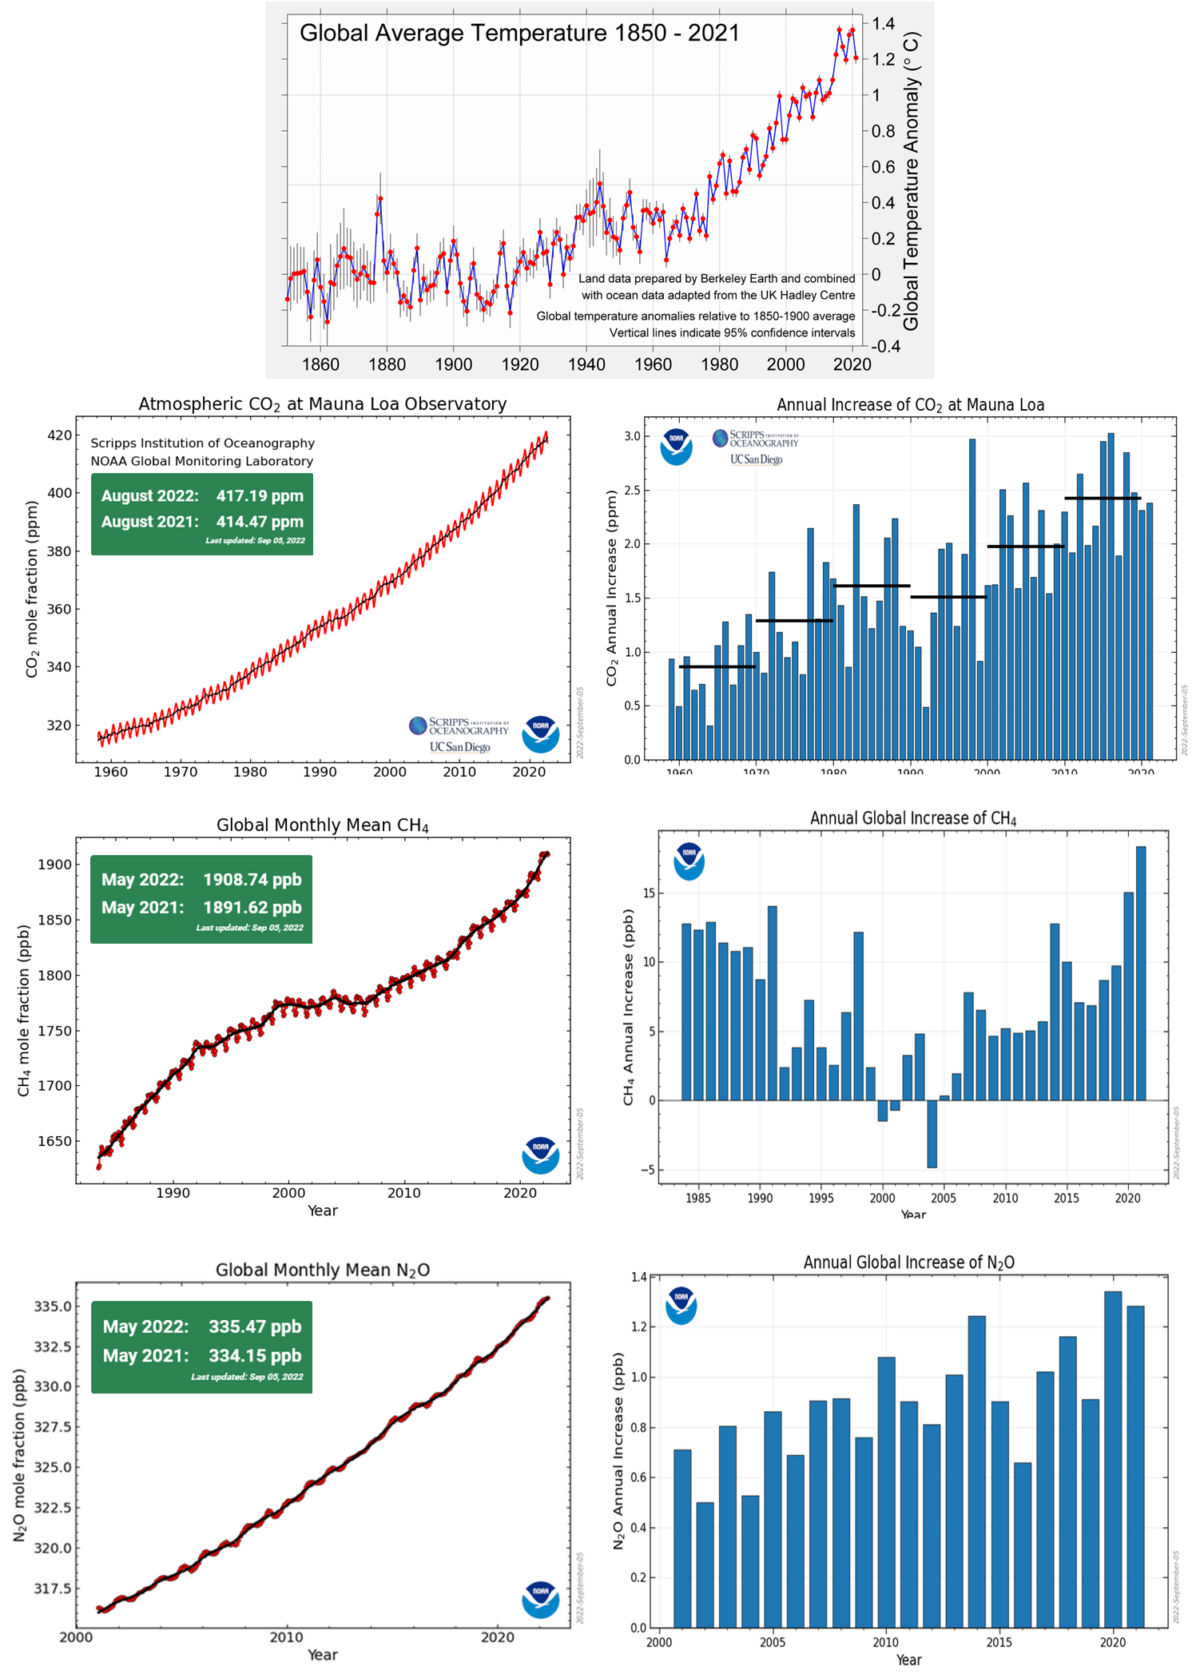

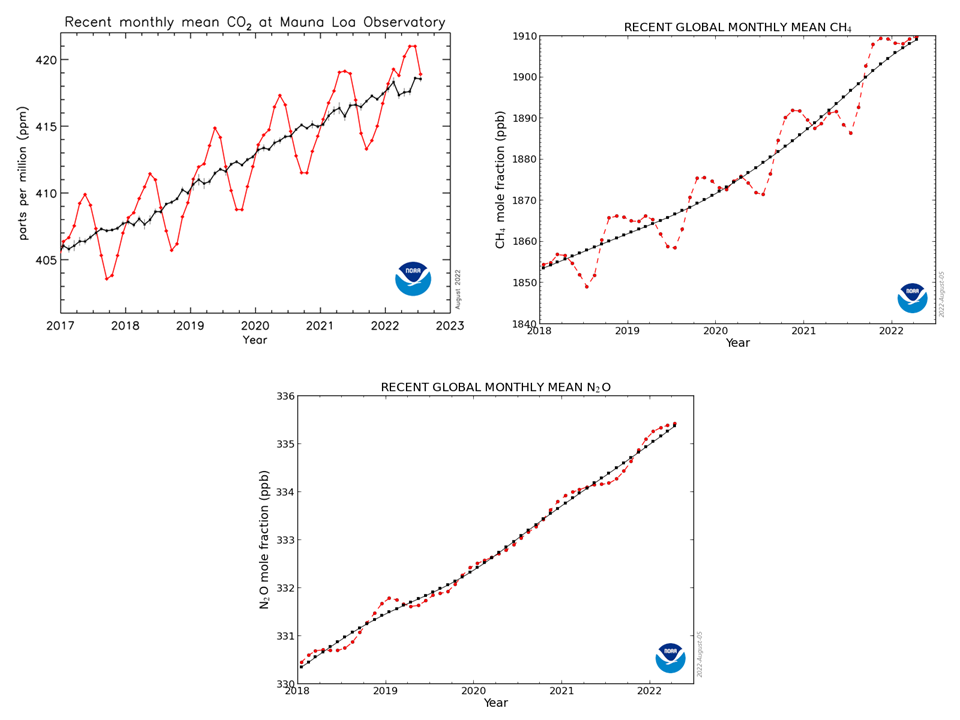
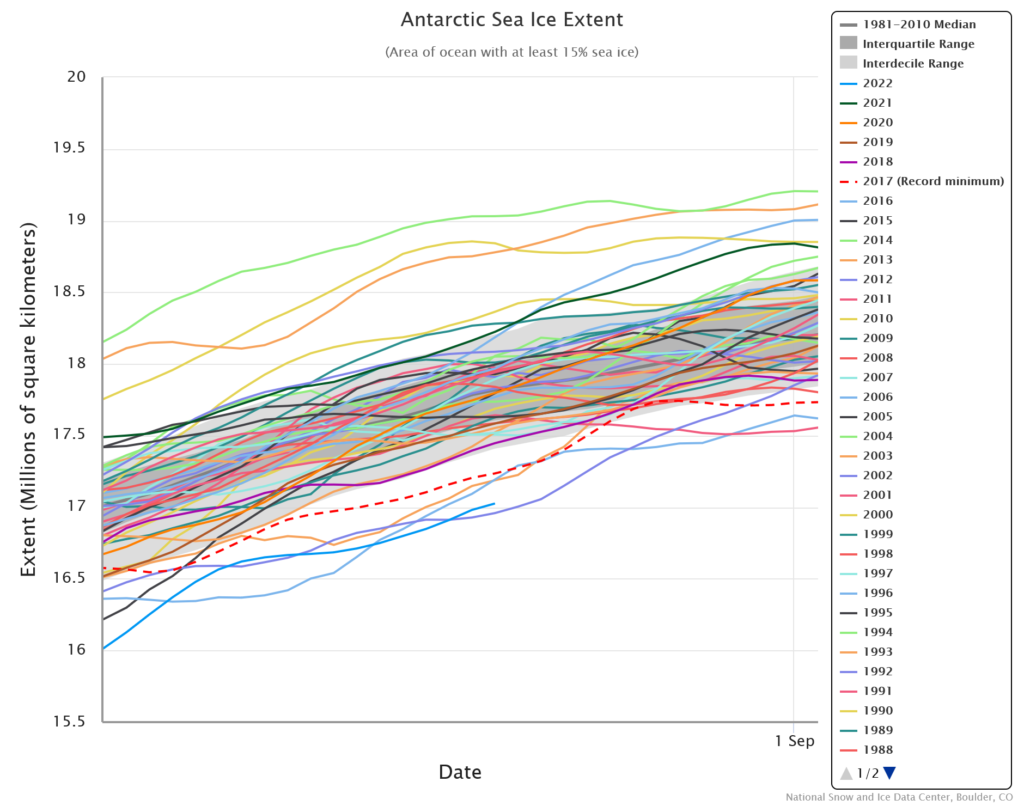
:extract_focal()/https%3A%2F%2Fi0.wp.com%2Fyaleclimateconnections.org%2Fwp-content%2Fuploads%2F2022%2F08%2F0822_heat_tree_1600.jpg%3Ffit%3D1600%252C900%26ssl%3D1)
:extract_focal()/https%3A%2F%2Ftruthout.org%2Fwp-content%2Fuploads%2F2022%2F08%2F2022_0809-trees-1-1200x675.jpg)
:extract_focal()/https%3A%2F%2Fguyonclimate.com%2Fwp-content%2Fuploads%2F2022%2F08%2Fimage-7.png)
:extract_focal()/https%3A%2F%2Fi.guim.co.uk%2Fimg%2Fmedia%2F61242f28355ef4ebd2c99c6b20412353aed65513%2F0_136_3000_1800%2Fmaster%2F3000.jpg%3Fwidth%3D1200%26height%3D630%26quality%3D85%26auto%3Dformat%26fit%3Dcrop%26overlay-align%3Dbottom%252Cleft%26overlay-width%3D100p%26overlay-base64%3DL2ltZy9zdGF0aWMvb3ZlcmxheXMvdGctZGVmYXVsdC5wbmc%26enable%3Dupscale%26s%3D15eada755d1ee6a16a5281ed623a1970)
:extract_focal()/https%3A%2F%2Fi.guim.co.uk%2Fimg%2Fmedia%2Ff239aad7954b26db5ee435a6bcd9e88cae44e2f5%2F0_319_6347_3810%2Fmaster%2F6347.jpg%3Fwidth%3D1200%26height%3D630%26quality%3D85%26auto%3Dformat%26fit%3Dcrop%26overlay-align%3Dbottom%252Cleft%26overlay-width%3D100p%26overlay-base64%3DL2ltZy9zdGF0aWMvb3ZlcmxheXMvdGctZGVmYXVsdC5wbmc%26enable%3Dupscale%26s%3Deb52d618290324fb601ac2ecee0f58a9)
:extract_focal()/https%3A%2F%2Fstatic.themoscowtimes.com%2Fimage%2Fog%2Fc3%2F78548__c39516c82921ace20fb52914e16d9e30.jpg)
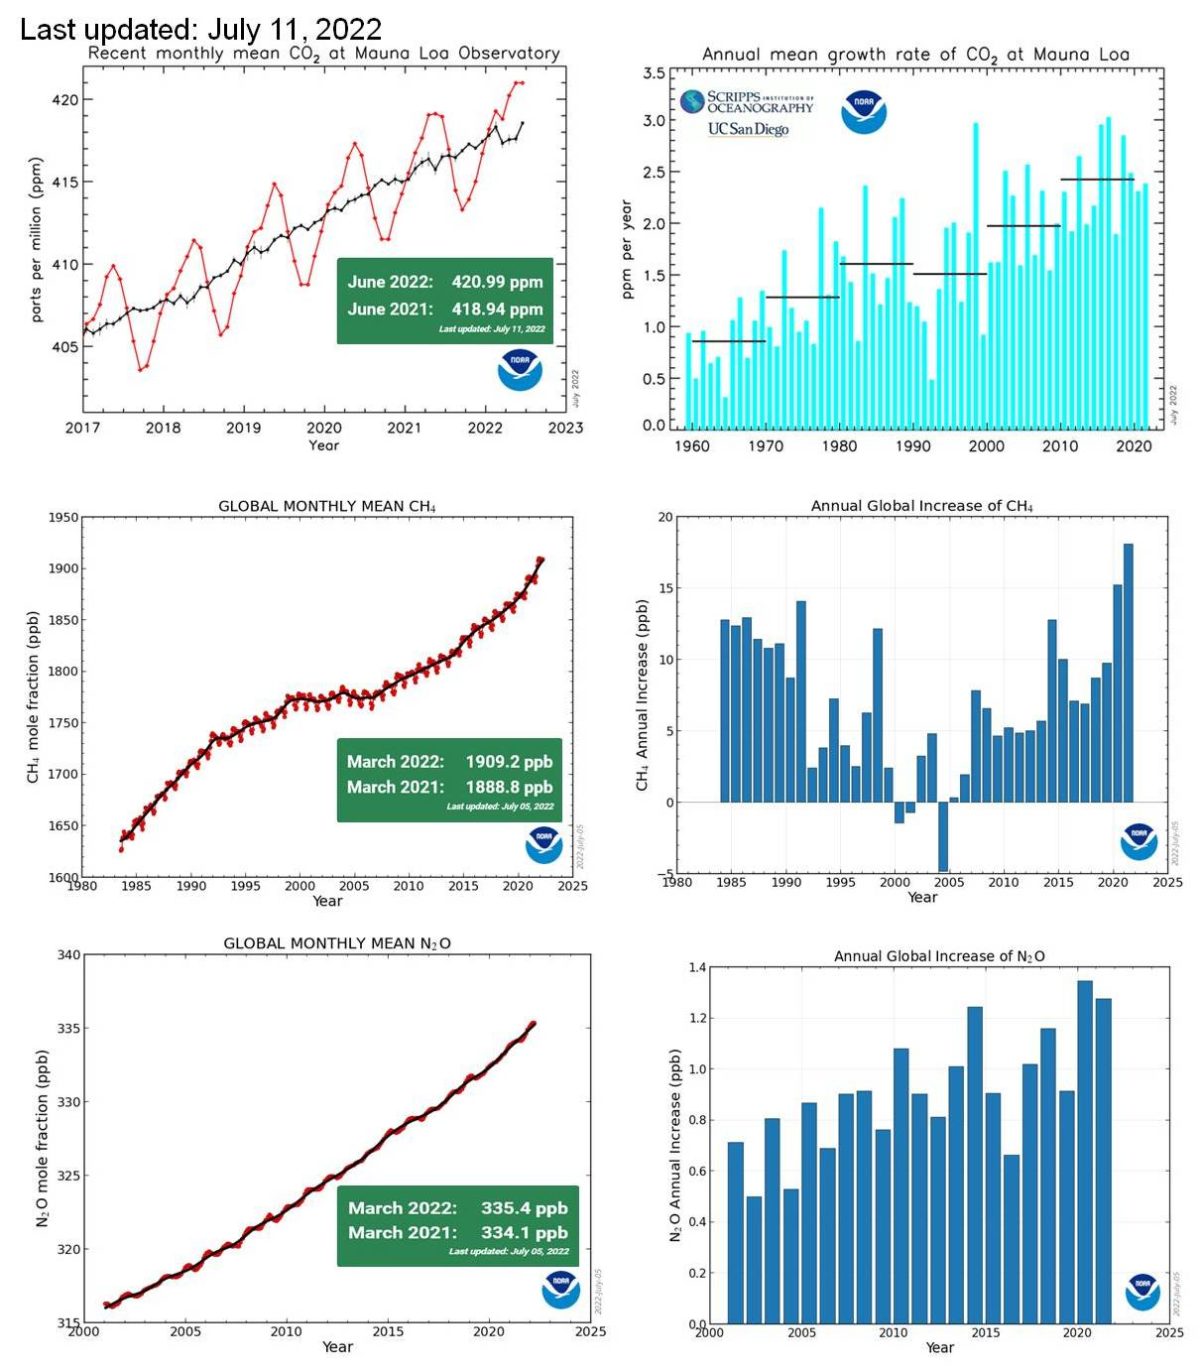
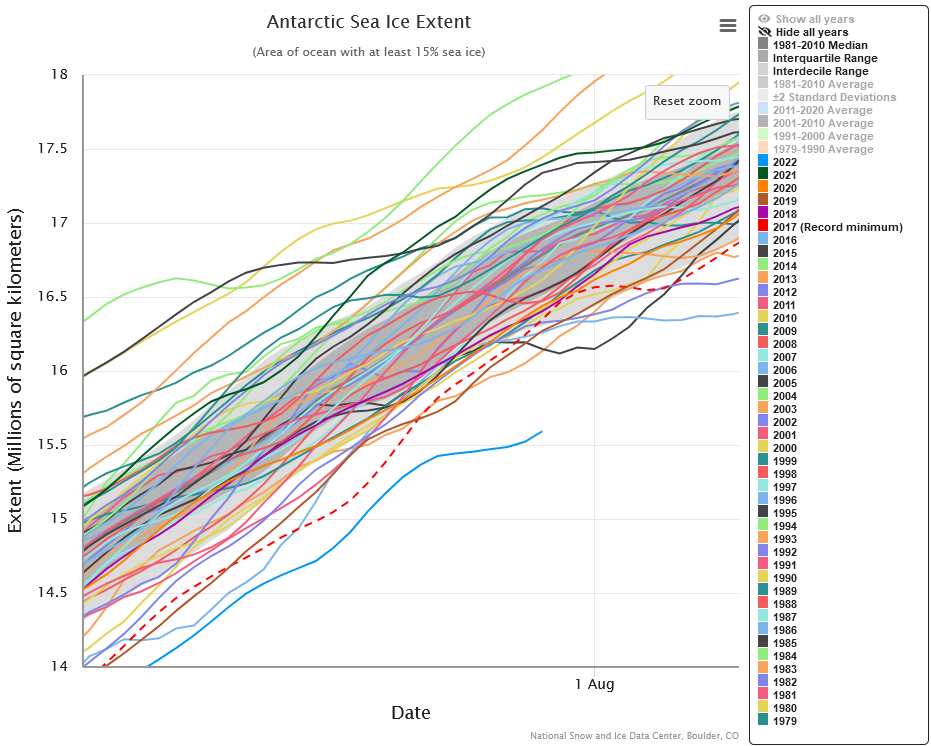

:extract_focal()/https%3A%2F%2Fi.guim.co.uk%2Fimg%2Fmedia%2F65e9cae2687f5a39dc83141bc1ab8061c2525f8e%2F0_234_5150_3090%2Fmaster%2F5150.jpg%3Fwidth%3D1300%26quality%3D85%26fit%3Dmax%26s%3Dc3ce63aa3e7c83e205aece9aed06d2be)
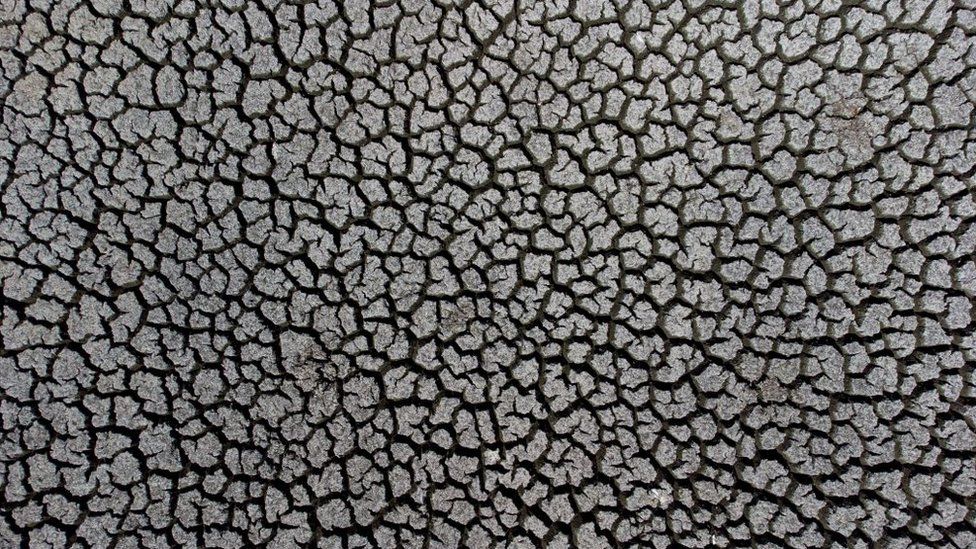