A warming ocean will take its revenge on us

Around 90% of the extra heat trapped by the greenhouse layer warms our Ocean to slow rising temperatures. We’ll pay the price.

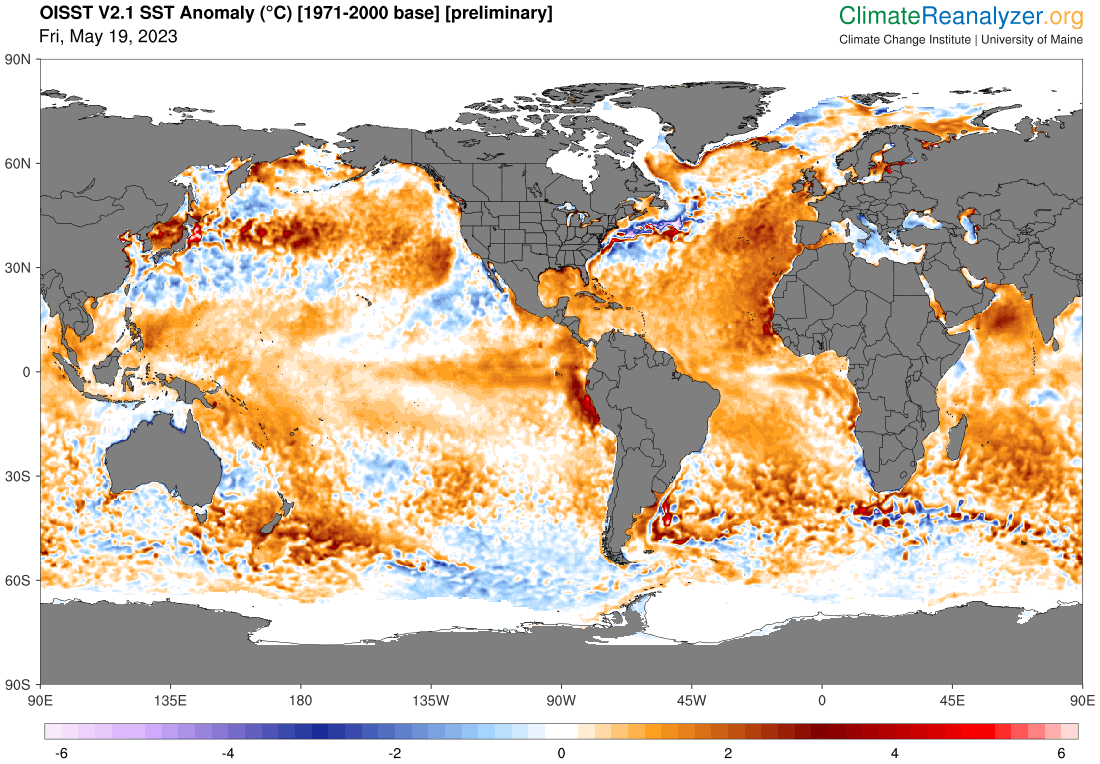
The climate scientist, Bill McKibben reminded me of this fact in his regular newsletter, The Crucial Years, in his 18 May post, Maybe we should have called this planet ‘Ocean’. His post on ocean warming begins with an earlier version of the graphic here from ClimateReanalizer. These are updated daily, so the record here is only a day or two behind the current reality:

The page provides time series and map visualizations of daily mean Sea Surface Temperature (SST) from the NOAA Optimum Interpolation SST (OISST) dataset version 2.1. OISST is a 0.25°x0.25° gridded dataset that estimates temperatures based on a blend of satellite, ship, and buoy observations. The OISST data product includes SST anomalies based on 1971–2000 climatology from NOAA. The datset spans 1 January 1982 to present with a 1 to 2-day lag from the current day. OISST files are preliminary for about two weeks until a finalized product file is posted by NOAA. This status is identified on the maps with “[preliminary]” showing in the title, and applies to the time series as well. The time series chart displays area-weighted means of the selected domain. For example, if World 60S-60N is selected, then the SST values shown are area-wieghted means for all ocean gridcells between 60°S and 60°N across all longitudes.

Something very troubling is happening on and under the 70 percent of the planet’s surface covered by salt water. We pay far more attention to the air temperature, because we can feel it (and there’s lots to pay attention to, with record temps across Asia, Canada and the Pacific Northwest) but the truly scary numbers from this spring are showing up in the ocean.

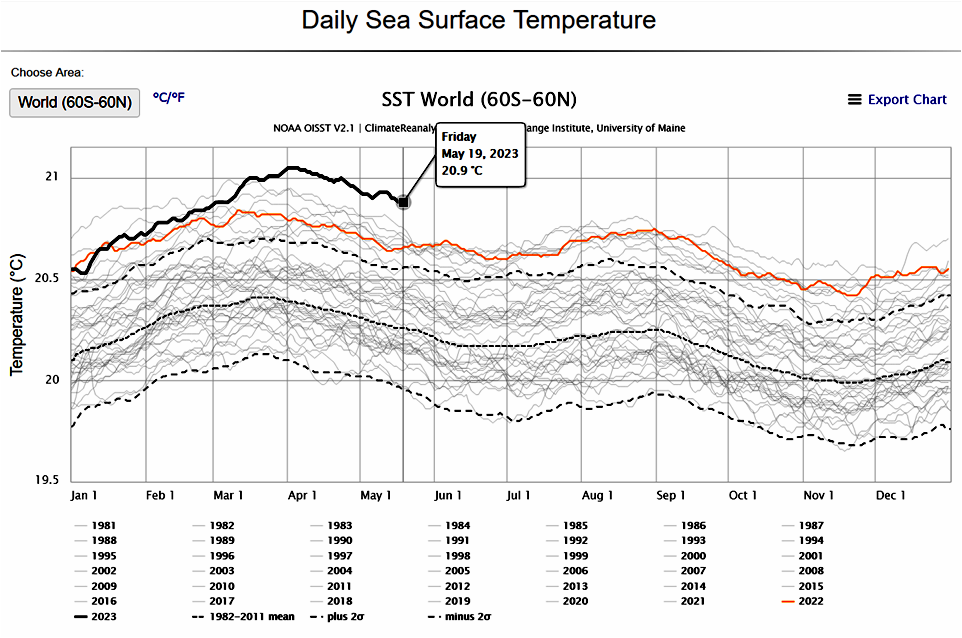
If you look at the top chart above , you can see “anomaly” defined. [His chart was for 11 May. Mine, here, is the temperature on 19 May.]That’s the averaged surface temperature of the earth’s oceans, and beginning in mid-March it was suddenly very much hotter than we’ve measured before. In big datasets for big phenomena, change should be small—that’s how statistics work, and that’s why the rest of the graph looks like a plate of spaghetti. That big wide open gap up there between 2023 and the next hottest year (2016) is the kind of thing that freaks scientists out because they’re not quite sure what it means. Except trouble. [My emphasis]

… A little-noticed [but quite important] recent study headed by Katrina von Schuckmann found that “over the past 15 years, the Earth has accumulated almost as much heat as it did in the previous 45 years,” and that 89 percent of that heat has ended up in the seas. That would be terrifying on its own, but coming right now it’s even scarier. That’s because, after six years dipping in and out of La Nina cooling cycles, the earth seems about to enter a strong El Nino phase, with hot water in the Pacific. El Nino heat on top of already record warm oceans will equal—well, havoc, but of exactly what variety can’t be predicted.

Read the complete article….

McKibben’s second graphic (the up to date version is my “Featured Image”) shows a global plot of temperature anomalies (also compared to the same 1971-1980 baseline) for every ¼° – ¼° square of ocean surface. “Area weighting” is applied because ¼° of latitude (the width of the ‘square) becomes much narrower as either pole is approached, reducing the physical surface area encompassed by the lines on the globe.

Earth’s oceans cover around 70% of the globe’s surface. Despite the 2nd or 3rd week of record breaking heat, wildfires and drought in western North America extending from California through the western 2/5ths of North America into the Arctic Ocean and a second belt in northern Eurasia extending from Scandinavia and Finland to western Siberia, the ocean temperatures are relatively even more extreme. And, in fact, the crazy heat in the warming oceans may be the driving force behind the record land temperatures — and may well be triggering what is likely to be the most extreme El Niño event yet in the climate change record.

In any event, this data doesn’t just freak me out. It suggests that the door to Earth’s Hothouse Hell is beginning to open to suck us in.


Is this data reliable enough to support action?

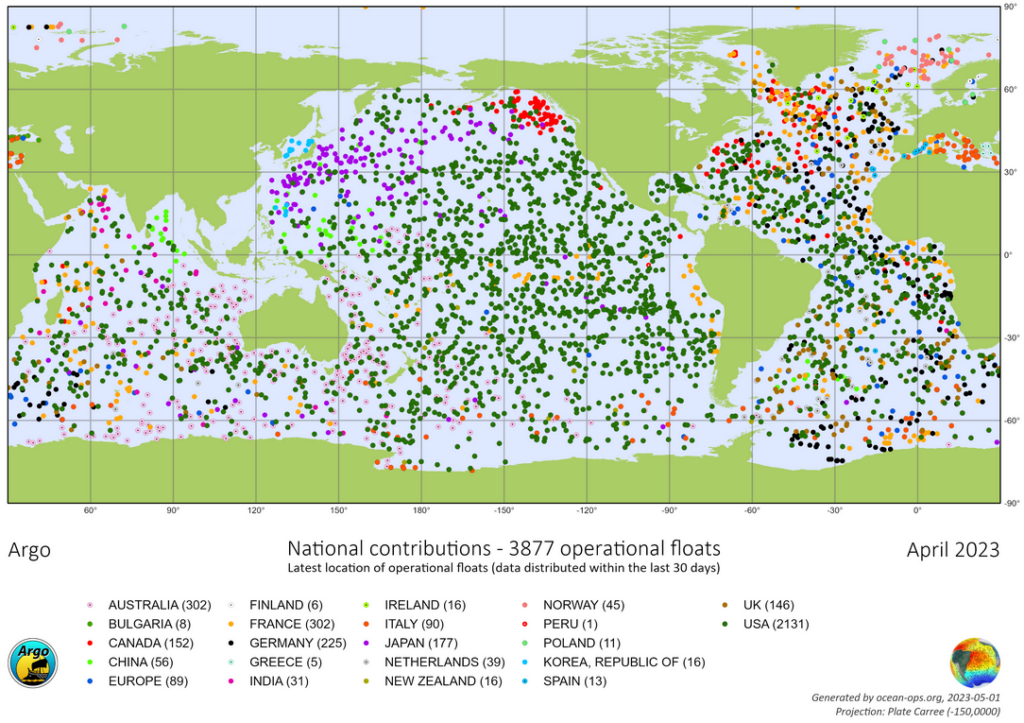
Where the climate record is concerned, From the beginning of the satellite era, our oceanic temperature record is very good indeed, and not just because satellite remote sensing measures virtually every square degree of most of the globe every day, but the satellites’ measurements are calibrated every day against the ‘ground truth’ measurements from many hundreds of Argo floats surfacing each day from their 9-10 days probing the ocean depths. The graphic below shows the physical locations sampled by Argo floats over the previous month. Added to these are more detailed measurements collected by fleets of oceanographic ships and a few special moored buoys that continuously record measurements from the ocean surface to the abyssal ocean bottom.

Supercomputers amalgamate the raw input data and assemble the kinds of human readable outputs that you and I can understand at a glance. Thanks to the exponential growth of measuring technologies and data processing power the accuracy and detail of our scientific understanding of climate and weather extends far beyond anything we could know in past decades.


How is all the additional heat in the warming ocean likely to affect the planet we live on?
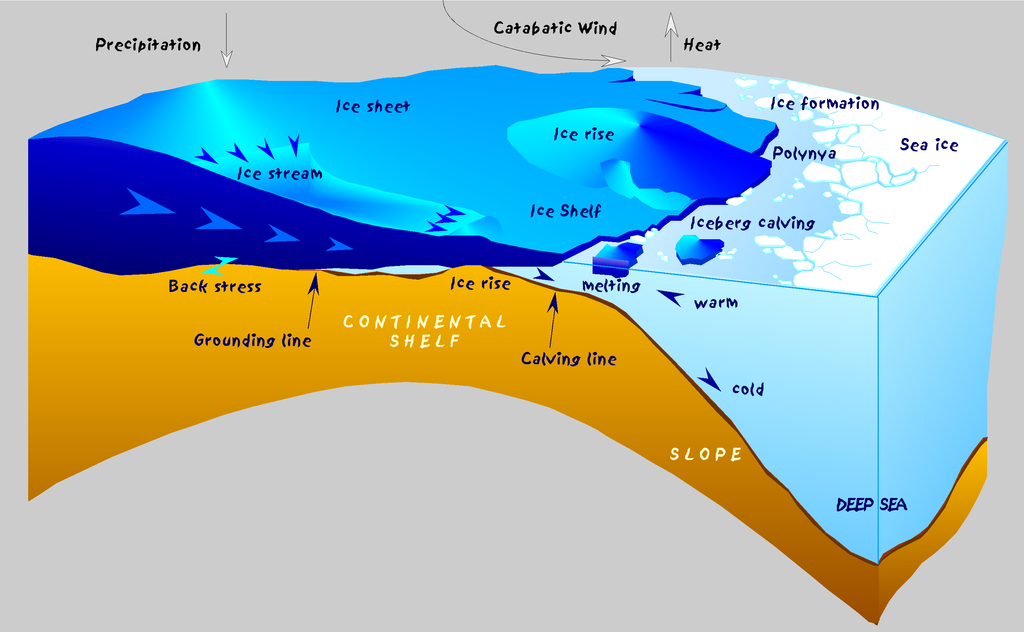
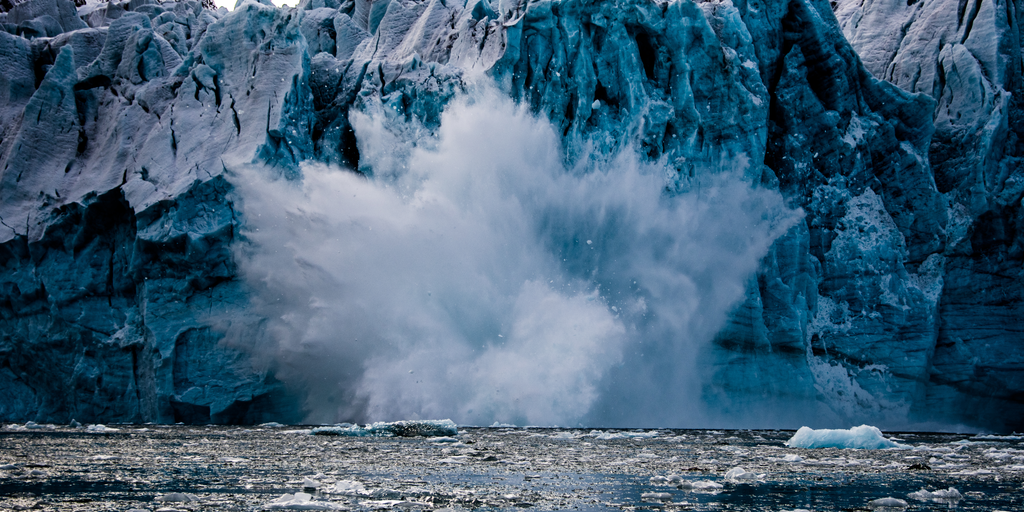
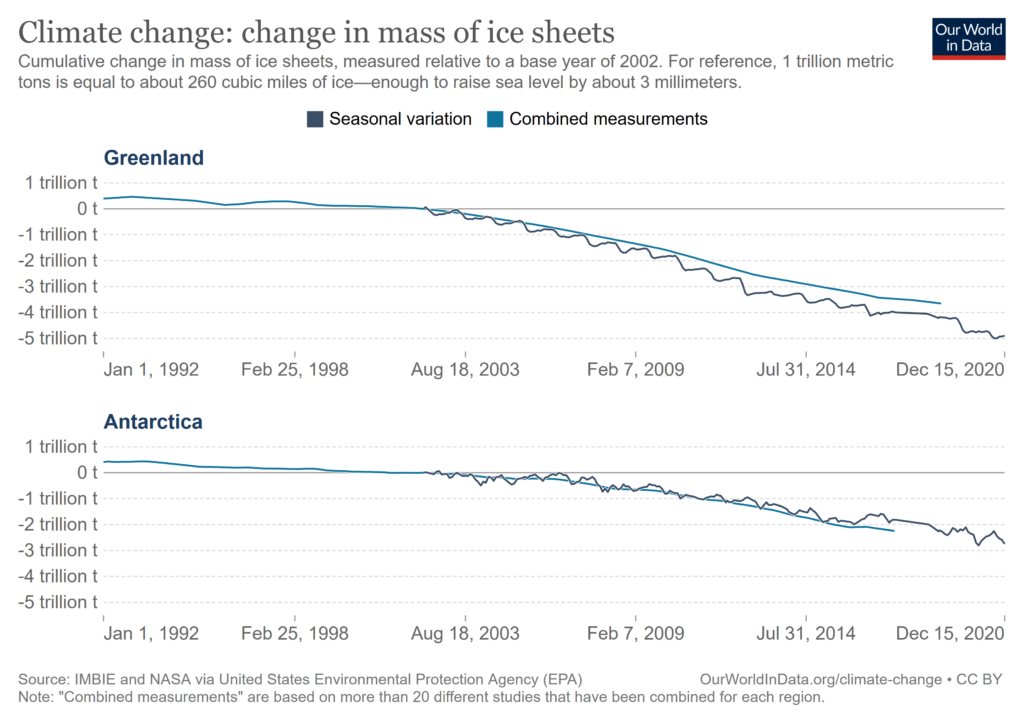
Melting ice

As the atmosphere and oceans absorb more solar energy, some of this excess energy will inevitably be absorbed melting ice in the cooler regions of the planet where ice has existed more-or-less in an equilibrium state, e.g., in the form of glaciers, ice sheets, and sea ice. The energy drives the equilibrium states towards more water and less ice.

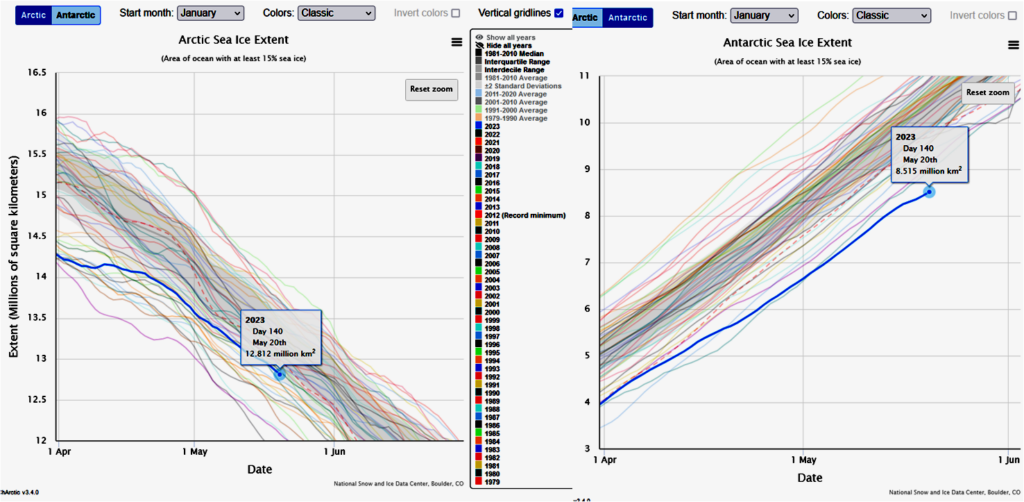
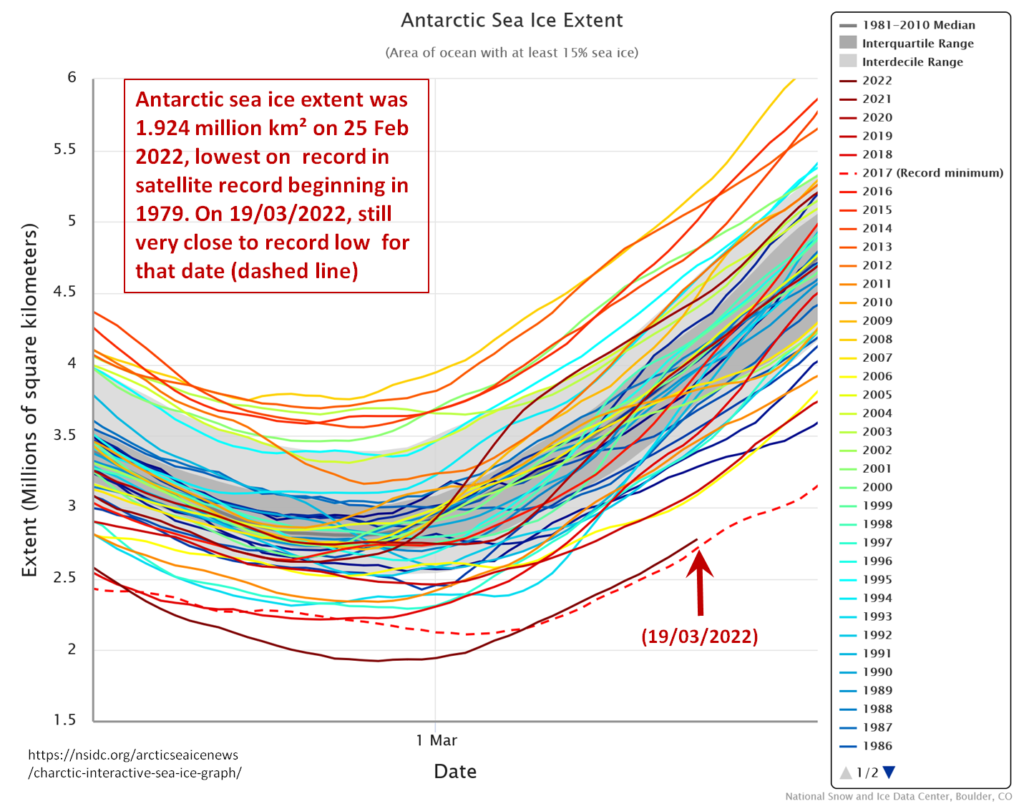
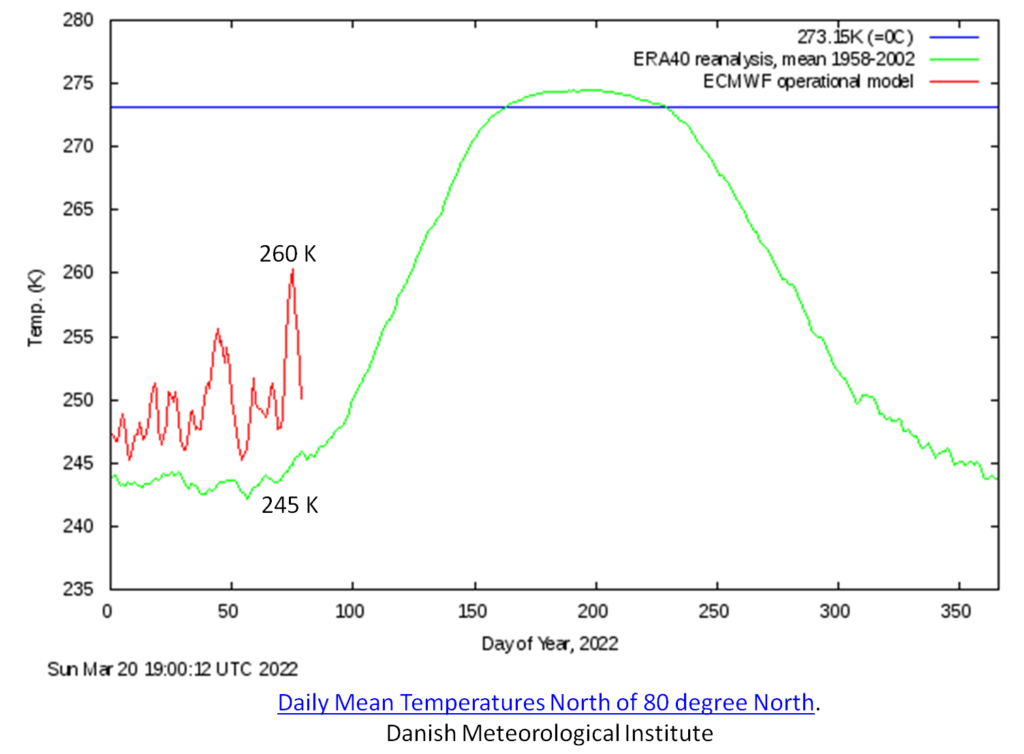
One very obvious measure of ice melting is the rapidly shrinking area of the Earth’s surface covered by sea ice around the N and S Poles. Since the beginning of the satellite era this has been able to be measured accurately. The Australian Antarctic Program Partnership and the ARC Australian Centre for Excellence in Antarctic Science’s 2023 Science Briefing: On Thin Ice explains what is happening around our local polar ocean

The graphics below show the daily extents of sea ice over both polar oceans since the beginning of the satellite era in 1979 as plotted by the US National Snow and Ice Data Center‘s interactive Charctic application.

Record minimums or maximums are updated annually. Therefore, a newly-set record may not be reflected in the chart until after the annual update.
View additional years by clicking the dates in the legend.
Roll your cursor over the line to see daily sea ice extent values.
Zoom in to any area on the chart by clicking and dragging your mouse.
To see a corresponding daily sea ice concentration image, click on a line in the chart. Sea ice extent is derived from sea ice concentration. Images are not available for the average or standard deviation.
When reusing Charctic images or data, please credit “National Snow and Ice Data Center.”
Currently, some functions do not work in Internet Explorer. We recommend using a different browser.
For more information about the data, see About Charctic data.
If you have questions or problems, please contact NSIDC User Services at [email protected].

What is currently happening in the Antarctic Ocean is also freakish and worrisome!
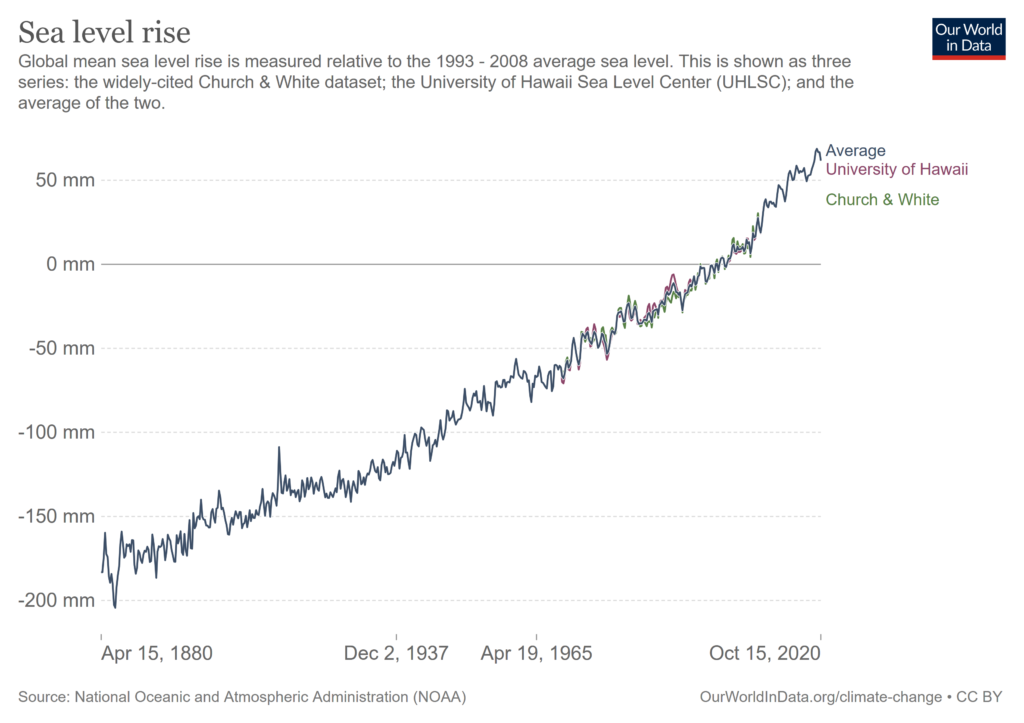
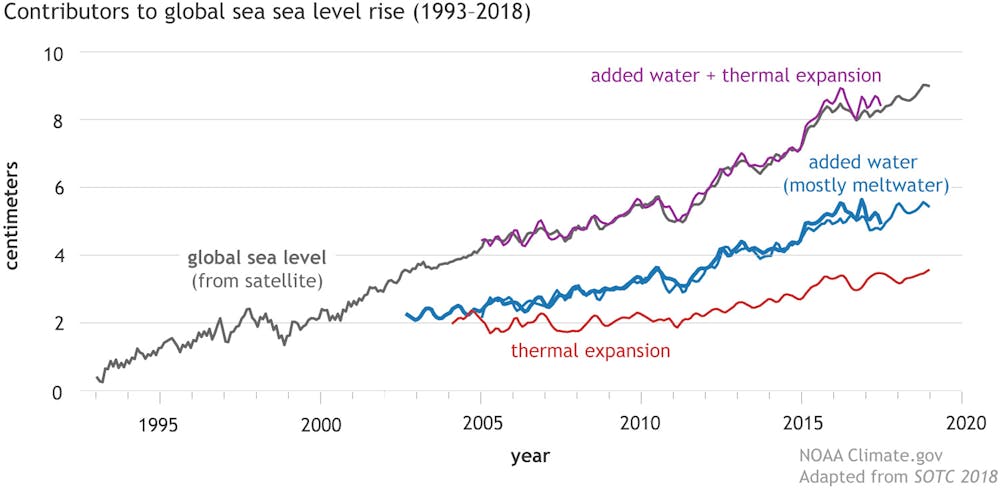
Rising sea levels

Of course, all the melt water released by melting ice has to go somewhere — i.e., adding to the volume of the World Ocean. As this wasn’t enough, as water warms it also expands to raise the sea levels even more. The graph below from the EU’s Copernicus Climate Change Service, plots the rising tide of the swelling ocean since 1993 through June 2022. The US National Oceanic and Atmospheric Administration’s Climate.Gov site’s Climate Change: Global Sea Level also plots the rise, and considers its implications in more detail.

The Conversation’s May 17 article, Global warming to bring record hot year by 2028 – probably our first above 1.5°C limit, looks at these facts and warns us that the time to act is NOW! CSIRO’s State of the Climate/Oceans covers most of the trends I have discussed here and more…

Daily change in global mean sea level, as measured by satellite altimetry, from January 1993 to June 2022 (solid line), the associated uncertainty at 90% confidence level (shading) and the trend (dashed line). The data have been adjusted for glacial isostatic adjustment and have been corrected for the TOPEX-A instrumental drift during 1993–1998. Data source: CMEMS Ocean Monitoring Indicator based on the C3S sea level product. Credit: C3S/ECMWF/CMEMS. 
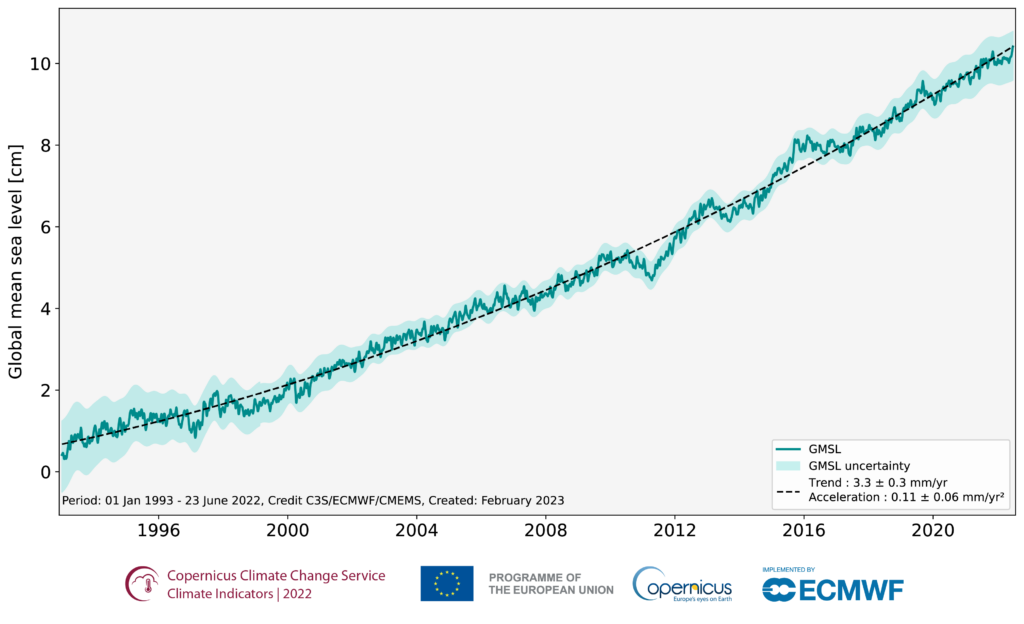
https://climate.copernicus.eu/climate-indicators/sea-level

Help! We’re sliding down the slope to Earth’s Hothouse Hell! Sound the sirens and mobilize for WW III against global warming and the existential climate crisis!


As is usual for the UN’s climate pronouncements driven by the UN’s IPCC findings that absolutely establish the dangers we face from global warming/heating, even this klaxon warning understates and downplays the magnitude of the crisis we face.

If we fail to mobilize genuinely effective action over the next decade to stop and reverse the warming crisis, our families will have their lives shortened due to increasing climate catastrophes and we will have condemned our entire species to death in Earth’s 6th global mass extinction within a century or two. We don’t have time to take more election cycles to elect new governments. Our existing governments must wake up, smell the smoke, and immediately begin acting to put out the fire before it destroys us all. If you are in government, read Guterres’ message in mind. YOU must act now!

Press Release

SG/SM/21799

16 May 2023

Planet Hurtling towards Hell of Global Heating, Secretary-General Warns Austrian World Summit, Urging Immediate Emissions Cuts, Fair Climate Funding

Following is the text of UN Secretary-General António Guterres’ video message to the seventh Austrian World Summit, in Vienna today:

I thank the Austrian Government and Arnold Schwarzenegger for this opportunity.  The climate crisis can feel overwhelming.  Disasters and dangers are already mounting, with the poor and marginalized suffering the most, as we hurtle towards the hell of 2.8°C of global heating by the end of the century.

But, amidst all this, I urge you to remember one vital fact:  limiting the rise in global temperature to 1.5°C remains possible.  That is the clear message from the Intergovernmental Panel on Climate Change (IPCC).  But, it requires a quantum leap in climate action around the world.

To achieve this, I have proposed an Acceleration Agenda.  This urges all Governments to hit fast-forward on their net-zero deadlines, in line with the principle of common but differentiated responsibilities and respective capabilities in the light of national circumstances.  It asks leaders of developed countries to commit to reaching net zero as close as possible to 2040 — as Austria has done.  And leaders in emerging economies to do so as close as possible to 2050.

The Acceleration Agenda also urges all countries to step up their climate action, now.  The road map is clear:  phasing out of coal by 2030 in OECD [Organisation for Economic Co-operation and Development] countries and 2040 in all others; net-zero electricity generation by 2035 in developed countries, and 2040 elsewhere; no more licensing or funding of new fossil-fuel projects; no more subsidizing fossil fuels; and no more fake offsets, which do nothing to cut greenhouse-gas emissions, but which are still being used to justify fossil-fuel expansion today.

We can only reach net zero if we make real and immediate emissions cuts.  If we embrace transparency and accountability.  Relying on carbon credits, shadow markets, or murky accounting means one thing:  failure.  That is why I have asked CEOs to present clear net-zero transition plans, in line with the credibility standard presented by my high-level expert group on net-zero pledges.

And the Acceleration Agenda urges business and Governments to work together to decarbonize vital sectors — from shipping, aviation and steel, to cement, aluminium and agriculture.  This should include interim targets for each sector to pave the way to net zero by 2050.

The Acceleration Agenda also calls for climate justice, including overhauling the priorities and business models of multilateral development banks, so that trillions of dollars in private finance flow to the green economy.

Developed countries must also make good on their financial commitments to developing countries.  And they must operationalize the loss and damage fund, and replenish the Green Climate Fund.  I commend Austria for increasing its pledge to the Green Climate Fund by 23 per cent and urge others to deliver their fair share.

On climate, we have all the tools we need to get the job done. But, if we waste time, we will be out of time.  Let’s accelerate action, now.  Thank you.

Featured Image

Note that about half the surface of Earth’s Ocean is a good 2 °C hotter than the baseline average temperature for this day of the year

Views expressed in this post are those of its author(s), not necessarily all Vote Climate One members.

Earth’s annual healthcheck — and our future

A compendium of graphs plots key indicators of our changing climate. Unless trends are reversed today’s lethal extremes will be lethal new normals’.

Climate scientist Zach Labe shows us in a collection of simple graphs from his WordPress page how many of Planet Earth’s vital signs have been changing over recent decades. He plots the best available data, and lets the plots tell the story without adding his redundant commentary.

However, If you want, you can still follow links that explains how the data was collected and analyzed. Click on Climate Visualizations at the top of the screen to open a pull-down menu, and then on FAQ and my methods at the bottom of that menu.

Plotting the reality

Four critical variables (the three critical greenhouse gases and global average temperature) show us how our changing climate is progressing.

The collection of graphs shows completely unambiguously that ever more heat energy is being loaded into our planetary climate system to make it hotter and more humid — where heat and humidity are the drivers for all kinds of extreme weather events.

If you look at the most recent years of Rising Temperature (beginning with 2020) you might think temperatures have stopped rising. However, this is almost certainly dangerously wrong. We have just finished an unusual three successive periods of La Niña conditions that result in below average global temperatures. GIven the generally increasing rate of temperature rise, the next El Niño periods are likely to be substantially hotter than the last ones (2014-2019) when Australia suffered the record-breaking bushfires of our Black Summer that even burned temperate rainforests that survived previous fires for many hundreds of years.

What do the graphs tell us?

In the past VoteClimateOne’s Climate Sentinel News has posted many articles attesting to the increasing frequency, extent and ferocity of extreme weather and the increasing chaos and costs these cause.

As the energy in the climate system continues to rise, catastrophes will increasingly overlap such that more damage and chaos will be caused by following events before recovery from earlier ones is complete. We are already seeing examples of this in NSW’s Northern Rivers and southwestern areas. At some point (in the not distant future — if global warming is not reversed) the still growing social and physical costs will lead to social and physical collapse of society.

Can you do something to change the picture?

At this point both major political parties in the NSW government are still defending and even subsidizing the fossil fuel industry’s (coal and gas) continuing increasing emissions of greenhouse gases.

It is time for you to help elect a government able to act effectively against the climate emergency by ensuring neither party has a majority to do things without people’s support. Hard-right members in either party who will do deals with anyone to stay in power to enforce their religiofascist dogmas tend to ignore even stark objective realities such as the climate crisis shown by Earth’s vital sighs. Such people need to be replaced by electing teals, other community-oriented independents and Greens who accept the reality of the climate emergency and are willing to prioritize acting on it.

My Climate Sentinel News article, Is Premier Perrettet a far-right puppet, or the puppet master?, documents and explains how the kind of ultra dogmatic hard-right politicians got into power that most need to be replaced by parliamentarians who will represent and work for the voters’ benefits. As the now deceased Lyenko Urbanchich, ex MLC David Clarke, federal Senator Alex Hawke, the Tudehope family and the Perrottet family have shown on the far right of the NSW Liberal Party, if your faction can fill key positions in party and factional organizations with collaborators who can organize cadres of ‘storm troops’, it is easy to put whoever the faction ‘leader(s)’ may want into Parliament. The party’s ‘safest’ seats are taken over by using the cadres to subvert preselections by branch stacking and simple thuggery or by bypassing preselection entirely with direct appointments (as has been demonstrated many times over the 40 years of history covered in my article).

Here I focused on the Liberal hard-right. But it should be recognized that Labor also has had and probably still has a very similar hard-right. This was made most evident in the impact Bob Santamaria had on the Labor Party in the 1950’s that led to it a near-lethal split to form the Democratic Labor Party. I have not had the time to adequately research the NSW Labor Party, but its leader, Chris Minns shares many characteristics with Dominic Perrottet, and has even backed and defended him over the treatment of climate protester Violet Coco. Like the Liberals, Labor also safe seats giving factions many opportunities to subvert real democracy. To me this is more than enough reason for VoteClimateOne to advise voters in such seats not to vote for factional puppets in hopes of making the seat marginal. Even if you don’t get rid of the puppet this time, you may be given a real opportunity in the next election to preselect someone actually representing you (rather than someone dogma) in the next election.

How to vote?

We won’t suggest who you should vote for. However we try to show you in our NSW voting guides where we think each candidate in your electorate stands relative to action on the climate emergency and whether we think there are reasons a particular candidate might be considered to be a puppet or less trustworthy on issues than others in the electorate. These recommendations won’t be complete or final until we have had a chance to work our way through those on the ballots provided by the Electoral Commission.

Featured image

Featured image from Dettre, M., (18/08/2022). Lismore City News, Questions over NSW flood victims’ buyback / More than a thousand people lost homes in the NSW Northern Rivers floods. (Darren England/AAP PHOTOS).

Health Minister Minster Mark Butler says ongoing trauma can manifest in increased rates of anxiety, post-traumatic stress and domestic and family violence: “Mental health is one of the government’s highest priorities and I recognise that these flooding events have been hugely traumatic for many people,” he said…. For some of these communities, this has been their fourth flood in 18 months.”

Views expressed in this post are those of its author(s), not necessarily all Vote Climate One members.

Video report: Arctic warming and scientific conservatism

A personal story on Arctic climate change filled with facts together with discussion of how ‘conservative science’ nobbles urgency of action.

What Arctic climate tells us – It’s worse than we are told: Why science communication is conservative.

by Jason Box, 08/01/2022 on YouTube

Greenland ice melt – why climate communication is conservative – personal story

Featured image: 2100 years of summer Arctic air temperatures under different IPCC climate models. / From the video.

Views expressed in this post are those of its author(s), not necessarily all Vote Climate One members.

Antarctic ice shelf collapsed by recent NB4 heat spike

Satellite imagery shows last week’s unimaginable high temperature spike in East Antarctica has fueled the collapse of at least one ice shelf

Satellite data shows the Conger ice shelf has broken off iceberg C-38 and collapsed in Antartica. Photograph: USNIC (From the article)

by Donna Lu, 25/03/2022 in The Guardian

Satellite data shows entire Conger ice shelf has collapsed in Antarctica: Nasa scientist says complete collapse of ice shelf as big as Rome during unusually high temperatures is ‘sign of what might be coming’

Featured Image: Sketch of the Antarctic coast with glaciological and oceanographic processes. 7 April 2000. / Author: Hannes Grobe, Alfred Wegener Institute for Polar and Marine Research, Bremerhaven, Germany via Wikimedia / Permission: Own work, share alike, attribution required (Creative Commons CC-BY-SA-2.5)

Views expressed in this post are those of its author(s), not necessarily all Vote Climate One members.

Is it time for the hose, mate? Or is it too late already?

Two news items to ponder when next voting: Earth’s poles are shockingly hot, and the IPCC thinks we can do something about it

FILE – A drop of water falls off an iceberg melting in the Nuup Kangerlua Fjord near Nuuk in southwestern Greenland, Tuesday, Aug. 1, 2017. Earth’s poles are undergoing simultaneous freakish extreme heat with parts of Antarctica more than 70 degrees (40 degrees Celsius) warmer than average and areas of the Arctic more than 50 degrees (30 degrees Celsius) warmer than average. (AP Photo/David Goldman, File)

by SETH BORENSTEIN, March 19, 2022 in AP News

Hot poles: Antarctica, Arctic 70 and 50 degrees above normal: Earth’s poles are undergoing simultaneous freakish extreme heat with parts of Antarctica more than 70 degrees (40 degrees Celsius) warmer than average and areas of the Arctic more than 50 degrees (30 degrees Celsius) warmer than average.

What makes the Antarctic warming really weird is that the southern continent … has not been warming much, especially when compared to the rest of the globe,…

Antarctica did set a record for the lowest summer sea ice — records go back to 1979….

What likely happened was “a big atmospheric river” pumped in warm and moist air from the Pacific southward, Meier said. And in the Arctic, which has been warming two to three times faster than the rest of the globe and is considered vulnerable to climate change, warm Atlantic air was coming north off the coast of Greenland.

Read the complete article….

These sorts of temperatures in what are supposedly the coldest places on our planet is a strong indication that our house is on fire, and that we need to get very serious about working to put it out before we are all consumed by it!

Current carbon-cutting commitments still put us on a catastrophic path toward 2.7C of warming by 2100.

by Amélie Bottollier-Depois, 18/03/2022 in Phys Org/Earth/Environment

UN report to lay out options to halt climate crisis: Nearly 200 nations gather on Monday to confront a question that will outlive Russia’s invasion of Ukraine: how do we stop carbon pollution overheating the planet and threatening life as we know it?

The answer is set to arrive on April 4 after closed-door, virtual negotiations approve the summary of a phonebook-sized report detailing options for drawing down greenhouse gases and extracting them out of thin air.

“The science is crystal clear, the impacts are costly and mounting, but we still have some time to close the window and get ahead of the worst of them if we act now,” said Alden Meyer, a senior analyst at climate and energy think tank E3G.

“This report will supply the answers as to what we need if we’re serious about getting there.”

Read the complete article….

Are we too late to put out the fire? The Intergovernmental Panel on Climate Change (IPCC) doesn’t think so…. at least not quite yet. The IPCC’s Sixth Assessment report: Climate Change 2021/2022 consists of three parts: Part I, published last year – The Physical Science Basis , details the scientific background; Part II, published this month – Impacts, Adaptation and Vulnerability, details the troubles we face if warming is not stopped; and Part III to be published early April details how we can respond. Bad news, but not yet a death sentence.

How sure are we that we face imminent threats from continued warming?

Aside from warnings issued by the IPCC and individual climate scientists, we only need to pay attention to the world around us and the NB4 weather catastrophes assaulting our communities to see that the climate is deteriorating before our eyes at an accelerating rate. Some observations will illustrate what I mean here.

Illustration produced with the aid of the publicly available Charctic Interactive Sea Ice Graph provided by NASA’s National Snow and Ice Data Center.

This graph shows with remarkable clarity how much less ice cover there was on the Antarctic Ocean at the time of maximum melting, and how long that amount of ocean was ice-free and thus able to absorb solar heat that otherwise would have been reflected away from our planet. This heat will stay around slowing the rate of the winter freeze up and reduce the thickness of the ice cover so it melts away even faster in the following year than would otherwise be the case. Some of the heat will also speed melting of Antarctic glaciers from underneath. In other words, reducing the exent of the freezing provides positive feedback helping to drive global temperatures higher.

This graph shows air-temperature variation over essentially the whole of the Arctic Ocean around the North Pole from January through 20 March 2022. The scale is given in degrees Kelvin above Absolute Zero. Zero degrees Celsius is indicated by the blue line near the top of the graph. The green line shows the average mean temperature for each day of the year for the baseline reference years from 1958 to 2002. The red line shows this year’s mean temperatures for each day up to 20/03/2022. Every day this year the temperature has been at least 2 °C warmer than the reference temperature for the day. Recently, the whole area over the Arctic Ocean was 15 °C hotter than the reference temperature. At this temperature the Ice won’t be melting from the top, but it may be warm enough that warmish ocean waters under the ice may be doing some melting from he bottom. It also means that when spring comes the ice won’t be so cold, and will warm up to melting temperature earlier in the year.

And then there is yet more evidence from the last few days:

See also Matthew Cappucci, 16/03/2022 in the Washington Post, “Record ‘bomb cyclone’ bringing exceptional warmth to North Pole

And then there are the climate catastrophes in Australia that some of you will have experienced personally and lived through… and the rest of us will have seen on the TV news.

What does this news tell us we should do about a man who “won’t hold a hose” and has committed ‘his’ government to keep shoveling coal on the fire?

Prime Minister Scott Morrison says he is supportive of Australia’s fossil fuel industry – and particularly coal, which he… says will be around for “decades to come”. “When it comes to the coal industry, it’s worth $35 billion to us every year in exports, and that’s money Australia needs to grow our economy,” Mr Morrison said. “What you need in today’s energy economy is you need to continue to run your coal-fired power stations for as long as you possibly can and that is our policy … we want them to run as long as they possibly can.” Coal-fired power stations will continue to run to back up renewable power sources, although Mr Morrison said gas would play a larger role in the energy mix in years to come. Mr Morrison added that building a new coal-fired power station would be difficult because of the state government planning powers, which would “probably never allow them to do it”. For the video see: The Australian, 14/03/2022, Commentary/coal-will-be-around-for-decades-to-come-scott-morrison/video. See also ‘We will keep mining’, says Australian prime minister Scott Morrison about the future of coal.

Our home world’s climate system is telling us via the rising frequency of NB4 extreme climate events that she’s burning up and will become increasingly uninhabitable as her global temperature keeps rising at an accelerating rate. If the fires aren’t hosed down enough for the world to cool, our population will begin collapsing as rising temperatures and increasingly extreme and overlapping disasters lead to heat deaths, famines and disorder as ecosystems begin collapsing around us. The result will leave its record in geology as a global mass extinction event.

Even a 16 year-old school girl could see what we need to do:

greta-act-as-if-the-house-was-on-fire
Listen to Greta’s speech live at the World Economic forum in Davos 2019. Except for her reliance on the IPCC’s overoptimistic emissions budget, everything she says is spot on that even she, as a child, can understand the alternatives and what has to happen.

In other words, wake up! smell the smoke! see the grimly frightful reality, and fight the fire that is burning up our only planet so we can give our offspring a hopeful future. Given that we are facing an existential crisis – this is the only issue that matters until the crisis is solved. Even the IPCC’s hyper-conservative Sixth Assessment WG2 Report that looks at climate change’s global and regional impacts on ecosystems, biodiversity, and human communities makes it clear we are headed for climate catastrophe if we don’t stop the warming process.

Scott Morrison and his troop of wooden-headed puppets are doing essentially nothing to organize effective action against the warming. In fact as noted above in his master’s voice, he doesn’t hold a hose, and is determined ‘to keep Australians burning coal as long as we possibly can’ and when they can’t burn that any more, burn more natural gas. And, as I have noted in previous posts, it seems that they actively work to prevent others from acting against the climate emergency because this might harm the profits of their patrons in the fossil fuel industry.

In Greta’s words, “even a small child can understand [this]”. People hope for their children’s futures. She doesn’t want your hopium. She wants you to rationally panic enough to wake up, pay attention to reality, and fight the fire…. so our offspring can have some hope for their future.

Clearly, we need to replace the hoseless firebugs of the COALition with sensible people who are publicly committed to acting on the climate emergency or who can be counted on to vote this way because of party discipline.

Vote Climate One’s Traffic Light Voting System will help you use your preferential votes wisely on behalf of our offsprings’ future.

Views expressed in this post are those of its author(s), not necessarily all Vote Climate One members.

State of the Arctic in 2020: bad news for our future

Amer. Meteorological Society’s 2020 State of the Climate reports accelerating Arctic warming (Arctic amplification) that drives world climate

Zach Labe samples that data to show midwinter temperature over the Barents and Kara Seas has risen by more than 2 °C per decade!

Note: over the next few days I will be posting a comprehensive post on the full State of the Arctic article and the warnings we should be taking from it.

Views expressed in this post are those of its author(s), not necessarily all Vote Climate One members.

Antarctic sea ice reaches NB4 low extent this summer

Southern sea ice coverage fell below 2 million km² for first time since satellite records began in 1979, exposing more ocean to solar heating

For details see NSIDC.org

Views expressed in this post are those of its author(s), not necessarily all Vote Climate One members.

European Space Agency research on rising sea-levels

The European Space Agency presents some of its satellite-based research programs on ice melting and rising sea levels..

by Space for Our Climate 10/02/2022 — European Space Agency
New research sums up sea-level rise: Sea-level rise is arguably one of the most serious consequences of the climate crisis. While using satellite data to monitor how the height of the sea is changing provides critical evidence for decision-making, satellites are also essential to measuring the individual components, such as seawater temperature and glacier melt, that contribute to the overall rise. Confidence in the accuracy of these separate measures is key. ESA-funded research now confirms that the figures match up.

Views expressed in this post are those of its author(s), not necessarily all Vote Climate One members.

Rising sea-level risk: can’t know when or how much

Melting polar glaciers are main contributors to rising sea level. The melting process is highly non-linear and thus inherently unpredictable

At least since the 1800s, world sea levels have been rising gradually but at a slowly accelerating rate. Since in the last 140 years it has risen around 17 cm, with around 6 cm of that in the 20 years between 2000 and 2020. And this is only a small part of the hugely complex planetary climate system that has an inherently unpredictable capacity to produce abrupt and catastrophically large changes in climate conditions.

Shows a slow acceleration in the rate of sea level rise.

The rising sea-level has two sources: runoff from the land (mostly glacial melt water) and thermal expansion of the ocean itself due to warming from excess solar energy accumulating from the global warming process.

Sourced from East Coast flooding is a reminder that sea level is rising as the climate warms – here’s why the ocean is pouring in more often – by Jianjun Lin, 07/11/2021 in the Conversation.

The melt water in the rising sea-level comes from two primary sources, melting glaciers and ice cap on Greenland that has increased 6-fold over the last couple of decades; and melting glaciers and ice cap on Antarctica which has more than doubled over the same time. This is measured by the loss of mass variable – representing the weight of the water that has been added to the oceans.

As described in the feature article below, the melting rate of a glacier is determined by its speed as it is creeping/sliding down the continental slope into the ocean. This in turn is determined by a complex set of interacting factors, e.g., temperature, angle of slope, width and roughness of the bed, how much meltwater is in the bed to lubricate/float the ice, where and how the ice may crack and crumble, how many bends there are in the valley, ocean conditions at the foot, whether and to what extent warm and salty (salt lowers the melting temperature of ice) ocean water penetrates into the glacier bed under its foot, thickness and extent of the floating ice shelf at the glacier’s foot and so on. Simply stated, melt rates are inherently unpredictable. However, one thing we can be sure of is that the melt rate will speed up as ambient temperatures increase the rate of ice melting, and rain replaces snow as the main form of precipitation.

The geological record provides good evidence that episodes of abrupt ice melting can cause raise sea-levels a lot faster than they are now, perhaps even showing large changes in rate over a few decades.

See Wikipedia: Meltwater pulse 1A: Meltwater pulse 1A (MWP1a) is the name used by Quaternary geologists, paleoclimatologists, and oceanographers for a period of rapid post-glacial sea level rise, between 13,500 and 14,700 years ago, during which global sea level rose between 16 meters (52 ft) and 25 meters (82 ft) in about 400–500 years, giving mean rates of roughly 40–60 mm (0.13–0.20 ft)/yr…. This rate of sea level rise was much larger than the rate of current sea level rise, which has been estimated to be in the region of 2–3 mm (0.0066–0.0098 ft)/yr.

There may well be enough ice in the West Antarctic Ice Sheet — especially if combined with an equally rapid melting of the Greenland Ice Sheet to support an equivalent amount of melting to the Meltwater Pulse 1A. It is notable that the land surface underlying very large areas of both West Antarctica and Greenland are below sea level – giving ample opportunities for warm ocean water to help speed the melting and collapse of the ice sheets.

Glacier front meets the sea

Why Melting Ice in Antarctica is Making Waves: Scientists recently discovered that the Thwaites Ice Shelf, a floating ice shelf that supports the Florida-sized Thwaites Glacier, could collapse in as little as five years because of global warming.

Climate Reality Project, 28/01/2022

This past December, the massive Thwaites Glacier in Western Antarctica made headlines for all the wrong reasons. Specifically, because new research revealed that the ice shelf preventing it from sliding into the ocean and drastically raising sea levels could collapse well within the next decade.

This Florida-sized glacier had already worried experts for years, going as far as to regularly be called the “Doomsday Glacier”. And yet, this update from the scientific community was still groundbreaking. 

It’s news that the world — particularly low-lying island and coastal communities — should understand and act on. So, what exactly is Thwaites Glacier, what does the latest research about it say, and what consequences could come from its decline?

FIRST THINGS FIRST, WHAT IS THWAITES GLACIER?

Thwaites Glacier is a massive body of dense ice located in Western Antarctica. Measuring about 80 miles (120 km) across, it’s the widest glacier on Earth.

Decline of West Antarctic Glaciers Appears Irreversible

Thwaites Glacier in Western Antarctica. Credit: NASA

The glacier has an ice shelf — a permanent piece of floating ice connected to it — that branches out into the Amundsen Sea. Now, understanding what exactly an ice shelf does is crucial.

Read the complete article….

As long as the world continues to warm and large amounts of snow and ice remain lying on the land, sea levels will continue to rise. The risk of an abrupt sea-level rise is real. The human and economic costs of such an event would be catastrophic if it happens. It therefore makes very good sense that mitigation works should begin soon with planning in place at federal, state and local levels to accelerate the work if we have any clear early warning signs that abrupt melting is actually beginning.

It is also clear that our present LNP COALition governments deeply deny the risks Australia faces from global warming and the climate emergency, and should be replaced with rational people who put action on the climate emergency at the top of their to do lists if they should be elected to Parliament.

The puppets show and tell
Captain Humbug (A.K.A. Scotty from Marketing) showing the parliamentary puppet troop what it is all about behind his then PM, “Don’t be afraid, don’t be scared, it won’t hurt you. It’s coal.” With these words Australia’s Treasurer Scott Morrison taunted the Opposition, attempting to ridicule its commitment to renewable energy.” – Picture from The Conversation (15-02-2017). See also Katherine Murphy in The Guardian on 09/02/2017 for the live video — “Scott Morrison brings coal to question time: what fresh idiocy is this? What a bunch of clowns, hamming it up – while out in the real world an ominous and oppressive heat just won’t let up.”

Also, from the official transcript dated 20/12/2019 from the PM’s own office, Scotty made it abundantly clear to John Stanley on 2GB Radio that HE doesn’t fight fires… “But I know Australians understand… that, you know, I don’t hold a hose, mate, and I don’t sit in a control room. That’s the brave people who do that are doing that job. But I know that Australians would want me back at this time out of these fatalities. So I’ll happily come back [from his secret holiday in Hawaii] and do that.”

Sixteen year-old Greta tells us and everyone at the 2019 World Economic Forum in Davos how we and our governments should actually respond to the climate emergency:

greta-act-as-if-the-house-was-on-fire
Listen to Greta’s speech live. Except for her reliance on the IPCC’s overoptimistic emissions budget, everything she says is spot on that even she, as a child, can understand.

In other words, smell the smoke, see the reality, and fight the fire that is burning up our only planet so we can give our offspring a hopeful future. This is the only issue that matters. All Capt. Humbug and his troop of wooden-headed puppets are doing is rearranging the furniture in the burning house to be incinerated along with anything else we may care about. In Greta’s words, “even a small child can understand [this]”. People hope for their children’s futures. She doesn’t want your hope. She wants you to panic enough to wake up and fight the fire…. so she can have some hope for her future. Vote Climate One’s Traffic Light Voting System will help you use your vote wisely on behalf of our offsprings’ futures.

Views expressed in this post are those of its author(s), not necessarily all Vote Climate One members.