For IPCC views, read Tech Sum not Policy Sum

IPCC Reports are highly political processes. The Summary for Policy Makers reflects govt. views. The scientists write the Technical Summary.

Getty image / From the article

by Amy Westervelt – 12/04/2022 in Drilled

The Technical Summary kinda slaps (IPCC Mitigation Report, Part 2): Forget the Summary for Policymakers, the Technical Summary Is Where It’s At

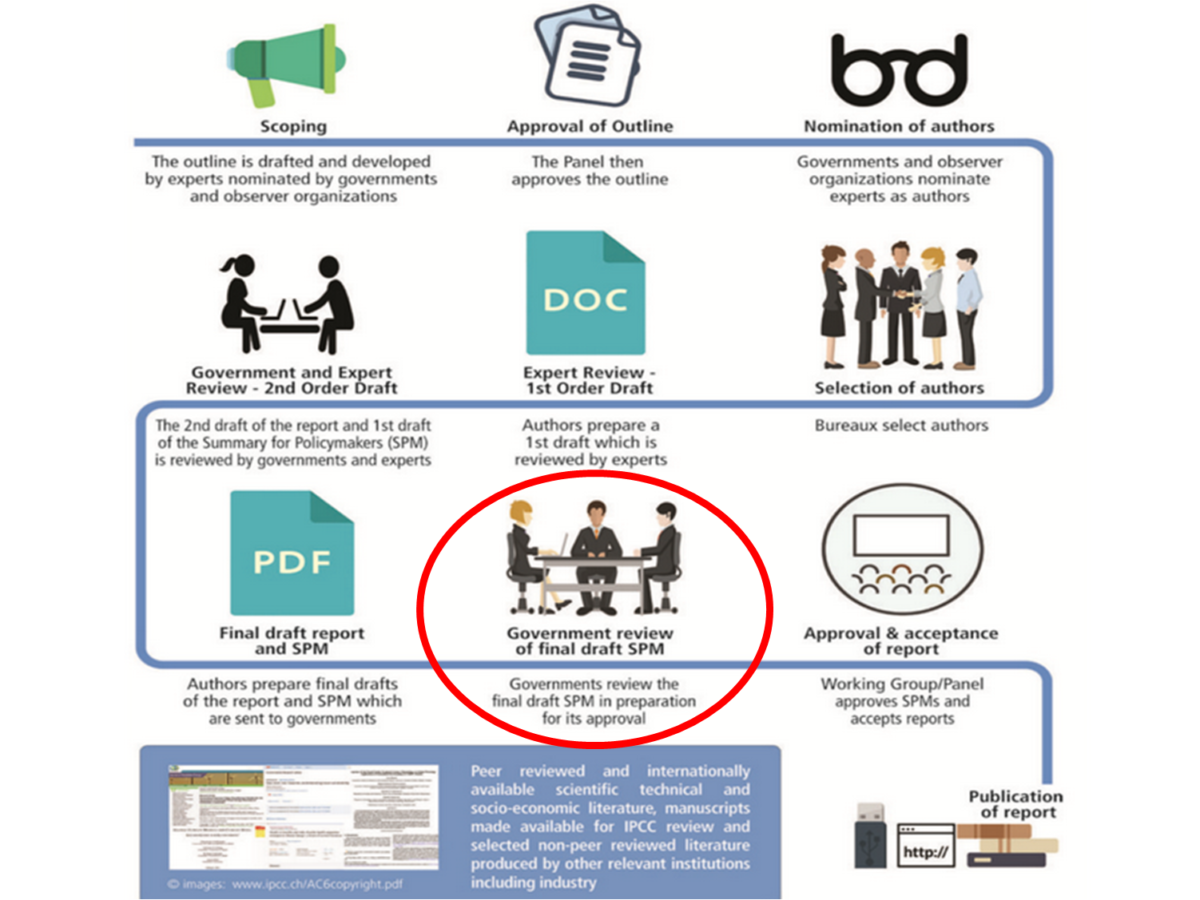
If I could give other journalists covering this report just one piece of advice, it would be this. The Summary for Policymakers (SPM) goes through a tedious approval process during which representatives from 195 governments (some of them very dependent on our continued dependence on fossil fuels, cough cough the U.S. and Saudi Arabia, I’m looking at you). The Technical Summary, on the other hand, comes straight from the authors and is generally released at the same time as the SPM. As Max Boykoff, a contributing author to Ch 13 (on policy) put it: “The technical summary is the one that’s prepared by authors of the report. So it does go through a review process by governments and experts, but ultimately the authors have a say there.” Whereas with the SPM, while authors can reject input that would make the summary inaccurate, that seems to be the most they can do to maintain the integrity of that document; preventing it from becoming a mealy-mouthed political document on the other hand, not so much.

Read the complete article….

Featured image: IPCC’s review process for formal reports. / Original source: IPCC’s Preparing Reports. Via Hall (02/2022) Some fundamental issues relating to the science underlying climate policy: The IPCC and COP26 couldn’t help but get it wrong.

Views expressed in this post are those of its author(s), not necessarily all Vote Climate One members.

Bad outlook for our next El Niño fire season

Global Ecology and Biogeography journal article forecasts that extreme/widespread fire events under 2 °C will likely exceed anything yet seen

Representative day-of-burning maps for two fires that occurred in 2020, Cameron Peak and Holiday Farm. / From the article

by Coop et al., 19/03/2022 in Global Ecology and Biogeography

Extreme fire spread events and area burned under recent and future climate in the western USA

Results: Extreme single-day fire spread events >1,100 ha (the top 16%, >1 SD) accounted for 70% of the cumulative area burned over the period of analysis. The variation in annual area burned was closely tied to the number and mean size of spread events and distributional skewness towards more large events. For example, we identified 441 extreme events in 2020 that together burned 2.2 million ha across our study area, in contrast to an average of 168 per year that burned 0.5 million ha annually between 2002 and 2019. Fire season climate variables were correlated with the annual number of extreme events and area burned. Our models predicted that the annual number of extreme fire spread events more than double under a 2°C warming scenario, with an attendant doubling in the area burned.

Conclusions: Exceptional fire seasons like 2020 will become more likely, and wildfire activity under future extremes is predicted to exceed anything yet witnessed. Safeguarding human communities and supporting resilient ecosystems will require new lines of scientific inquiry, new land management approaches and accelerated climate mitigation efforts.

Read the complete article….

Featured Image: Hypothetical distribution of daily fire spread events during normal and extreme fire years. Increases in the annual area burned could potentially be accounted for by more fire spread events (number), larger event size (mean) and/or more large events (right skewness) / From the article

Views expressed in this post are those of its author(s), not necessarily all Vote Climate One members.

Not much ice left – warm blue arctic ocean due soon

Blue oceans absorb more heat than ice caps. Loss of thick ice at winter’s end makes blue ocean likely soon. Expect more extreme weather!

Loss of thicker March sea ice from 1979 to 2022 Zack Labe, 12/04/2022

Featured Image: Arctic Sea Ice Thickness By Year. / Data: PIOMASS v2.1 (Zhang & Rothrock 2003) from 1979-2022 (averaged with ≥0.15 thickness) / Source: http://psc.apl.uw.edu/research/projects/arctic-sea-ice-volume-anomaly/ / Graphic: Zachary Labe (@ZLabe)

Views expressed in this post are those of its author(s), not necessarily all Vote Climate One members.

Heat pumps save energy for heating and cooling

Heat pumps use physical laws of thermodynamics to move large amounts of thermal energy for heating and cooling with little energy expenditure.

Image: Polytechnic University of Valencia / from the article

by Emiliano Bellini, 08/04/2020 in PV Magazine

Residential heat pump produces water up to 75 C: Scientists in Spain have developed a new heat pump that can produce 6.49 kWh of heat for each kilowatt-hour of power it consumes. The device could generate hot water at a temperature of up to 75 C.

Researchers from the Polytechnic University of Valencia in Spain and heating specialist Saunier Duval, a unit of Germany-based Vaillant Group, have developed a new residential heat pump based on natural refrigerants.

The device uses propane as a refrigerant, which allows for high energy efficiency, while keeping carbon dioxide emissions to almost zero.

“Our heat pump can heat homes completely environmentally friendly, without emitting carbon dioxide into the atmosphere. In addition, its high-efficiency energy allows it to be classified as renewable energy, by pumping energy from the environment”, said researcher José Gonzalvez.

Read the complete article….

Featured image: Diagram of a phase change heat pump. Legend: 1. Condenser coil (hot side heat exchanger, gas cools and liquifies); 2 Metering Device (liquid expands and cools), 3. Evaporator coil (cold side heat exchanger, liquid vaporizes and heats up), 4. Compressor (gas is compressed and heats up). Red = Gas at high pressure and very high temperature, Pink = Liquid at high pressure and high temperature, Blue = Liquid at low pressure and very low temperature, Light Blue = Gas at low pressure and low temperature. Note: the arrows in the diagram are meant to indicate the flow of air and coolant; they do not correspond to heat flow, which in the system depicted is (generally) from right to left. / Author: Ilmari Karonen, own work / Licensing: Public Domain.

Views expressed in this post are those of its author(s), not necessarily all Vote Climate One members.

As bad as it is, IPCC Report likely understates reality

Saudi Arabia, India, China, (Australia) and a few other countries have sought to make changes that would weaken the final warnings.

Students protest in Toulouse, France, on 25 March, about government inaction on climate change. Photograph: Alain Pitton/NurPhoto/REX/Shutterstock / from the article.

by Fiona Harvey, 02/24/2022 in The Guardian

Dire warning on climate change ‘is being ignored’ amid war and economic turmoil: The third segment of the Intergovernmental Panel on Climate Change report is being overshadowed, just like the previous one

Saudi Arabia, India, China and a few other countries have sought to make changes that would weaken the final warnings, the Observer understands. Some governments are anxious to avoid policy advice such as cutting subsidies to fossil fuels, even though these are widely espoused by leading authorities.This process of refinement – which has also been a complaint in the previous chapters of the IPCC assessment – is defended by some, as producing a document that all governments must “own”, as they have all had input. But many scientists are growing increasingly f

rustrated, as it produces a conservative and sometimes watered down document that many feel does not reflect the urgency and shocking nature of the threat.

Read the complete article….

Featured image: An earlier report streamed to a press conference at the Swiss Academy of Sciences in Bern last August. Photograph: Alessandro Della Valle/EPA / from the article.

Views expressed in this post are those of its author(s), not necessarily all Vote Climate One members.

IPCC: Summary of importance of 3 part AR6 Report

Following up on my comprehensive post, The Guardian succinctly explains why the 3 parts of the complete AR6 need to be considered by everyone.

The latest report said that temperatures could rise by as much as 3C, a catastrophic level. Photograph: Mario Hoppmann/AFP/Getty Images / From the article

by Fiona Harvey, 05/04/2022 in the Guardian

Why are the three IPCC working group reports significant? Explainer: The IPCC has now published all parts of its landmark review of climate science.

The Intergovernmental Panel on Climate Change (IPCC), made up of the world’s leading climate scientists, has now published all three sections of its landmark comprehensive review of climate science.

Yet the picture could already be even worse than the IPCC has presented. The IPCC data took in research papers published from 2014 up to last year, but since then the world has experienced even more extreme weather. The IPCC reports are regarded as cautious and conservative by many scientists, and the summary for policymakers that sets out the key messages of each working group are subject to inputs from governments that some regard as watering down.

Read the complete article….

Featured Image: IPCC Sixth Assessment Report (AR6) – complete. From the IPCC Web site.

Views expressed in this post are those of its author(s), not necessarily all Vote Climate One members.

Implications for Australia in latest IPCC report

The IPCC has warned that if we don’t stop and reverse global warming now it will soon be too late to avoid climate catastrophe and suffering.


The IPCC makes it clear that promotion of coal and gas – a favourite pastime of Australian politicians – is making it harder to keep global heating to 1.5C. Photograph: Saeed Khan/AFP/Getty Images / from the article

By Adam Morton and Graham Readfearn, 09/04/2022 in The Guardian

Latest IPCC report offers key lessons for Australia but is anyone listening? The climate authority has warned it is now or never to cut emissions but will MPs on the campaign trail heed its warning?

Perhaps the message was too familiar. With the unofficial election campaign under way, and the prime minister mired in escalating allegations of bullying and duplicity, a major report by the Intergovernmental Panel on Climate Change – the world’s most respected climate science body – quickly disappeared from the Australian news cycle this week.

Headlines told part of the story: it was “now or never” if the world was to limit global heating to 1.5C above pre-industrial levels. The report suggests that threshold is already practically out of reach without using technology to suck carbon dioxide from the sky. Keeping heating below 2C, which would trigger damage several magnitudes worse than 1.5C, will require an “abrupt acceleration” of effort after 2030.

Read the complete article….

Featured Image: Scenarios in a mathematical model by en:Adam Frank et al., 2018, which describes climate change due to GHG emissions by an advanced energy-intensive civilization.[1] From left to right, top to bottom: Die-off: The world population reaches a peak and subsequently declines slowly until an equilibrium is attained. Population can decline by up to 90% after peaking; according to Frank, such a civilization “might well just descend into chaos.” Sustainability: Both the world population and average surface temperature rise and then level off. This scenario shows that civilizations can be stable in the long term. Collapse without resource change: A civilization makes no attempt to switch to less GHG-intensive energy and collapses due to runaway climate change, possibly going extinct. Collapse with resource change: A civilization transitions to less GHG-neutral energy, but collapses anyway due to triggering a tipping point in the climate system. / 3-01-2021 by LaundryPizza03 – Own work; adapted from a figure in Billings, 2018. / via Wikimedia Commons.

Views expressed in this post are those of its author(s), not necessarily all Vote Climate One members.

Given his history is anything he says believable?

Scotty from Marketing and Capt. Humbug are good names for a PM who is clueless how to discuss the physical realities of the world we live in.

Featured image. Aside from his failure to know a fact when he trips on it, there are some other things he doesn’t do well either….

Views expressed in this post are those of its author(s), not necessarily all Vote Climate One members.

Video report: Arctic warming and scientific conservatism

A personal story on Arctic climate change filled with facts together with discussion of how ‘conservative science’ nobbles urgency of action.

What Arctic climate tells us – It’s worse than we are told: Why science communication is conservative.

by Jason Box, 08/01/2022 on YouTube

Greenland ice melt – why climate communication is conservative – personal story

Featured image: 2100 years of summer Arctic air temperatures under different IPCC climate models. / From the video.

Views expressed in this post are those of its author(s), not necessarily all Vote Climate One members.

History: First real evidence for abrupt climate change

1969 Greenland ice cores provide convincingly accurately timed evidence for abrupt major changes in Earth temperatures and global warming.

Wally Broecker, shown here in 1997, proposed that the shutdown of a major ocean circulation pattern could lead to abrupt climate change. Jean-Louis Atlan/Paris Match via Getty Images / from the Article

by Alexandra Witze, 29/03/2022 in Science News

Wally Broecker divined how the climate could suddenly shift: The shutdown of an ocean conveyor belt could cause abrupt climate change

It was the mid-1980s, at a meeting in Switzerland, when Wally Broecker’s ears perked up. Scientist Hans Oeschger was describing an ice core drilled at a military radar station in southern Greenland. Layer by layer, the 2-kilometer-long core revealed what the climate there was like thousands of years ago. Climate shifts, inferred from the amounts of carbon dioxide and of a form of oxygen in the core, played out surprisingly quickly — within just a few decades. It seemed almost too fast to be true.

Read the complete article….

Editor’s note: See Broecker’s 1975 paper, Are We on the Brink of a Pronounced Global Warming? in Science, that gave us early warning 47 years ago on what might be happening. How different our future might have been if humanity took that warning seriously.

Leland_McInnes at en.wikipedia(red) GRIP data: http://www.glaciology.gfy.ku.dk/data/grip-ss09sea-cl-50yr.stp (blue) NGRIP data:http://www.glaciology.gfy.ku.dk/data/NGRIP_d18O_50yrs.txt / License: CC BY-SA 3.0

Views expressed in this post are those of its author(s), not necessarily all Vote Climate One members.