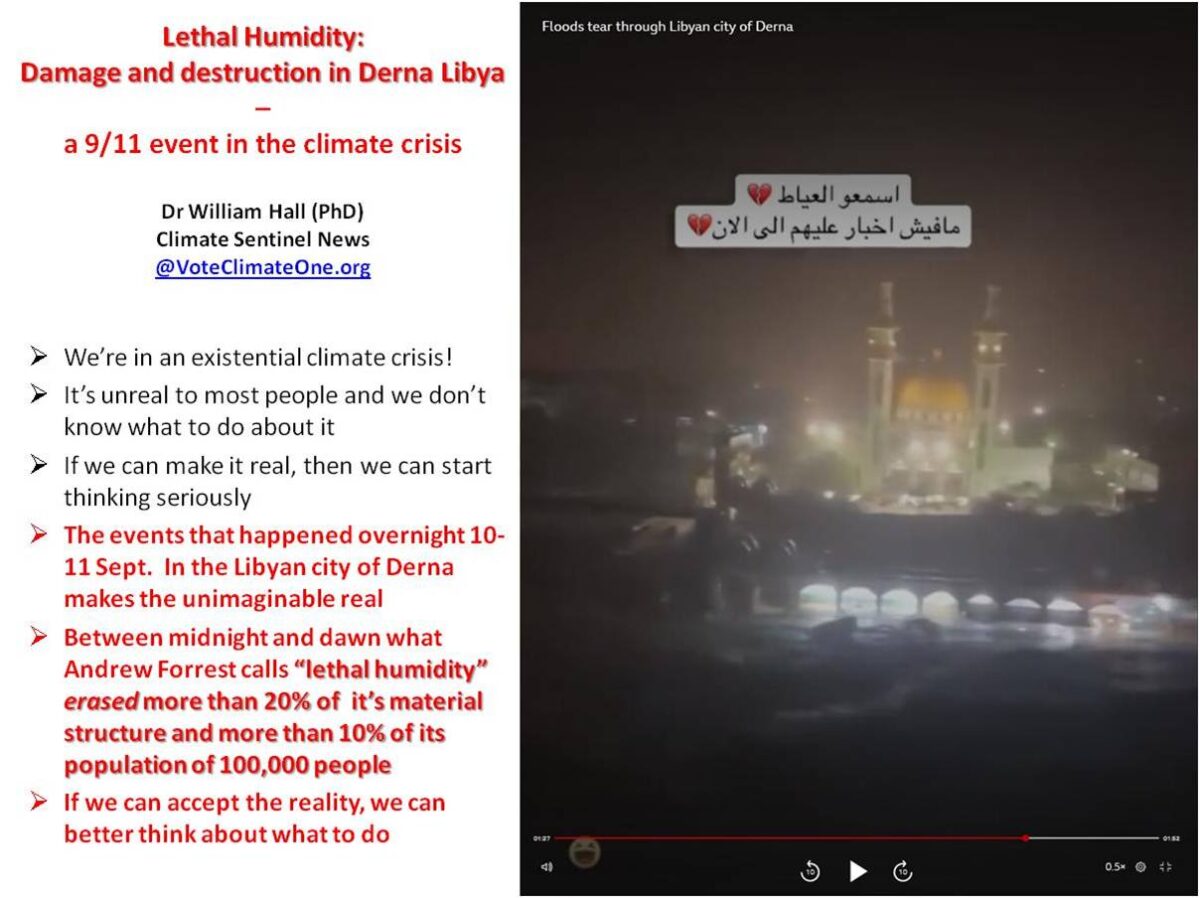
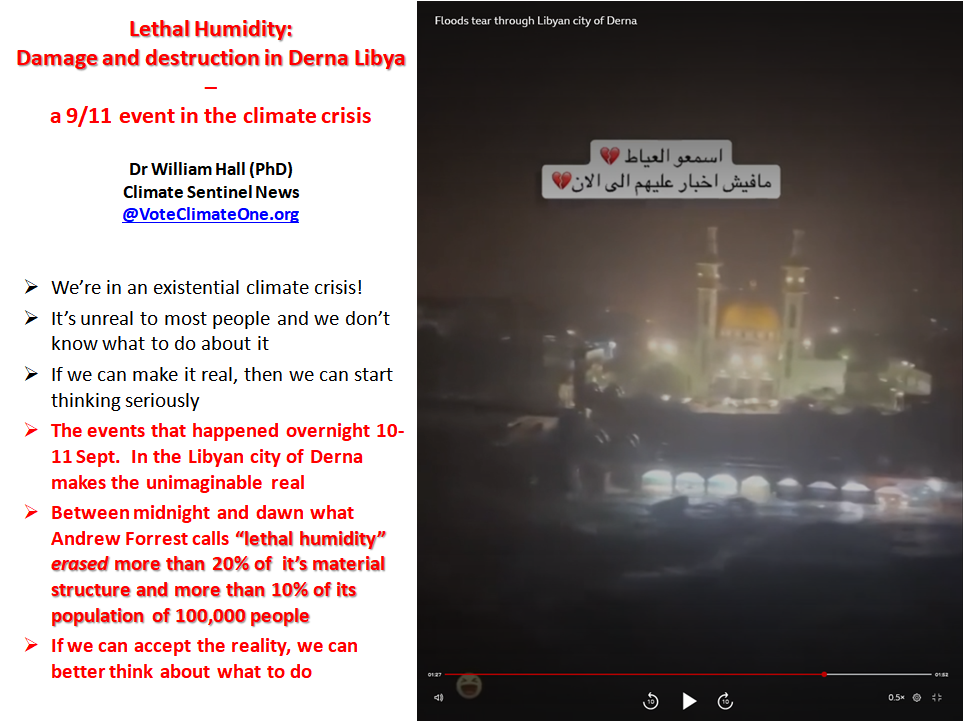
Lethal Humidity for Derna – a 9/11 event in the climate crisis

(Rev. 2 – 29/10/2023)

Water was the cradle and mother of all life. When the world is too hot it is also the destructor that erases life, as in Derna, Libya on 11/09/2023

Life originated in the sea, dependent on and driven by water based chemistry. When our remote ancestors colonized the land more than 300 million years ago they had to carry enough water in their bodies to keep the organic chemistry of life working. Even today, between 50 and 60% of our body weight is the water surrounding and supporting our metabolic chemistry — truly water is the cradle of our life. Water-based chemistry is also controlled by temperature. Most of life’s chemical processes are facilitated and regulated by proteins called enzymes. Protein structure and function are strongly dependent on the temperature of the surrounding water. Water temperature also affects the rates of chemical reactions irrespective of any changes do enzymes.

For billions of years, complex life on Earth has evolved to live in a temperature range between water’s freezing point and a maximum of 35-45 °C. Mammals (like us) and birds who have evolved evaporative cooling (e.g., sweating) can survive somewhat higher environmental temperatures for a while if they can maintain the flow of water through their bodies. However, if our body temperature rises more than a degree or two above 40° for more than an hour or so it’s lethal because enzymes begin to denature and the chemical processes in our body cells no longer coordinate the keep us alive. We die ! (ref Wikipedia Colonization of land, Thermoregulation, Human body temperature).

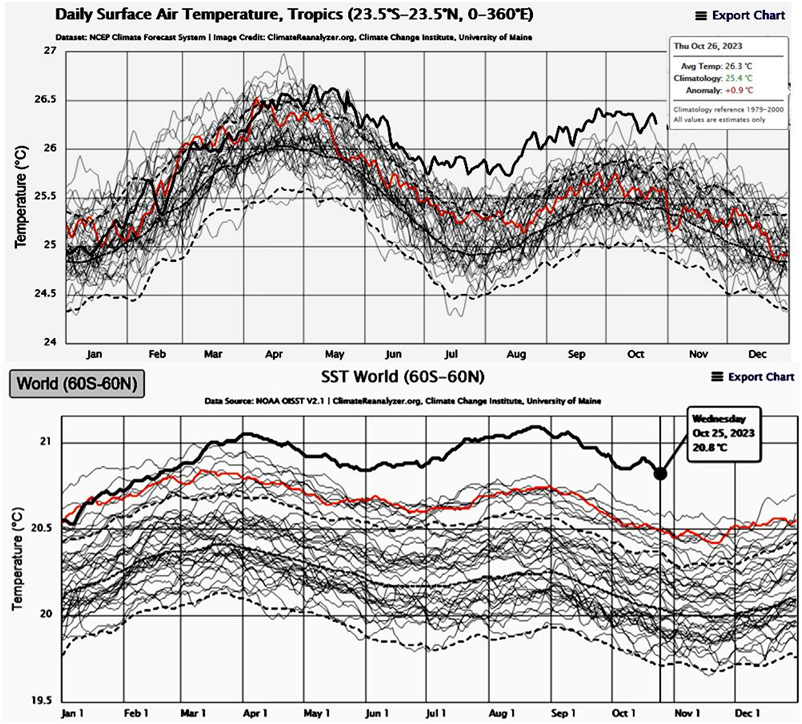
As our planet grows ever hotter as a consequence of human’s industrial conversion of fossil carbon into greenhouse gases, rising temperatures are triggering a growing range of extreme and increasingly lethal ‘weather’ events. Many of these involve the effects of excess heat working with the physical properties of water — and we are far from understanding all of the implications for understanding this.

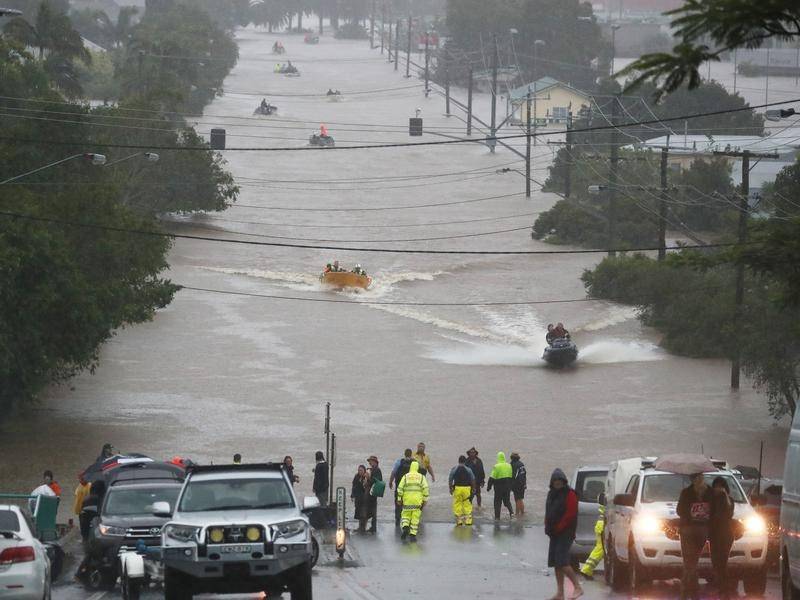
The latest example of lethal humidity at work was the rapid intensification of tropical rainstorm Otis in less than 24 hours into the “apocalyptic” category 5 hurricane that struck the tourist town of Acapulco on the Mexican Pacific coast around 1:00 AM on 25 October, 2023. None of the forecast models run on the 14th predicted that it would even become a hurricane at all. And then there’s Tropical Cyclone Lola, the earliest cat. 5 cyclone ever recorded in the Southern Hemisphere that has just savaged Vanuatu on the same day.

Last month’s example of lethal humidity working in unprecedented ways is presented below.

During the dark early hours of Sept. 11, 2023 hot water demonstrated the power of humid air to erase life in the the normally dry drainage upstream from, and in the center of the Libyan city of Derna in a cataclysm never before seen in its ~2,600 year recorded history.
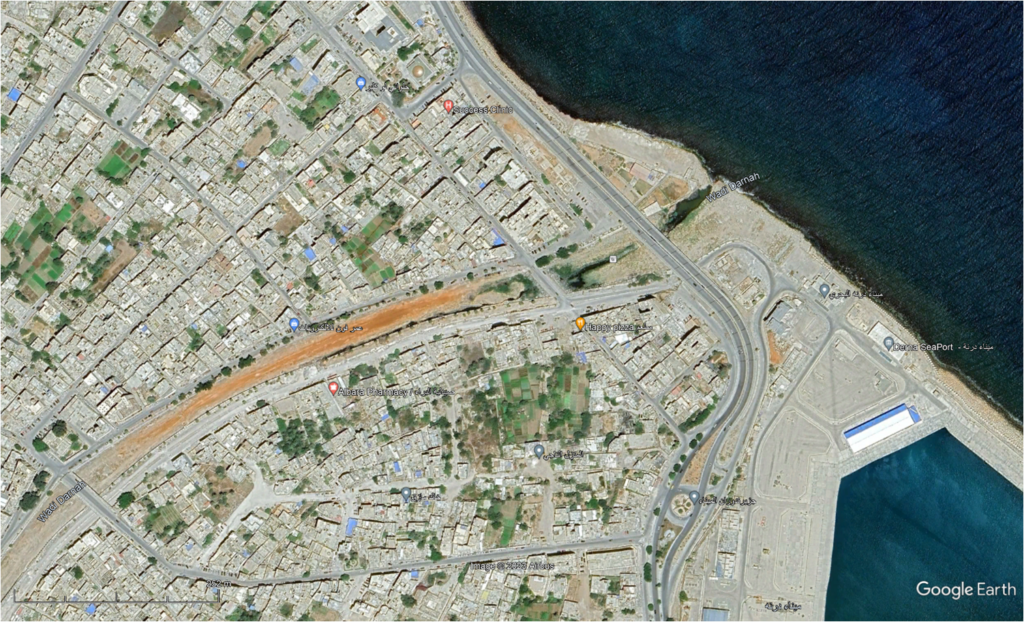
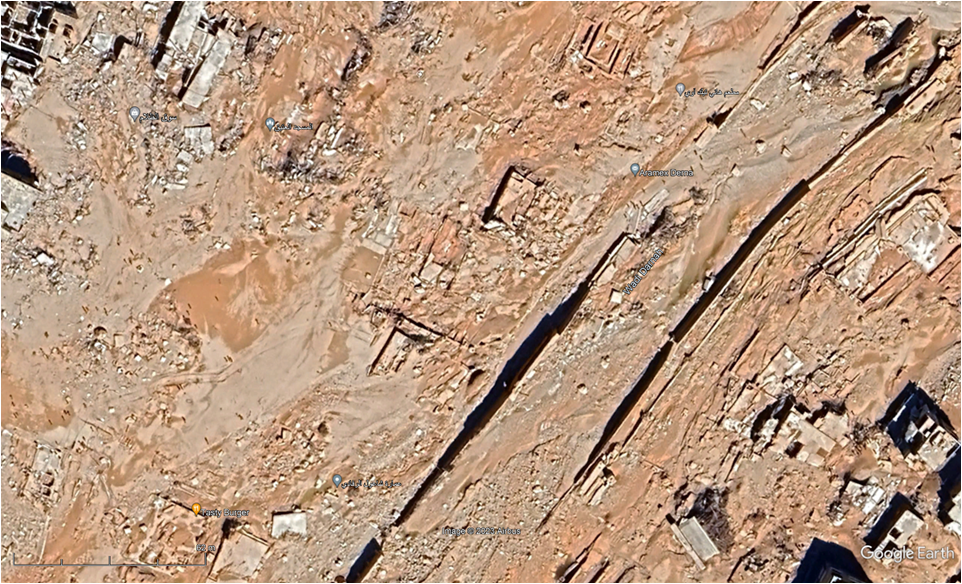
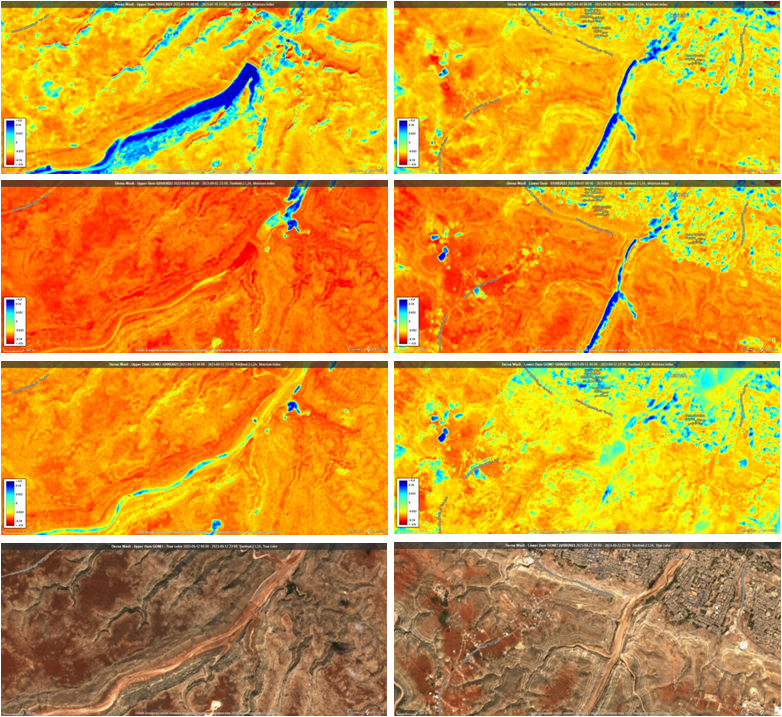
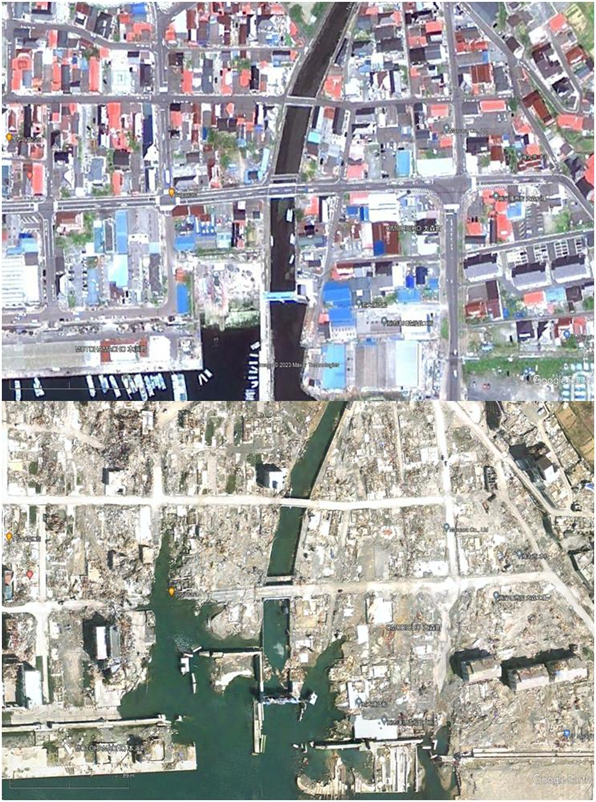
This satellite imagery can be viewed by anyone with a desktop computer by downloading the freely available Google Earth Pro (Windows, Apple, Linex), searching for “Derna, Libya”. Vision beginning with Planet Earth will zoom into about 8 km above your requested location. If you then search for “Al Sahaba Mosque” vision will zoom in to about 1 km showing the latest high-resolution satellite imagery of Derna’s center from late morning on Sept 13, around 56-58 hours after the peak of the cataclysm. Using your mouse wheel you can zoom in to ~12 m above the ground where you can readily see the ant-like shadows of individual survivors crossing the now dry wadi on foot, and the first attempts to make temporary roads to reconnect eastern and western parts of coastal Libya. Earth Pro also provides access to historical imagery (click the Time Time 
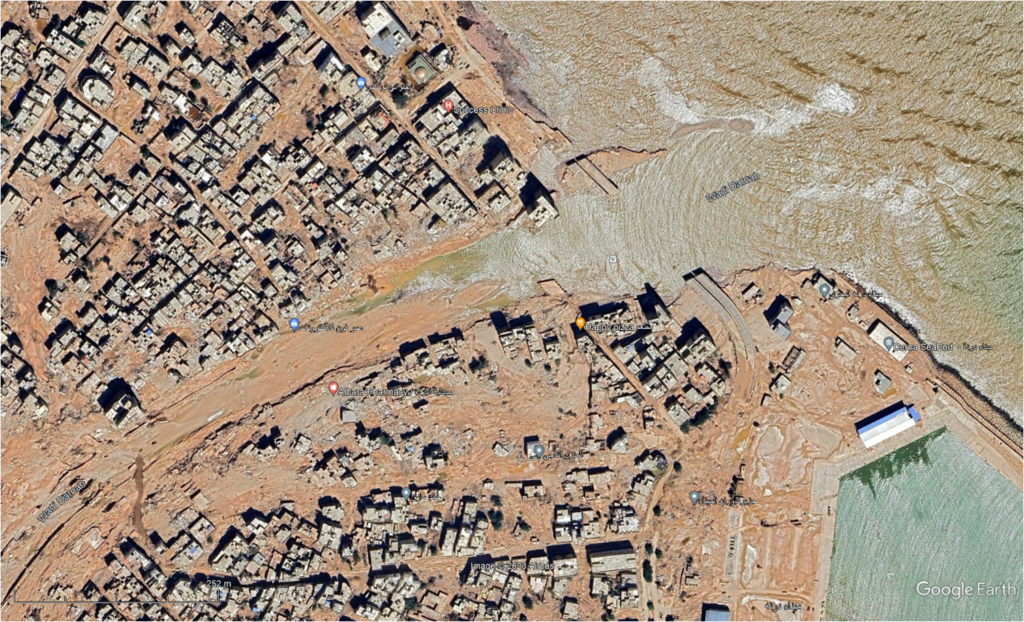
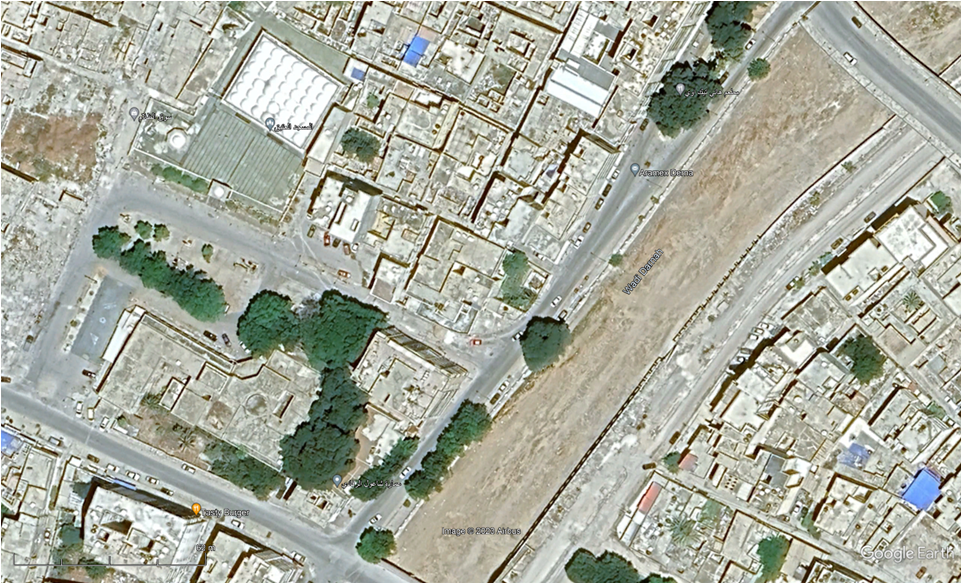
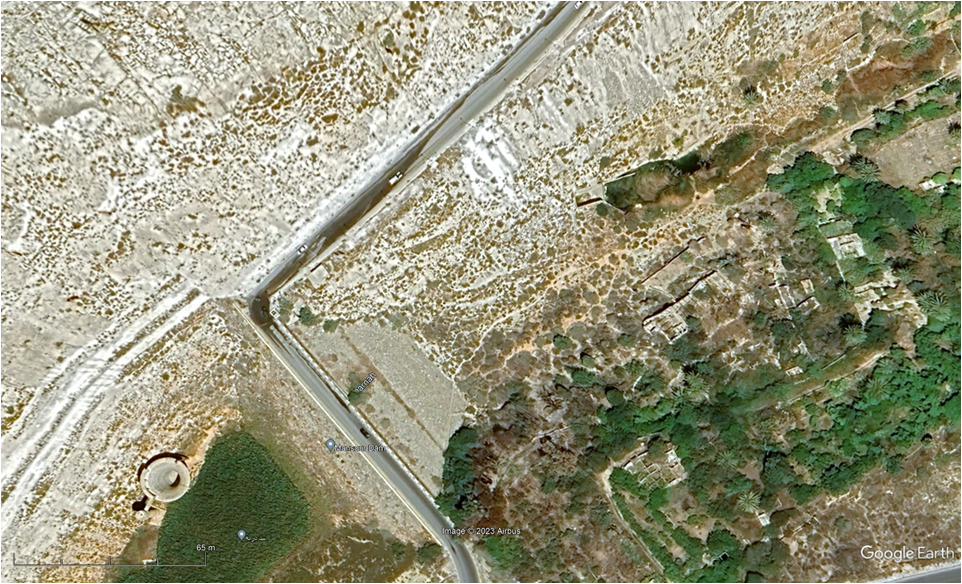
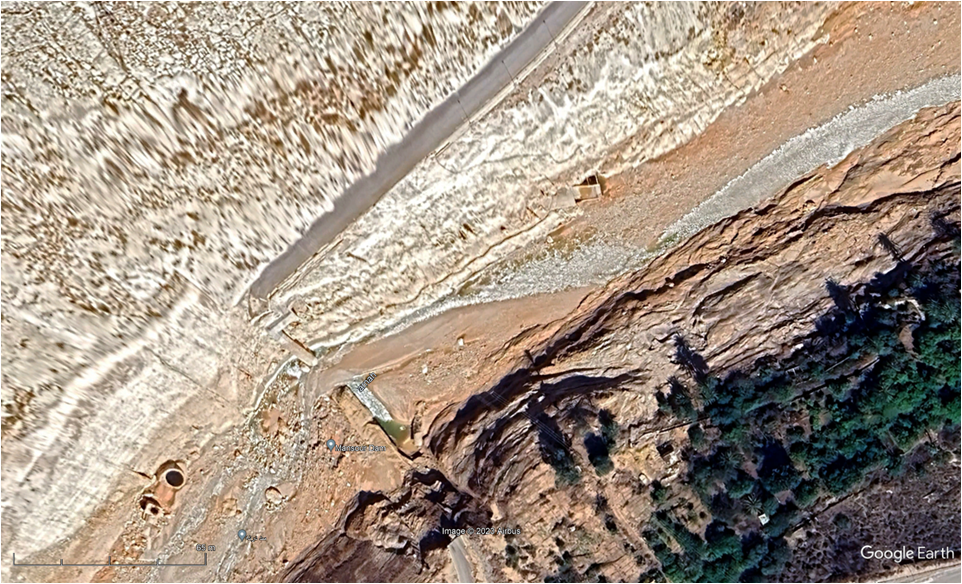
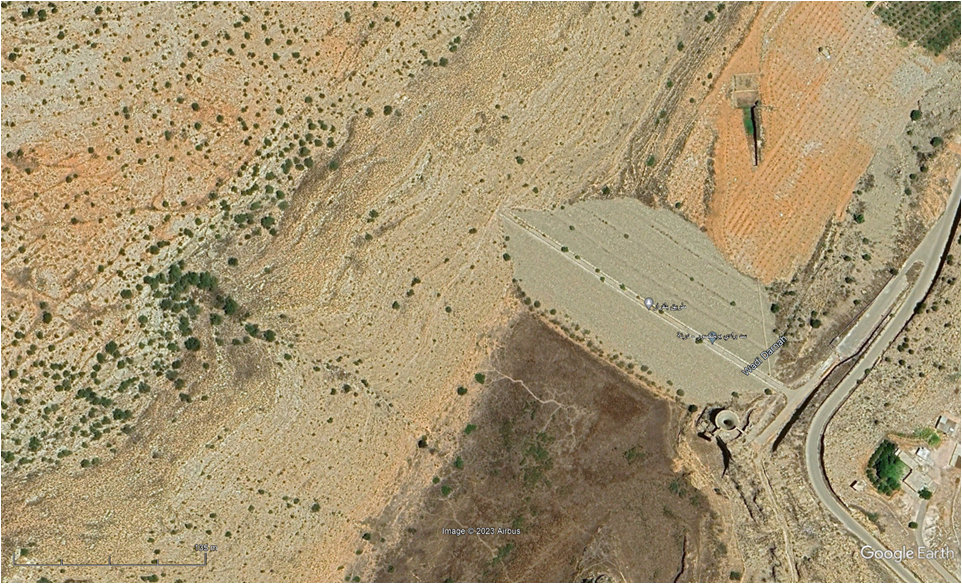
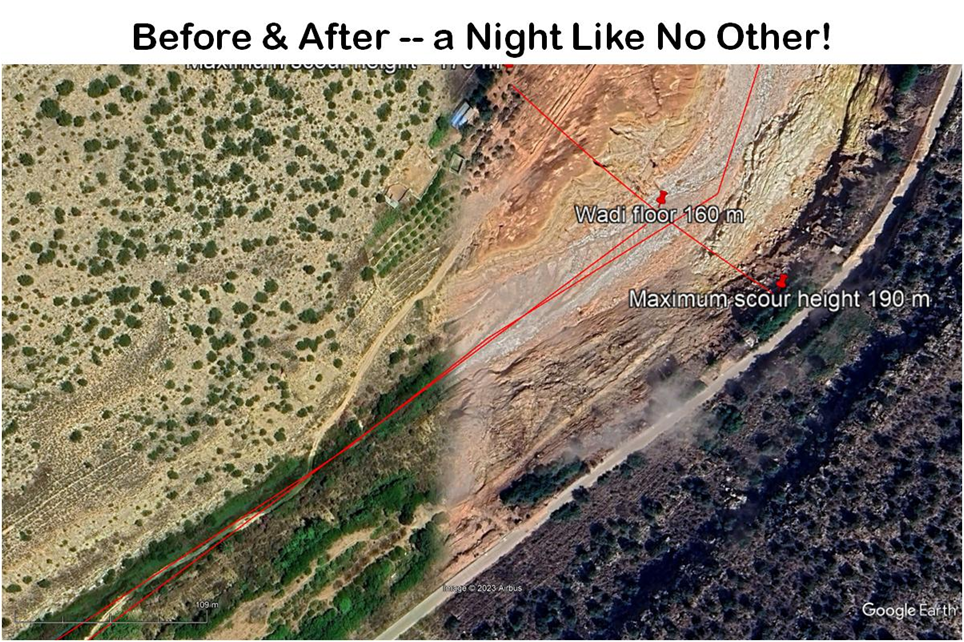
icon) allows you to travel back in time through historical imagery. The most recent imagery (also providing the highest resolution) prior to the cataclysm is from June 19. This provides the “before” vision of Derna. Unfortunately the post-cataclysm imagery has only limited coverage. The image above, at one edge of a Sept. 13 tile crossing the wadi provides the before and after in a single image. The image below compares the before and after of the mosque and the area to its north. The red lines are sight lines and measurements left by various measuring tools I used in trying to understand and reconstruct what what happened here in the early hours of Sept. 11.

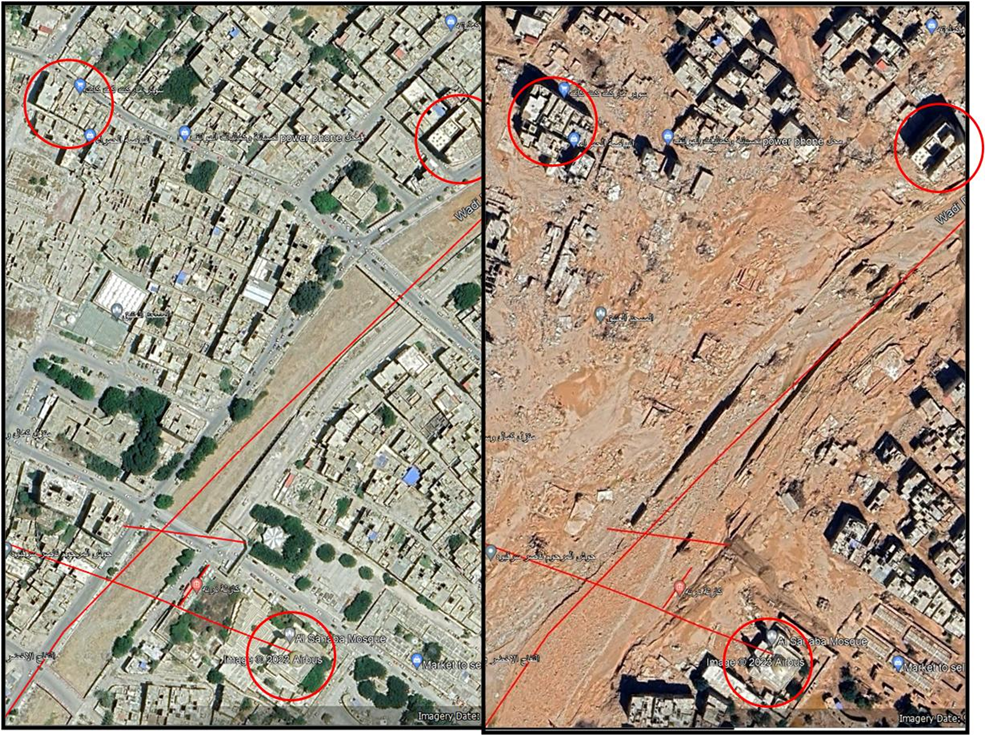
The idea of “lethal humidity”

I was reminded of the fact that humidity can be lethal by Dr Andrew (“Twiggy”) Forrest’s recently initiated speaking tour on the climate emergency to economic forums, world leaders and top universities in the world. He stresses that if global warming is not stopped and reversed, a major killer will be heat deaths caused by the growing heat accompanied by excessive humidity from the increasing amount of water evaporated by the high temperatures.

Forrest, one of Australia’s leading multi-billion dollar mining and industrial carbon emitters, has accepted the reality that global warming caused largely by his and other industries will cause near-term human extinction. He began broadcasting his concerns and the absolute urgency of stopping and reversing the warming if we are to avoid social collapse and subsequent extinction. He first raised this at the Boao Asia Forum — sponsored by China in Perth on 30 August (transcript here), and more recently at Oxford University (video below) – the start of a global lecture tour to key universities around the world accompanied with meetings of world leaders and at COP 28.

As Forrest said in the Boao Address, this is not a concern for the future, but right now! Substantial numbers of people are already being killed by the accelerating warming. The main killer will be what he calls “lethal humidity”. As noted above, if the air is too hot, and humid as well, without air conditioning we die within hours. (He says that survival in these areas will depend on air conditioning – assuming the power doesn’t fail). Forrest stressed that large areas of the world, including areas of India, China and America are crossing that threshold right now. These points were reiterated and expanded on in a lecture and “Fireside Chat” at Oxford University .

In the “Fireside Chat” sponsored by the Rhode’s Trust, Forrest expanded considerably on his ideas expressed at Boao and lecture covering the urgent and critical need for people in general to force governments and industry to act seriously on climate change. This Q&A ‘chat’ runs for another hour, but is well worth listening to if you have any concerns about futures for yourself and your family members.

My Climate Sentinel News article following up on the Boao address, Billionaires & action groups can save the world together! summarizes the contexts (including his ‘time out’ from empire building to earn a PhD in marine ecology) that led Forrest to his current mission — and what the climate and environmental action movement needs to do to assist the global mobilization needed to stop and reverse the warming process.

However, as strongly as Forrest stresses the dangers of the heat deaths humidity will cause in our progress towards global extinction, high humidity can also be even more catastrophically deadly in other ways.

The lesson of Derna, Libya is that humidity can lead to the destruction of not just human lives, but all visible life in given areas, and even the infrastructure created by humans or any other evidence that life ever existed in those areas.

Another way too much water in the atmosphere will kill us

On 10 September, 2023, the ancient and small but relatively prosperous port city of Derna, Libya had a population around 100,000 people. Its history traces back to the settlement of Cyrenaica (the eastern, coastal part of Libya) by the ancient Greeks in the 7th Century BCE. It was an easy place to settle because the inland plateau area was suitable for agriculture and the small delta of the wadi draining the plateau offered a reasonable area of flatish land close to sea level on the normally steep shoreline for a port and settlement. Since Derna was settled it has been a secondary port city that served at various times as a regional capitol that was comfortably wealthy from the agricultural productivity of the hinterland during periods with adequate rain and its proximity to Rome on the other side of the Mediterranean. Under Muammar Gaddafi, Derna benefited from Libya’s oil revenue.

However, due to Derna’s location on the sediment fan (or delta) formed at the mouth of a relatively steep wadi draining somewhat more than 500 km², it has been subject to occasional damaging floods. But nothing remotely comparable to the 11 September cataclysm had ever been recorded before in Derna’s 2,600 year history.

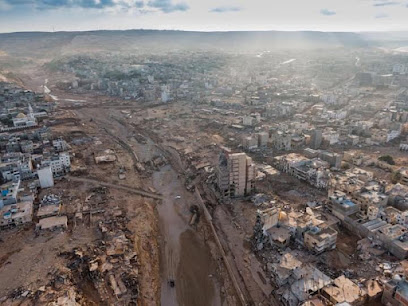
What happened in the early hours of 11 September literally ‘erased’ more than 20% of the city and more than 10% of its total human population from the earth. Derna warns us that water, the cradle and mother of all life (can and will destroy most of that life if we allow the planet to grow much hotter than it it already is.

“Evaporation” is what happens as individual H₂O molecules break free from a liquid mass of water to form the gaseous phase or vapor of water that basically dissolves in the atmosphere. As liquid water warms, the rate of evaporation increases up to a limit determined by the pressure of other kinds of gases forming the atmosphere. If the vapor molecules become frequent enough they will begin to stick together to “condense’ back into the liquid state. it takes a lot of extra energy for a water molecule to actually evaporate free of a mass of liquid water. This energy is released as the “heat of condensation” when the water molecule returns to the liquid state. The rates of condensation and evaporation vary significantly with changes of temperature.

Aside from controlling the rates of evaporation and condensation, temperature also strongly influences how much water vapor can dissolve into the air before it starts condensing. As air temperature increases, the amount of water vapor it can carry before condensation begins also increases about 7% for every °C of temperature increase.

Global 2 m (‘surface”) air temperature has been in in world record territory since the end of May this year. Sea Surface Temperture has been been in world record territory since mid May (more than 7 MONTHS!). Hotter water evaporates more water vapor, hotter air absorbs and transports ever more water as vapor.

“Gas Laws ” relate air pressure, density of a given mass of air. As air warms it absorbs energy to become less dense by expanding. As it cools, its density increases and heat is released. In the atmosphere this leads to convection. with warm air rising and cooling as it expands while tending to cool further by radiation of excess heat to space until it cools enough that again becomes dense enough to sink alongside rising hotter air.

More details of the physics of water, how its various states are measured, and water’s implications for weather can be found in my mailing to politicians, “Act Now – Later may be too late” and in the related “Global Climate Change Now“.

My presentation linked below makes the case that Derna demonstrates how heat and too much water in the atmosphere can do far worse things than just cooking people by preventing evaporative cooling. The more water vapor in the atmosphere the more water there is to drop on the land, and the more heat energy there is available to force wet air masses high in the sky to squeeze out the last drop of what was already an excess load of water as rain and ice (the freezing of ice from water releases still more energy (the energy of fusion) to drive the weather to even further extremes.

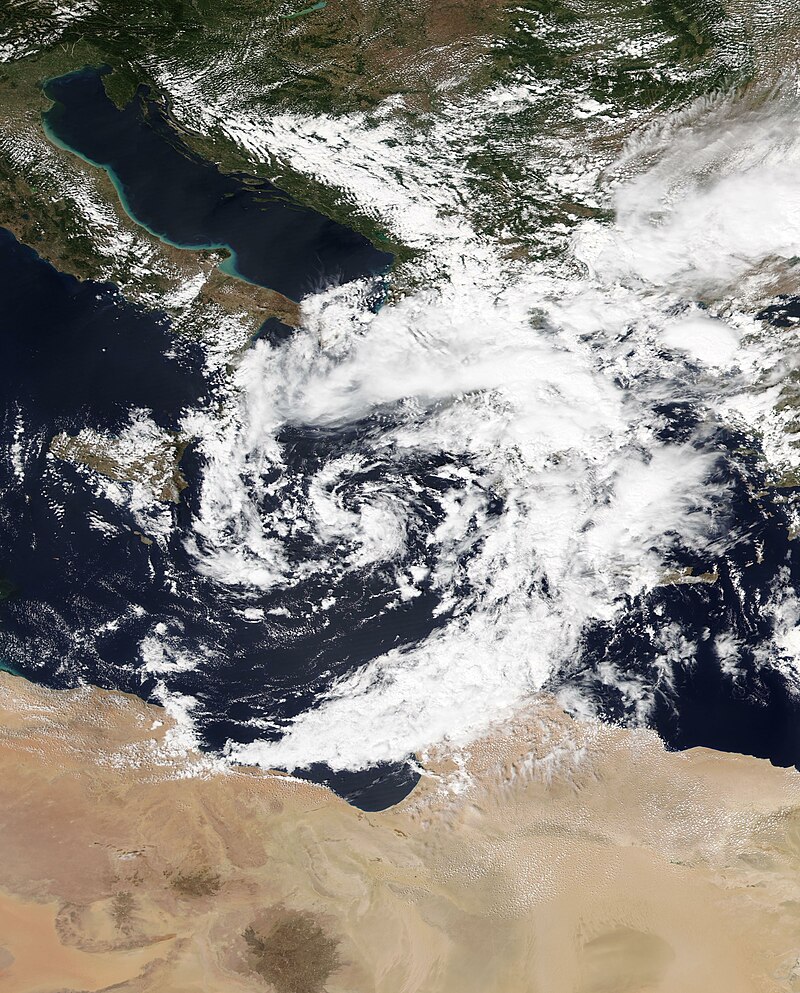
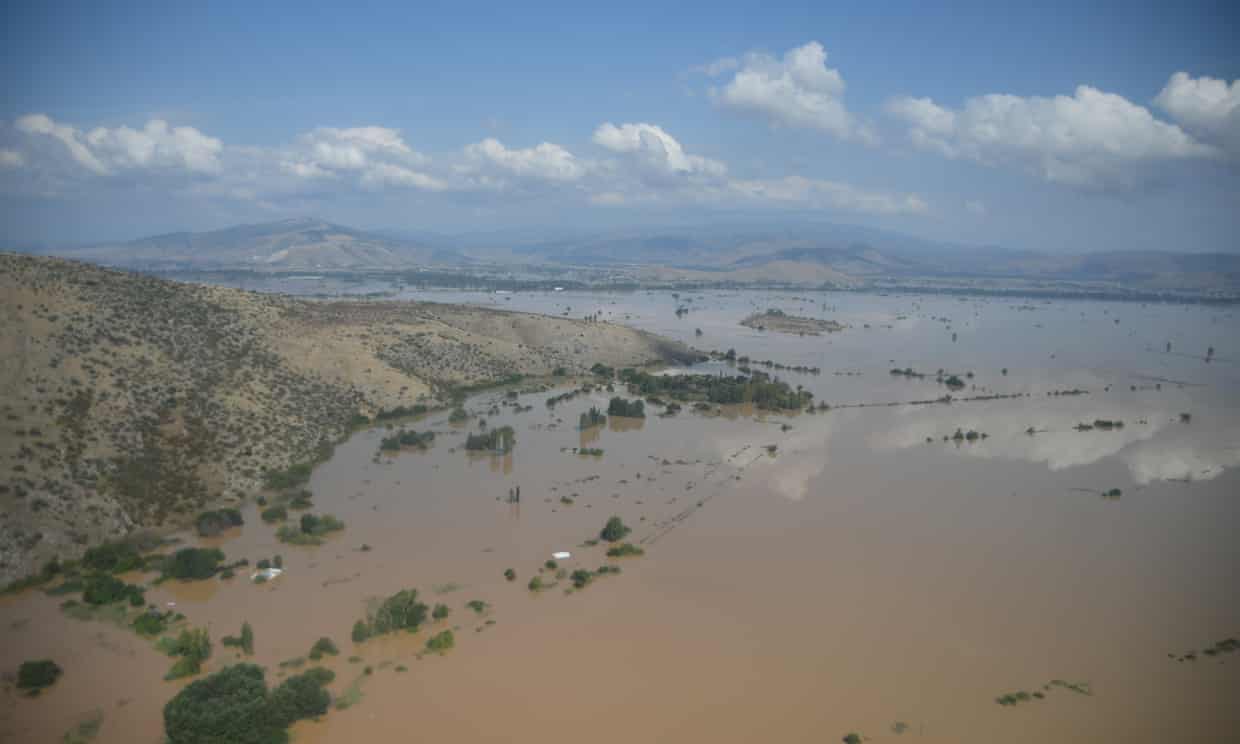
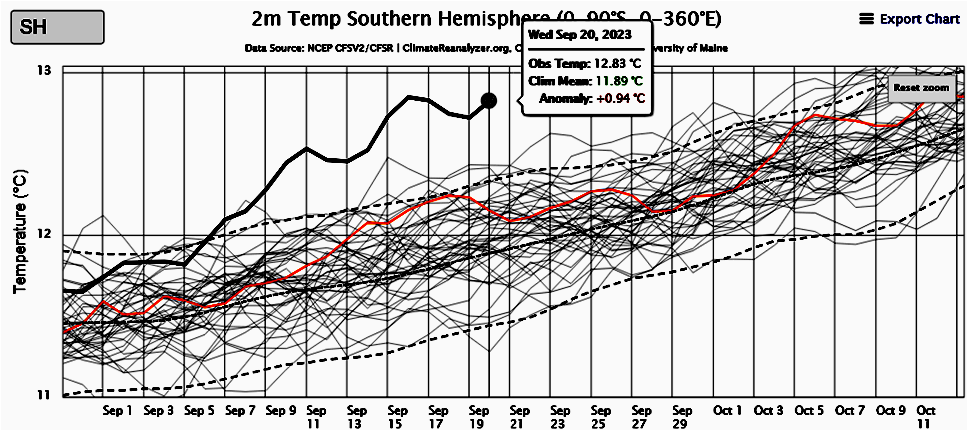
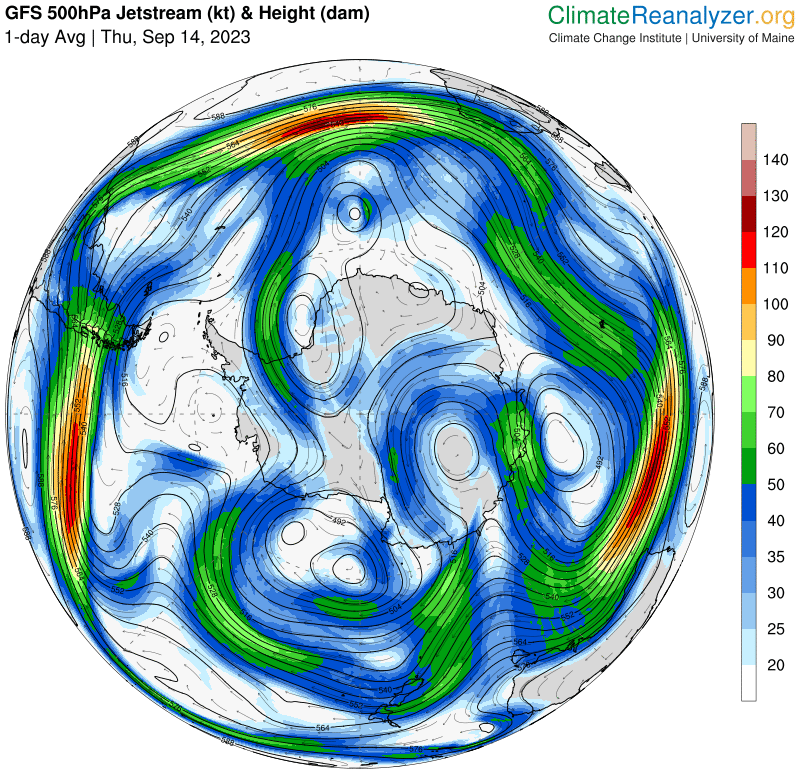
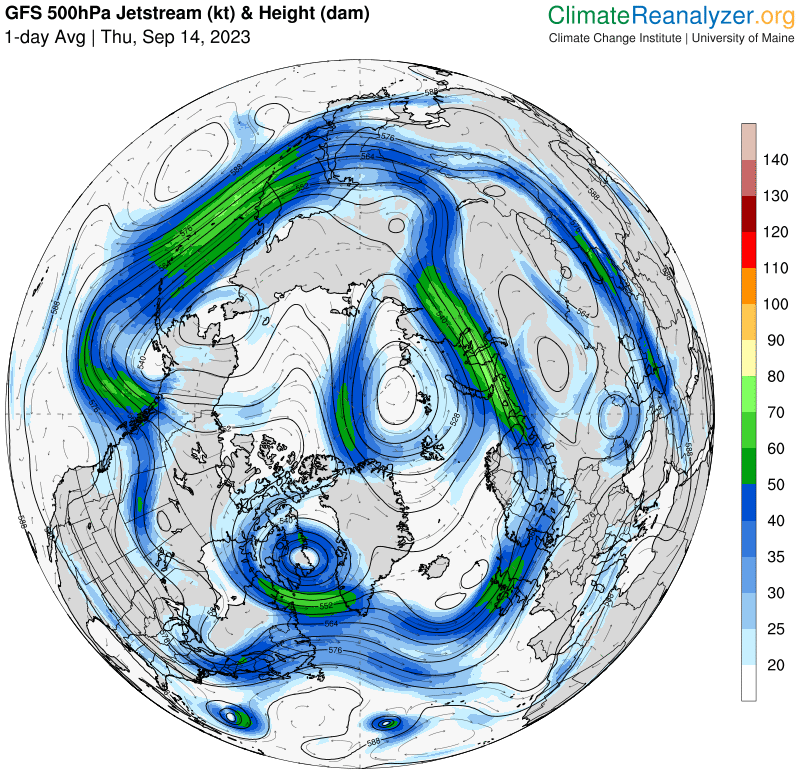
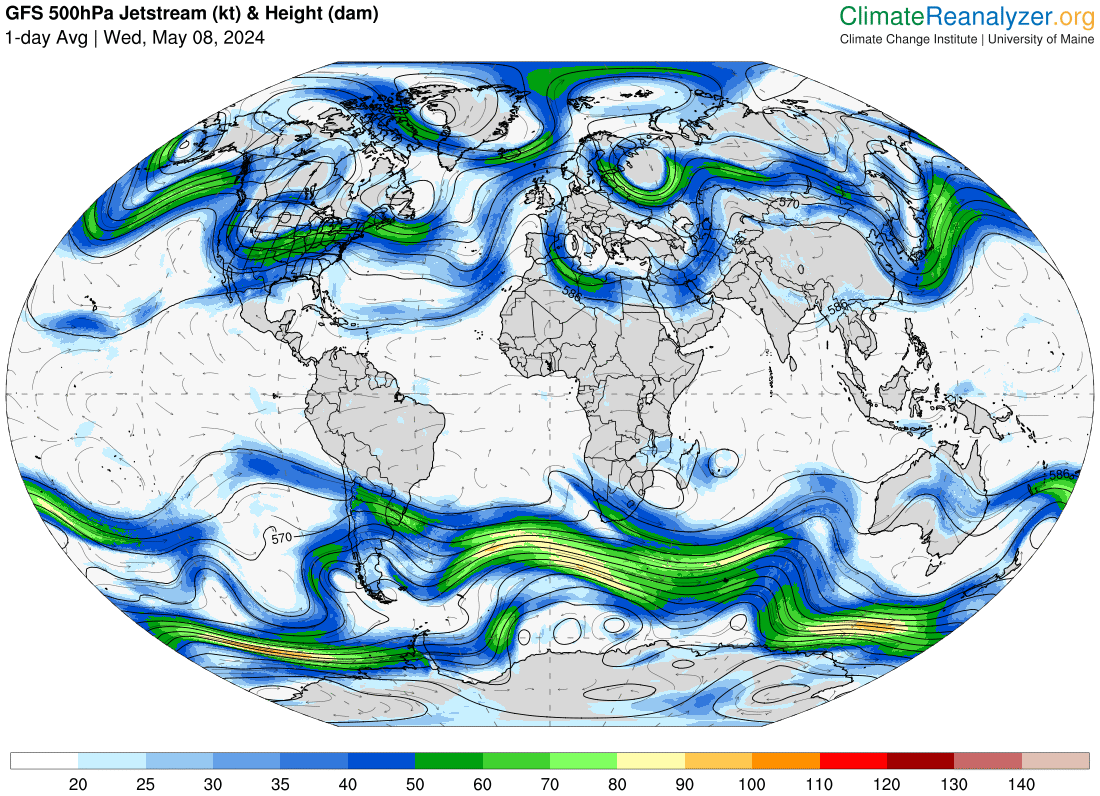
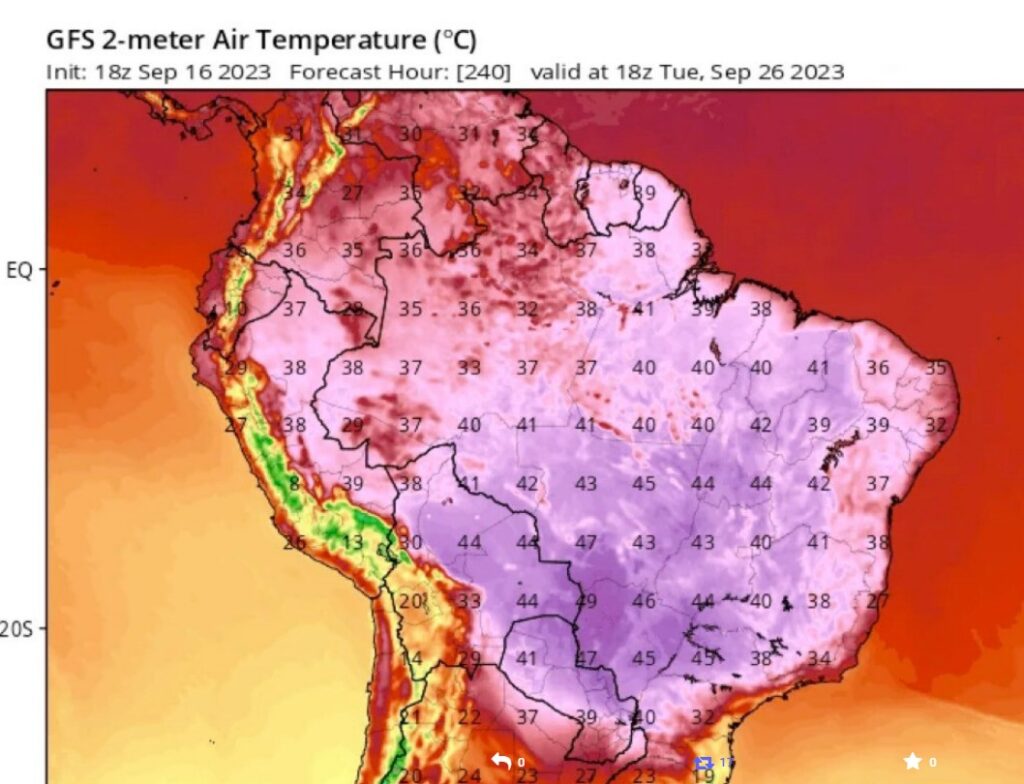
Where Derna was concerned, another consequence of having several unbroken months of high temperatures setting daily and occasionally all-time records, the jet stream system that normally keeps cold spots and warm spots moving around the world basically broke down — becoming very weak and chaotic. The combination of record high land and sea temperatures over summer with stalled heatwave conditions all around the Mediterranean provided optimum conditions to load the atmosphere with a truly prodigious amount of water. The availability of so much water and heat energy resulted in the formation of Storm Daniel. With little or no jet stream, Daniel was left to wander more or less randomly around the eastern Mediterranean. Daniel first dumped more than 700 mm of rain were dumped on areas of Greece to flood more than a third of that country’s prime agricultural lands, and then more than 400 mm on the Libyan city of Al Beyda a few km west of the upper end of Wadi Derna’s watershed. These numbers are already crazy & incomprehensible, but a fluke of bad luck associated with the particular landscape of Cyrenaica may have added even more kick to the already stupendous amount of peak water in the pipeline provided by the wadi. The catchment’s main reach on the plateau behind Derna runs from west to east, and it’s probable that Daniel’s rain cells were also moving from west to east at a comparable speed to the progress of the flood peak down the Wadi.

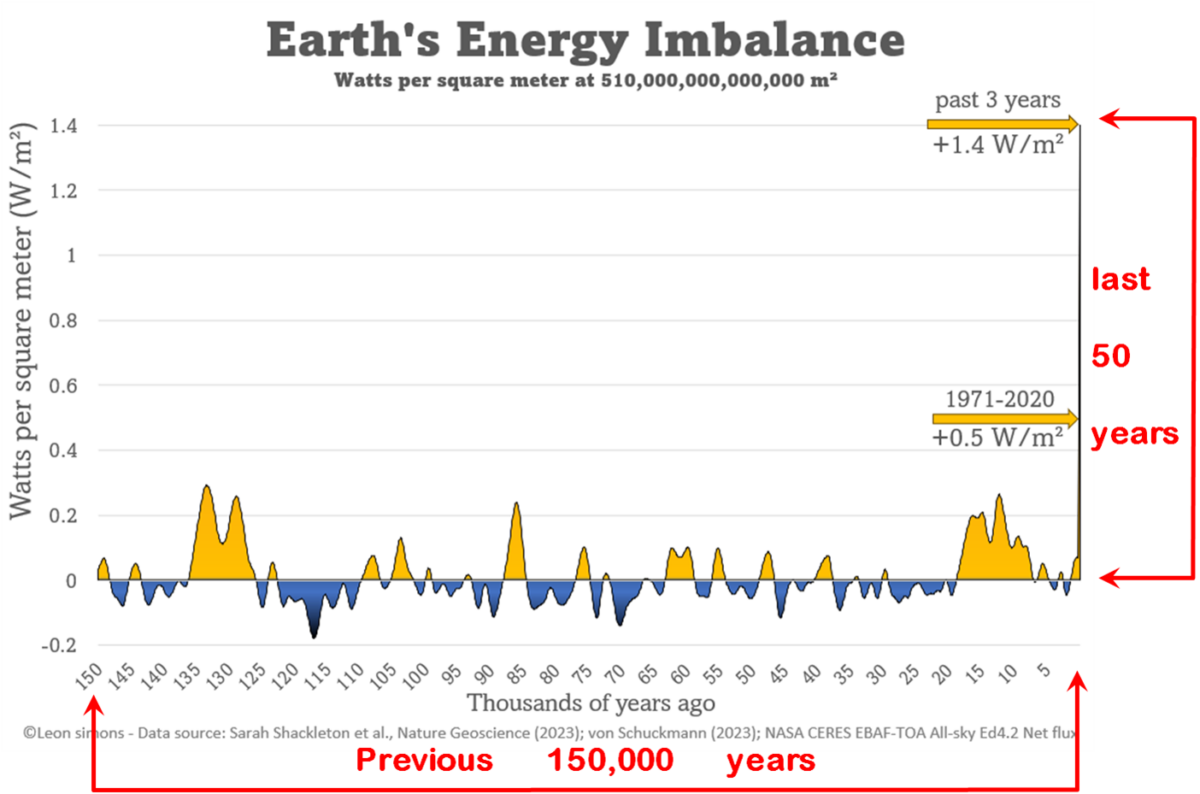
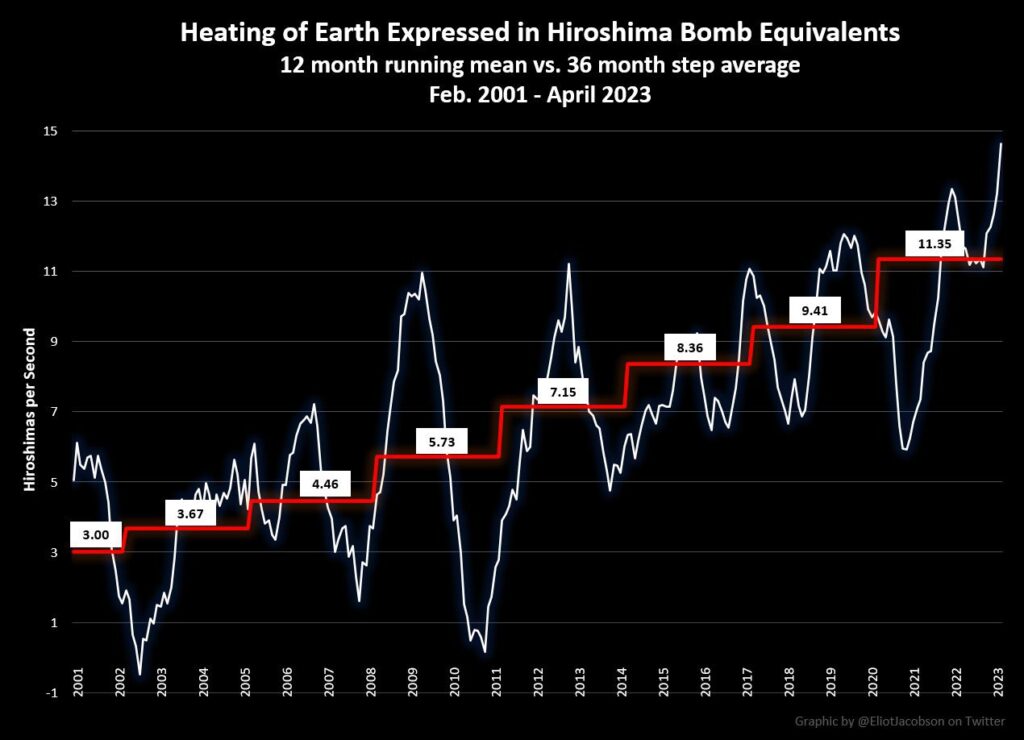
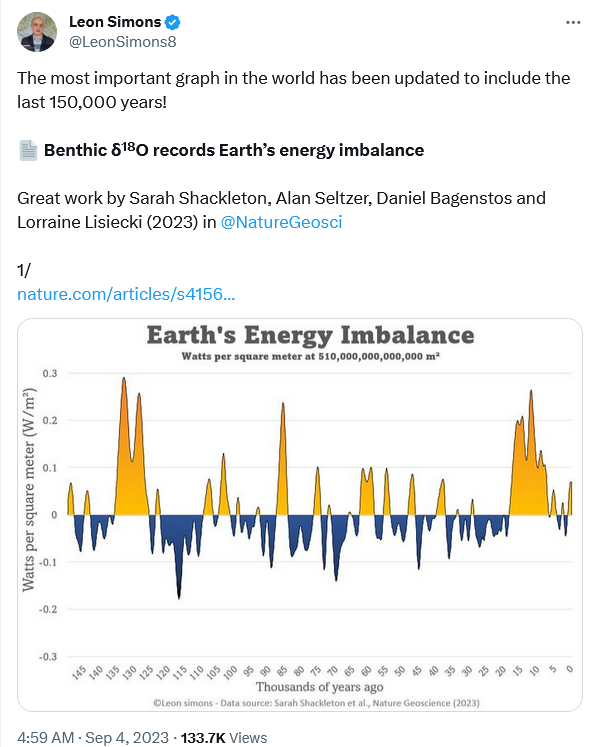
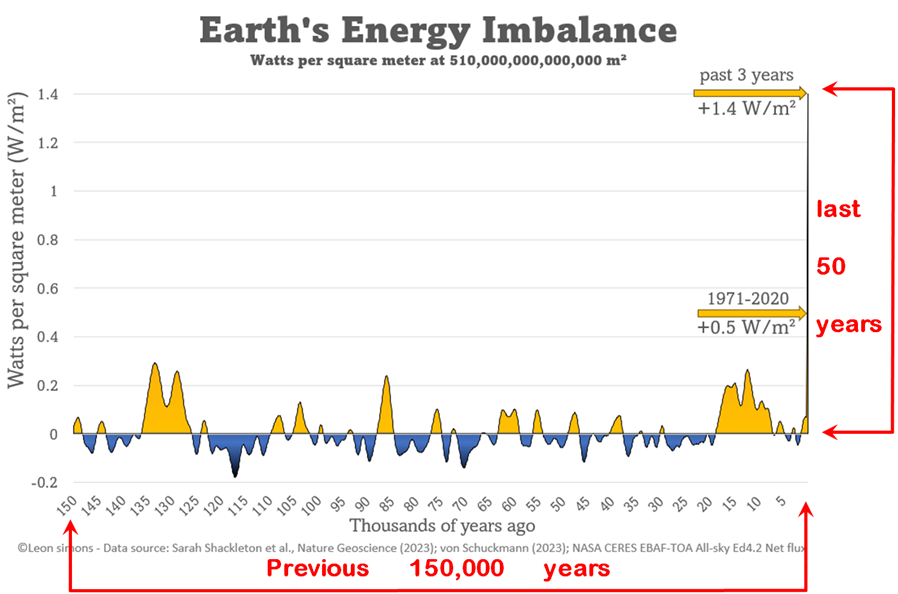
In any event, except for the last (possible) fluke, this kind of increasing storm intensity is a predictable product of global heating — which is what makes the Derna situation so alarming. If we allow the world to continue heating at an ever faster rate (as driven by Earth’s Energy Imbalance), lethal humidity will soon be be cooking so many people and trashing so much infrastructure needed to feed ourselves and condition the ever hotter air to a livable temperature we will face social and ecological collapse. If this happens humans will no longer have the capacity to do anything further to stop the runaway warming that will put all of the accessible soil and organic carbon back into the atmosphere. The worst global mass extinction event in Earth history so far will then run its course unhindered.

The presentation ends with a possible silver lining — humans working together can do very remarkable things if sufficiently motivated. I’ll write more on this later, below.

Download a PDF version by clicking HERE. Note: Throughout the presentation there are many links to the web to source materials or other relevant information. These should work if you click on them.

Some comparisons to think about

Japanese earthquake and tsunami of 2011

Several of the commentators on the Derna cataclysm said it was like a tsunami. I spent a couple of months trying to measure the impact of the Japanese Tohoku earthquake and tsunami of 2011 that led to the destruction of four of the Fukushima Dai Ichi nuclear power plants from the vast array of news, social media postings of videos, and the Google Earth record. Obviously, the tsunami affected thousands of kilometers of coastline, but nowhere did the 2-3 waves of the tsunami as comprehensively erase the evidence of human existence as happened in Derna.

[Google Translation of title] “Great East Japan Earthquake] People fleeing the tsunami in Minamisanriku Town, Miyagi Prefecture (different angle)”. This is a snapshot from https://www.youtube.com/watch?v=e_vIGlCk6ME There were countless videos like this (many now no longer accessible). Note that most of the structures being destroyed were wooden houses that were floated off their foundations before being crushed in the melee.
The comparison here is from the Japanese fishing port city of Minamisanriku of an area approximately 60% the size of the area depicted in the first graphic of this post from where one of its rivers meets the sea. Here, concrete buildings remain intact and except for the river mouth where significant soil has been removed, roads and the concrete slabs and foundations of buildings remain relatively intact. Boats in the upper picture were all destroyed, cast on the land or dragged out to sea on the return waves.
Devastation after tsunami in Rikuzentakata, Iwate, Japan. This image, which was originally posted to Flickr, was uploaded to Commons using Flickr upload bot on 7 April 2011, 15:40 by Akira Kouchiyama. Licensed under the Creative Commons Attribution 2.0 Generic license.

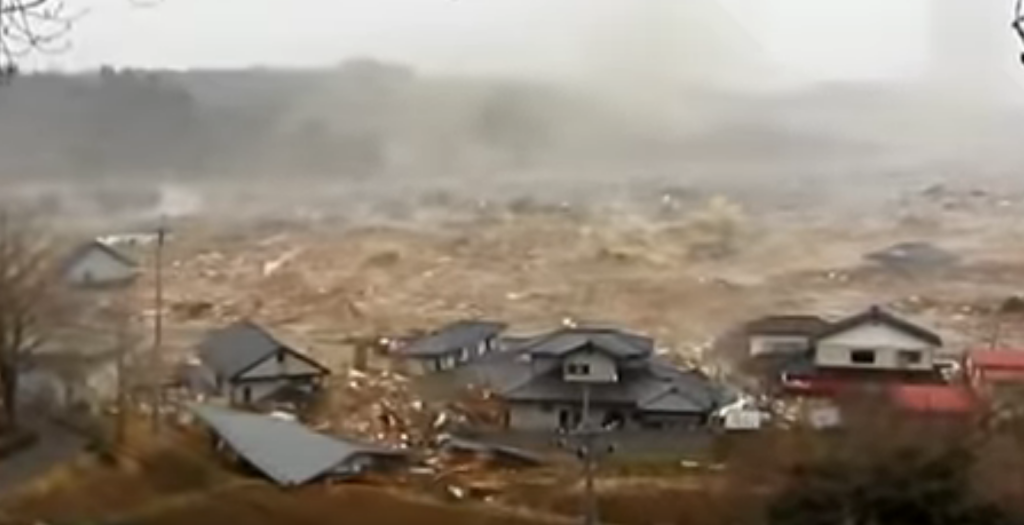
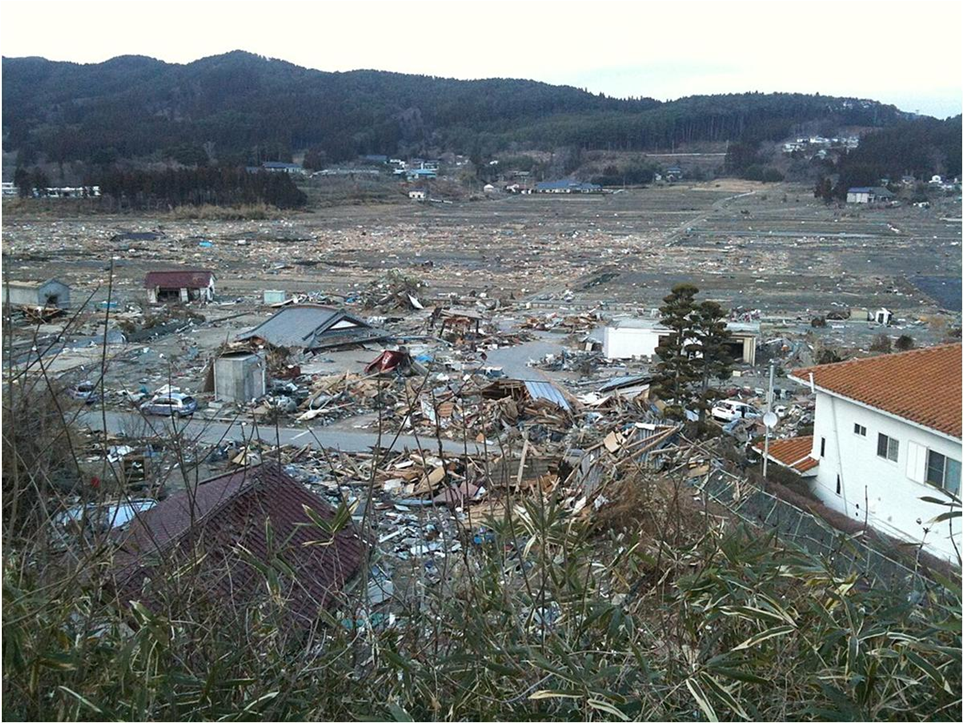
At Rikuzentakata, one of the worst hit cities, the tsunami wave reached heights of 13 meters (third floor of surviving buildings), and possibly killed 10,000 people. Wooden structures were completely demolished, but roads and concrete infrastructure remained largely intact as can be seen in the large trove of imagery accessible via Google.

Unlike a tsunami that normally involves only two or three killer waves at the most, Derna’s flood seems to have lasted several hours – long enough to strip everything away more-or-less down to bedrock!

Possibly cataclysmic valley floods in other parts of the world

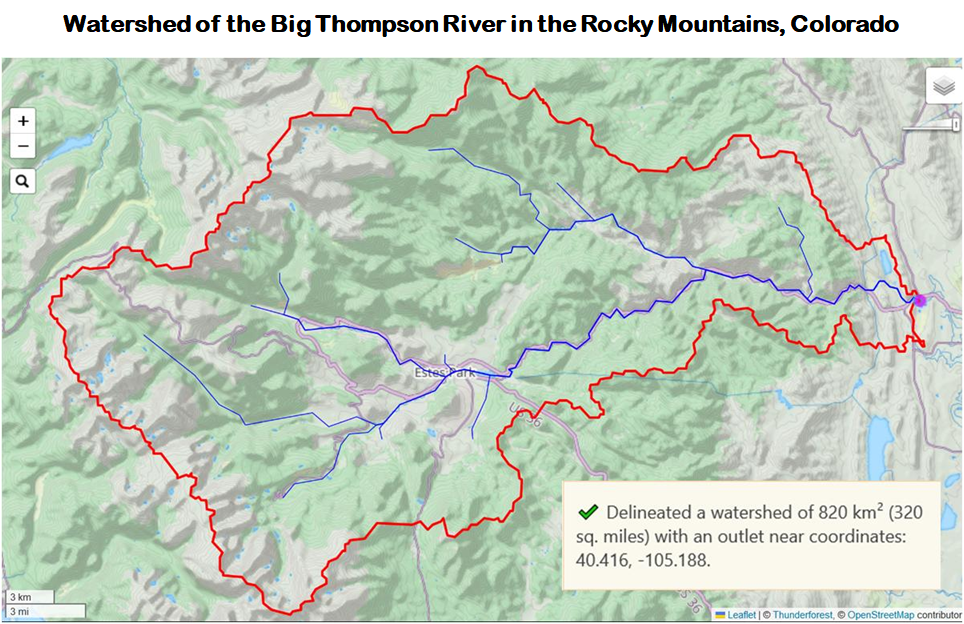
My first contact with cataclysmic flooding was in the summer of 1976, when I was teaching for a year on a temporary appointment at the University of Colordo in Boulder, where I was a near witness to the deadliest disaster of any kind in Colorado’s history. One very muggy (humid) afternoon a very ominous and noisy system of dark clouds and lightening passed over the university. I thought of possible tornadoes, but no rain was falling yet. Soon after this the storm cell got stuck in the valley of the Big Thompson River draining Glacier National Park ~ 45 km north of Boulder along Rocky Mountains forming the Continental Divide. The humid prevailing winds from from the prairie at around 1,600 m altitude were trying to push the storm over the Divide. The upper (western) third of the Big Thompson catchment is surrounded on three sides by ridges more than 3,500 m high (as can be followed on the clear contours of Global Watersheds‘ “Topographic” or “Thunder Forest” base maps). The storm cell dumped 300 mm in less than 4 hours. The resulting flood formed a “wall of water” more than 6 meters high that rushed down the steeply sloping canyon (2.4% gradient for the last 3 km — as measured to the accuracy allowed by Google Earth Pro) at a speed estimated to be 6 m/sec with a discharge rate of with a discharge of 1,000 cubic meters per second, killing 143 people (mostly campers).

As measured in the “slow lane” on the flat land in front of Al Sahaba Mosque well before the flooding reached its maximum height (upper floor of the main mosque) and erased the shrines and the 1,400 year old graves of the Companions of the Messenger of God, the water there was already moving at around 4 m/sec well before the flow reached its peak height. The peak speed over the wadi itself was probably two or three times what was measured in the Big Thompson flood!

When the flood happened, I was living in one of the University’s faculty flats situated alongside Boulder Creek. This has a drainage of 340 km² and cuts Boulder in half (a city that was then comparable in size and relative affluence to Derna with its Al Sahaba Mosque). I immediately considered what happened at Big Thompson and soon found other lodgings. Big Thompson had less sever another flood in 2016 that also caused substantial damage. So far, Boulder has been lucky.

Other potentially dangerous river systems

Other river systems with deeply incised valleys capable of producing cataclysmic floods under appropriate conditions that I know personally because I have lived in their neighborhoods are Melbourne’s Deep Creek-Maribyrnong system above Footscray and the Yarra River above central Melbourne. The Maribyrnong catchment above Footscray measures 1,300 km², and the Yarra river catchment at Kew (deeply incised from Warrandyte through Kew) measures 3,900 km² (or 5,500 km² measured at its mouth Port Philip Bay that includes the Deep Creek-Maribyrnong as a tributary). Both the Yarra and the Maribyrnong have flooded, with the Maribyrnong having its worst flood in several decades this time last year. Derna style floods fueled by high temperatures and lethal humidity would have unimaginably worse consequences for the cities these rivers flow through. (Note: the free Web ap, Global Watersheds, will plot the watershed extent and area for any point on the land in the world on a range of base maps. For understanding the landscape, I recommend “Satellite” – good but several years out of date, and “Topographic” or “Thundercloud” for clearly labeled elevation contours).

Catchment map from Global Watersheds, Google Earth Pro image from 22/04/2023. The controlled concrete spillway is located at the upper left edge of the dam, with the engineered topographic “natural” spillway near the lower right. This can be examined in more detail in Google Maps’ satellite view.

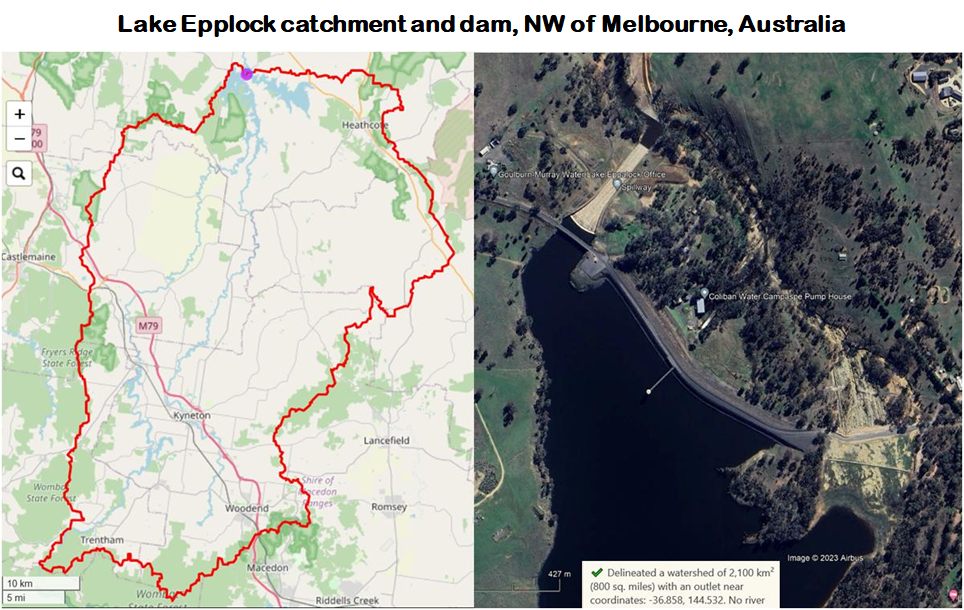
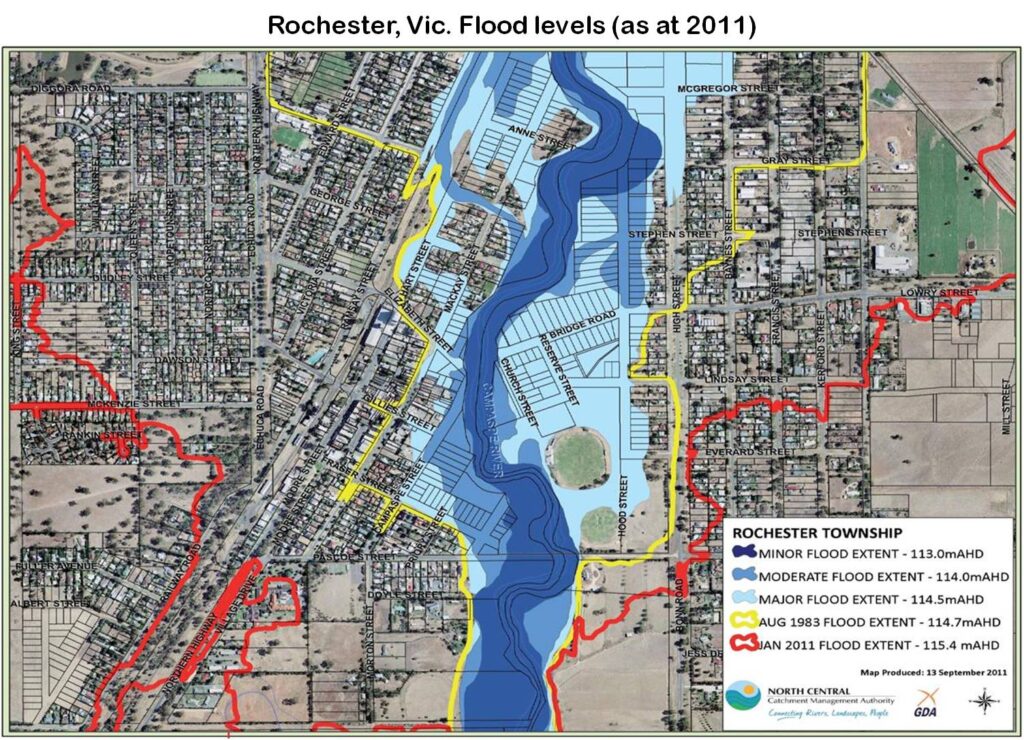
Possibly Victoria’s most dangerous drainage is the Campaspe River draining into the Murray Valley Vote Climate One’s home base in Kyneton is located in the middle of this catchment that begins just over the hill from where I live. The river is held back by Lake Eppalock, formed by a 650 m long embankment dam (i.e., similar to Derna’s mud-pie dams) that at full supply holds back 300,000 megaliters of water (possabably 1000 x as much as the Derna dams) from a catchment above the dam of 2,100 km². Unlike Derna’s dams that had no provision to manage spillage over the top of the dam. Eppalock has a well designed “controlled” concrete spillway with a maximum capacity of 8,000 m³/sec, as well as two “emergency” spillways enabled by the existing topography. [Based on Global Watersheds topography and Google Earth, the second emergency spillway is no more than a narrow topographic low that could pass only a small fraction of the volume passing over the engineered spillways.] In October last year, (and once in 2011), with the dam at 130% of full capacity, flooding exceeded the capacity of the controlled spillway with an outflow of 103,000 megaliters a day! (more than a third of the lake’s entire capacity at full supply in one day!).

Excellent drone vision is available for the effect of this outflow on the spillways, i.e., erasing the road along the top of the emergency spillway and scouring away the earth down to the bedrock forcefully enough to eat into the rock itself. Fortunately the scouring did not reach the concrete leveling wall designed to ensure that the overflow was spread uniformly across the very wide spill area to minimize concentration of the erosive flow of the water on small areas.

Google Earth imagery of flood scouring of the emergency spillway. Red lines show the location of the original road (erased) and the temporary replacement road below it. Arrows point to the deepest gouges eroded into the basement rock. Some of the erosion is a result of the prior spillage of the reservoir in 2011, but it is clearly deeper here. The leveling wall is clearly visible along the bottom of the graphic

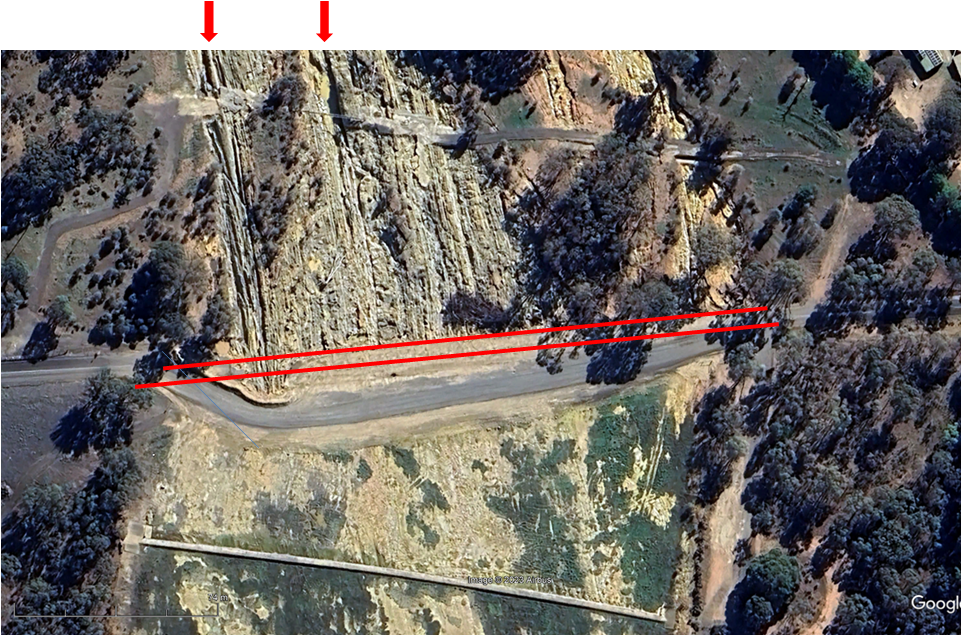
Even more detailed imagery of the functioning of both spillways and very real damage sustained by the emergency spillway during and after the 2022 flooding is provided by Joel Bramley Photography.

Noting that the 2011 and 2022 floods were caused by ‘ordinary’ decadal scale extreme weather events, one wonders whether the dam would survive a Derna scale cataclysm.

The Wadi Derna dams across a topographically sloping drain could only hold small volumes of water limited by the dimensions of the sloping drain and height of the dams and were completely empty until Daniel arrived. By contrast Lake Eppalock is on the edge of a plateau where the topography allow the storage of many times the volume of water of the gorge immediately behind the dam. At full supply, Lake Eppalock has three main reaches. Two are approximately 10 km long, and the third is 5 km long. In places each of these is more than a km wide. Unlike the Derna dams, Epalock has well engineered spillways to minimize the likelihood of overtopping and it’s maintained. But, very much like the Derna dams, it is a ‘mud pie’ construction susceptible to cracking and slumping (especially if overtopped):

  • Significant cracking was observed on the crest of the main embankment at Lake Eppalock for many years, but in recent years increasing movement upstream [slumping?] during low reservoir levels indicated a progressively deteriorating stability situation. Investigations also revealed cohesive filter material [clay?] that would allow a crack to propagate. A fast-tracked [emergency?] remedial works program was completed in 1999 to rebuild the highly vulnerable upper rockfill shells and filters, both upstream and downstream. [Davidson et al., 2000. The Dam Safety Upgrade at Lake Eppalock]

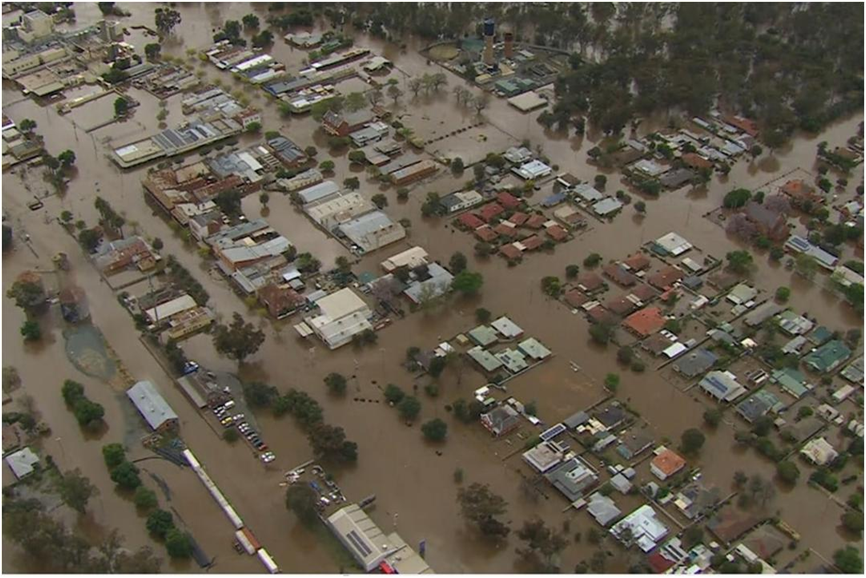
Downstream, the Campaspe cuts through the center of the small farming town of Rochester, 56 km N of the Eppalock Dam. The 103,000 megaliter/day flooding over Eppalocks’ spillways soon flooded around 1000 of Rochester’s 1500 homes on its way to meet the also flooding Murray River in Echuca rising higher and causing a lot more damage than the 2011 flood, which was the first time Lake Eppalock spilled over the emergency spillway. Today, half of the flooded homes are still uninhabited, with some of the repairs expected to take another year for all of them to be completed because it seems there is no capacity left in the system to finish the work any sooner.

Rochester in the 2022 flood
Rochester, Vic., flood levels at 2011 Campaspe River flood
The extent of the 2022 flood was substantially worse than the 2011 flood indicated by the red line.

The end game

The stark reality is that climate change, currently driven by Earth’s exponentially growing energy imbalance, is already stressing human society to the point that we cannot even maintain a status quo where we are able to repair extreme weather damage as fast as it occurs. As cataclysm and catastrophes increasingly concatenate and overlap due to continuing global warming, resources and capacities will decline at an ever faster rate, until society can no longer avoid collapse into chaos and barbarism, and then near term extinction.

We are truly facing an existential emergency. If we cannot mobilize the the scientific, technological, and human resources reverse the imbalance to slow, stop, and reverse global warming in the very near term, the exponential growing feedbacks (primarily carbon emission from soils, permafrost, oceans and accessible fossil sources) that are driving the energy imbalance will be unstoppable until all the accessible carbon has been transferred to the atmosphere as greenhouse gases. By then humans and most other complex organisms on Earth will be extinct.

Personally, I think humans, if they can work in a focused way and cooperatively together to fight the common enemy, actually have the capacity to stop the lethal feedbacks while they are still in their early stages of ramping up. This thought is based on 14 years focused and in-depth research and writing on the co-evolution of humans and our technologies, 17 years working as an engineering knowledge management systems analyst and designer for what was then Australia’s largest defence project engineering and construction organization, and a lifetime student of evolution grounded in physics and Earth and marine sciences.

I am also old enough to remember the end of WWII and am fully aware of how America entered the war as a disunited mob of apathetic to passionate pro fascist isolationists to pro communist utopians. Yet, within weeks of being dosed with the reality of the Japanese bombing of Pearl Harbor, the mob united, turned scientific glimmers into totally new sciences, technologies and logistcs, crafts into massive assembly lines, and anarchic mobs into war machines. The global war was won in Europe with America’s help with the German surrender on 8 May 1945; and by America in the Pacific with Allied help with the Japanese surrender on 2 September 1945 after the atom bombing of Hiroshima and Nagasaki on 6 and 9 August (well under 4 years). This was followed up by the formation of the United Nations (a good start towards global government), and the restoration of many nations to a road to prosperity under the Marshall Plan.

The realities reviewed above show that humanity is currently facing the most lethally dangerous crisis in our evolutionary history, probably even more extreme than the End Permian mass extinction event that our ancestors survived 250 million years ago. If we accept this reality it should motivate us to work together collectively with the necessary focus and discipline to put the Apocalyptic Horsemen back into their mythic stable in God’s Scroll so we can escape from the down-hill highway to Earth’s Hothouse Hell (see also David Spratt’s series on Climate Code Red).

Views expressed in this post are those of its author(s), not necessarily all Vote Climate One members.

Sept. 2023 climate extremes

Notable observations and news items from the Web, with no processing and little in the way of comment. Make of them what you will.

Leading up to this September’s extremes

Firefighters flying over a controlled burn to fight wildfires in Canada’s Quebec Province. Photograph: Genevieve Poirier/Societe De Protection Des Forets/AFP/Getty Images (from the article)

The hottest summer in human history – a visual timeline

Jonathan Watts, Lucy Swan, Rich Cousins, Garry Blight, Harvey Symons and Paul Scruton
29/09/2023 in The Guardian

From June to August 2023, a series of extreme weather events exacerbated by climate breakdown caused death and destruction across the globe.

As the world sweltered through the hottest three month spell in human history this summer, extreme weather disasters took more than 18,000 lives, drove at least 150,000 people from their homes, affected hundreds of millions of others and caused billions of dollars of damage.

That is a conservative tally from the most widely covered disasters between early June and early September, which have been compiled in the timeline below as a reminder of how tough this period has been and what might lie ahead.

For details and the complete timeline, read the complete article….
July 2023 @ 16.95 °C – hottest ever, by far; August 2023 @ 16.82 °C – second hottest ever! New regime stuff!
https://www.theguardian.com/australia-news/datablog/2023/sep/22/eastern-australia-sweltered-under-heatwaves-this-week-how-unusual-were-they
https://twitter.com/EliotJacobson/status/1710675755452203079/photo/1

https://grist.org/extreme-heat/parts-of-the-world-have-already-grown-too-hot-for-human-survival/

How much are these extremes costing society. For an idea see the following graphic from Scientific American’s blog. Note: this graphic applies only to the US,

Click the thumbnail immediately below for a parsed transcript of this critically important speech.

https://www.theage.com.au/environment/climate-change/plibersek-accused-of-failing-to-protect-environment-as-case-against-her-coal-decisions-begins-20230918-p5e5g0.html

https://www.theguardian.com/environment/2023/aug/28/crazy-off-the-charts-records-has-humanity-finally-broken-the-climate Warning: Data is provided for this article by climate scientists who suffer from the reticence causing academic and institutional scientists to downplay any overly ‘dramatic’ warnings in order to avoid alarming departmental colleagues, administrators, or governments influencing hiring, promotion, financial support for research, etc. Google “scientific reticence” and you will find lots of evidence on how it works.

https://www.theguardian.com/world/2023/sep/13/antartica-global-warming-sea-ice-caps-regime-shift

Pine Island Glacier

There is far worse to come as warming continues to increase https://www.theguardian.com/environment/2023/sep/19/global-heating-made-mediterranean-floods-more-likely-study-says

Implications

The current extremely low sea ice will have a range of impacts. Changed ocean stratification and circulation will alter basal melting beneath ice shelves48. Greater coastal exposure will increase coastal erosion and reduce ice-shelf stability49. Changes in dense shelf water production will alter bottom water formation and deep ocean ventilation50. Sea ice changes will also have contrasting influences on Adélie and emperor penguin colonies51,52, and substantially alter human activities along the Antarctic coastline.

Anthropogenic greenhouse gas emissions have been attributed as the primary cause of Southern Ocean warming, and here we suggest a potential link to a regime shift in Antarctic sea ice. While for many years, Antarctic sea ice increased despite increasing global temperatures6, it appears that we may now be seeing the inevitable decline, long projected by climate models53. The far-reaching implications of Antarctic sea ice loss highlight the urgent need to reduce greenhouse gas emissions.

https://apnews.com/article/climate-change-poll-opinions-attitudes-extreme-weather-993c392ee57d023ca55600431a39a4be?fbclid=IwAR0u3oxtLL1R5hY0h_64cZA6MZDvGeEZNHUW66oghhmJgUPjo0je3_NyoWY

https://bc.ctvnews.ca/b-c-s-wildfire-crisis-was-forecast-but-it-arrived-decades-sooner-than-expected-1.6555309

https://www.livenowfox.com/news/canadas-supercharged-wildfire-forecast-could-mean-bad-air-quality-in-us-through-fall

Off the previous chart, again…. In 12 days another ~500,000 hectares have burned! Will the burning stop for winter? What does this portend for Australia’s upcoming El Nino summer?

Cumulative total land area burned to date

2023-09-25 17,850,290
2023-09-24 n.a.
2023-09-23 17,812,661
2023-09-22 17,100,899
2023-09-21 17,012,456

The record for the 23rd blew the Canadian system’s off the chart! The following chart from Copernicus, the EU’s equivalent of NASA, that operates the satellites, suggests the data from the 23d is probably a real record of what the satellites actually recorded. In most years the wildfires would have been more-or-less through for the year. Yet 23 Sept shows BY FAR the largest number of hotspots recorded for the year so far, previous highs being 9269 for June 22 and 9692 for July 13.

For the latest Natural Resources Canada tabulation, see https://cwfis.cfs.nrcan.gc.ca/maps/fm3?type=arpt. Note 1: the current version of the total burned area chart can be seen by scrolling down to the bottom of the table accessed by this link.

Note 2: the following Guardian chart was PUBLISHED on 22 Sept.


Yan Boulanger, @yboulanger2 Research scientist @NRCan CFS,
climate change impacts on forest landscapes, natural disturbances, wildlife habitat.

https://www.theguardian.com/world/2023/sep/22/canada-wildfires-forests-carbon-emissions – “This year’s out-of-control blazes released 2bn tonnes of CO2 – probably triple the country’s annual carbon footprint”.

Note: warmer winter temperatures allowed mountain pine beetle populations to grow explosively through this region due to additional reproduction of adult beetles that were normally killed off by hard freezing winters. I did several Facebook posts in 2016 and 2018 on the increasing fire hazard this would create until the dead biomass was removed. This year’s extreme temperatures facilitated this!

See Hall (2020) Portents for the Future – 2020 Wildfires on the Siberian Permafrost.

Permafrost zones on brink of runaway GHG emissions(?)

Global permafrost now (2000-2020) likely to be a net emitter of greenhouse gases methane and N₂O – Ramage, et al. (September 11, 2023 unreviewed preprint) The net GHG balance and budget of the permafrost region (2000-2020) from ecosystem flux upscaling.

[Note that 2020- Siberian wildfires plus this years’ wildfires in the Canadian Arctic Zone probably produced massive increases in permafrost GHG emissions beyond what was happening during the years included in this survey.]

Map of northern permafrost extent (data from Obu et al. 2021) overlain with the spatial extent of the permafrost domain included (BAWLD-RECCAP2 regions). The spatial extent of the permafrost region de ned in this study as an overlap of permafrost extent and the Boreal Arctic Wetlands and Lakes Dataset (BAWLD, Olefeldt et al. 2021a,b
Scheme of annual atmospheric GHGs exchange (CO2, CH4, and N2O) for the ve terrestrial land cover classes (Boreal Forests, Non-permafrost Wetlands, Dry Tundra, Tundra Wetlands and Permafrost Bogs); inland water classes (Rivers and Lakes). Annual lateral
fluxes from coastal erosion and riverine fluxes are also reported in Tg C yr-1 and Tg N yr-1. Symbols for fluxes indicate high (x>Q3), medium (Q1<x<Q3), and low (<Q1) fluxes, in comparison the quartile (Q). Note that the magnitudes across three di erent GHG fluxes within each land cover class cannot be compared with each other.
ClimateReanalyzer
Stationary anomaly, somewhat hotter on 23rd than 22nd


https://www.theguardian.com/environment/2023/sep/11/us-record-billion-dollar-climate-disasters Note, as the frequency, extent, and ferocity of climate disasters continue to increase with accelerating global warming, newer disasters will overlap and add to destruction from previous disasters where there has not been enough time to complete repair and remediation leading to the accelerating accumulated climate damage — until society no longer has the resources to continue repairing and replacing what has already been repaired and replaced. At this point social collapse is inevitable…… We must stop and reverse the process of global warming that is causing this or face near-term extinction.

11 September 2023 – Coming out of winter — not a good look for the rest of the year in Australia!

Dwindling sea-ice reflects less solar energy away

Arctic sea ice 4th lowest on record 19 Sept 4.230 million km², with a lot of the remaining ice thin and broken. Animation 09/07-09/28 – https://www7320.nrlssc.navy.mil/GLBhycomcice1-12/navo/arcticictn_nowcast_anim30d.gif

https://www.theguardian.com/world/2023/sep/13/antartica-global-warming-sea-ice-caps-regime-shift

Shocking record low maximum sea-ice extent for Antarctica to 28/09/2023; also began net melting on 8 Sept. (https://seaice.visuals.earth/)

Antarctic sea-ice at ‘mind-blowing’ low alarms experts Excellent BBC article with good links to further research and discussions.

(13.09/2023) Nature Communications Earth & Environment. Record low Antarctic sea ice coverage indicates a new sea ice state.

In February 2023, Antarctic sea ice set a record minimum; there have now been three record-breaking low sea ice summers in seven years. Following the summer minimum, circumpolar Antarctic sea ice coverage remained exceptionally low during the autumn and winter advance, leading to the largest negative areal extent anomalies observed over the satellite era. Here, we show the confluence of Southern Ocean subsurface warming and record minima and suggest that ocean warming has played a role in pushing Antarctic sea ice into a new low-extent state. In addition, this new state exhibits different seasonal persistence characteristics, suggesting that the underlying processes controlling Antarctic sea ice coverage may have altered. [my emphasis]

a Antarctic monthly sea ice extent (SIE) anomaly time series from the National Snow and Ice Data Center over the satellite period, November 1978 to June 2023, in millions of square kilometres. Sea ice extent anomalies are calculated relative to the 1979–2022 climatology. Two change points are detected, separating the time series into three periods: November 1978 to August 2007 (grey), September 2007 to August 2016 (blue), and September 2016 to June 2023 (orange). The means of each period are shown by the horizontal lines and are statistically distinguishable. b Antarctic monthly SIE anomaly time series expressed as a percentage of the monthly climatology over 1979–2022. Periods are coloured as in (a). Record minima months occurring since 2016 are noted in (a, b). c Southern Ocean 50–65°S temperature anomaly time series from Argo over January 2004 to May 2023, in degrees Celsius. Ocean temperature anomalies are calculated relative to the 2004-2022 climatology. Dashed vertical lines show the sea ice extent change points. Stippling indicates values outside ± 1 standard deviation, where the standard deviation is calculated independently at each depth level to account for the change in magnitude of the variability with depth. Warm anomalies shown in orange and red are evident below 100 m from 2015, and at the surface from late 2016.
Antarctic five-day sea ice extent anomalies in millions of square kilometres for each year from the National Snow and Ice Data Center. Sea ice extent anomalies are calculated relative to the 1979–2022 climatology. Anomalies are coloured by period as in Fig. 1: November 1978 to August 2007 (grey), September 2007 to August 2016 (blue), and September 2016 to June 2023 (orange). January to June 2023 is shown in bold orange, with the largest negative areal extent anomaly of the satellite era observed during June 2023.

Implications

The current extremely low [Antarctic] sea ice will have a range of impacts. Changed ocean stratification and circulation will alter basal melting beneath ice shelves48. Greater coastal exposure will increase coastal erosion and reduce ice-shelf stability49. Changes in dense shelf water production will alter bottom water formation and deep ocean ventilation50. Sea ice changes will also have contrasting influences on Adélie and emperor penguin colonies51,52, and substantially alter human activities along the Antarctic coastline.

Anthropogenic greenhouse gas emissions have been attributed as the primary cause of Southern Ocean warming, and here we suggest a potential link to a regime shift in Antarctic sea ice. While for many years, Antarctic sea ice increased despite increasing global temperatures, it appears that we may now be seeing the inevitable decline, long projected by climate models. The far-reaching implications of Antarctic sea ice loss highlight the urgent need to reduce greenhouse gas emissions. [my emphasis]

End. For the complete article see Record low Antarctic sea ice coverage indicates a new sea ice state.

A very good summary of the state of global sea-ice to the end of September: https://www.carbonbrief.org/exceptional-antarctic-melt-drives-months-of-record-low-global-sea-ice-cover/

Storm Daniel comprehensively trashed several countries around the Eastern Mediterranean between 4 and 13 Sept.

Wikipedia tells the story and links to many of the news items. It was the deadliest Mediterranean tropical-like cyclone in recorded history

Greece

https://www.theguardian.com/world/2023/sep/09/greek-rescuers-working-through-the-night-to-locate-villagers-trapped-by-flood: “The once fertile Thessaly plain, the nation’s breadbasket, now lies metres deep under mud and silt, with great swaths resembling a lake.” I read somewhere else that 1/3 of Greece’s TOTAL prime agricultural land was under water….

https://earthobservatory.nasa.gov/images/151807/a-deluge-in-greece

https://www.aljazeera.com/news/2023/9/12/death-toll-in-libya-floods-reaches-3000-benghazi-administration

Key facts from CDR (Center for Disaster Recovery):

  • As of Sept. 15, the Libyan Red Crescent said the death toll had reached 11,300 people in Derna alone. Officials expect this figure to continue to rise, possibly as high as 20,000. About 170 people were also killed in other parts of eastern Libya, including in Susa, Marj, Bayda and Um Razaz. More than 7,000 people were injured and at least 10,100 people are still reported to be missing. Because of the lack of telecommunications, some may be displaced and unable to reach family, but due to the large-scale destruction, it is hard to confirm these figures.
  • According to Floodlist, Libya’s National Center of Meteorology reported, “in a 24 hour period to Sept. 10, a staggering 414.1 mm [16.2 inches] of rain was recorded in Bayda, while 240 mm [9.5 inches] of rain fell in Marawah in the District of Jabal al Akhdar, and 170 mm [6.7] fell in Al Abraq in the Derna District.”
https://disasterphilanthropy.org/disasters/2023-libya-floods/

I used publicly available satellite imagery to try assess the damage attributed largely due to the failure of two dams. My conclusion is that the dams were no more than momentary and relatively insignificant barriers to to the flow of an inconceivably large volume of water. The following satellite images from Google Earth, and Sentinel Hub’s EO Browser clearly demonstrate the power of our planet’s increasingly extreme weather events driven by global warming. As the oceans and atmosphere warm, the atmosphere is able to transport increasingly stupendous volumes of water (in the form of water vapor) over the land to be dropped when the air cools for any reason.

The following image is what appears to be the center of the city of Derna (pop ~100,000) immediately before Storm Daniel dropped part of its load of water in the watershed of Wadi Derna. The very dry stream bed of Wadi Derna crosses the center of the image. If you have access to Google Earth, you can zoom in to see shadows of the few individual people out in the mid-day sun.

Zooming in, note the large building on the NE side of the Wadi 3 blocks downstream from the bridge on the lower left corner of the picture. It is a high-rise, where the tallest part is 9 stories above the ground floor, and the rest five. I determined the number of floor by counting the sun shades visible on the downstream side of the building. This is one of the few structures left in this part of town that can be identified in the next image.

Immediately after it looked like this:

Note the conspicuous high-rise (10 stories) easily marked by its long shadow in this image. The image below images this building from the down-stream side. The image here is relatively low resolution, but the three lowest floors (facing AWAY from the flood) have clearly been gutted by the flood. The bridge referred to in the previous picture has vanished leaving only two supports (aligned with the stream flow) to show where it was. Rows of 4-6 story buildings (and even some 8 story buildings just off the left edge of this image) extending 3-4 and even more rows back from the Wadi have totally vanished or are only memorialized by a bit of concrete slab or trace of a foundation wall.

The next two pictures zoom in on the area between the vanished bridge in the above images and the next bridge upstream (just off the edge of the above).

The three buildings to the left of the Wadi at the bottom of the image were respectively 7, 4, and 7 stories high

The next two pictures show the site of the lower dam – 250 meters upstream from the inland edge of the city.

Note: the dam has no spillway. Overflow protection is provided by the flared drain pipe (circular structure) in the lower left of the picture. Using Google Earth’s measuring tool, the diameter of the drain as approximately 6m. On the upstream side the surface of the reed bed is ~24 m above sea level, and the level of the road over the top is 45 m, giving the dam height of 21 m. On the downstream side the base of the dam is at 26 m, with the outlet for the overflow drain at approx 22 m. The length of the dam across the top is ~115 m, across the bottom (at reed level) is 50 m; thickness at the bottom is ~74 m, 8.5 m at the roadway.

The next Google Earth image is of the upper dam (12.5 km upstream from the lower dam) from immediately before Storm David’s rain. There is no high resolution image available from after the flood.

The drain tube (right side upstream) seems to be 7m in diameter. The dam is ~10 m high and 270 m long. 143 m thick at the base and 6.5 m thick at the top.

The last composite graphic gives an impression of the amount of water held behind both dams in the days immediately prior to Storm David. All are sourced via Sentinel Hub’s EO Browser and all are at the same scale – close to the maximum resolution available. The left four images are of the upper dam and its lake, while those on the right are of the lower dam and its lake. The upper three images of each dam use the Normalized Difference Moisture Index NDMI – that basically highlights any moisture in the otherwise barren landscape. The bottom picture is the same view as the one immediately above, except that it displays “true colors”. On the left in the top picture, on 10/01/2023 there was some water backed up behind the dam, perhaps 2 m deep at the dam wall given that most of the upstream face is still dry. The second picture, on 02/09/2023 shortly before Storm Daniel shows essentially zero moisture behind the dam, except there is a tiny blue streak in the bottom of the bright yellow area that is too small to be resolved at the magnification shown here. The blue areas below the dam are well watered orchards and fields – not standing water. The dam is visible in both of the above pictures. The third picture, from 12/09/2023 immediately after Storm Daniel shows the Wadi Derna has been scraped clean of any sign of a dam or the well watered agricultural area below the dam save the blue area off to the side. Inspection of the area just downstream from the pictures here in the before and after show the complete obliteration of farms and vegetation together with the road to a height of 20+ meters above the bottom of the wadi. A little further upstream – a bit closer to the dam, the landscape has been scraped up to a height of 38 m! above the wadi bottom, where the width of the wadi is approximately 200 m across. The height of this point is ~215 m above sea level (at least 10 m higher than the top of the dam!).

A similar story can be constructed for the pictures of the lower dam in the right column. The dams were minor inconveniences to the flow of the total volume of the storm water.

The Wadi Derna drains a large and relatively barren plateau with some of the weirdest landforms I have seen, and could possibly be organized so it receives large volumes of water from a number of subsidiary drainages at the same time. Or, more likely, the insanely hot Mediterranean air was supersaturated with water, and the storm dynamics led to rapid cooling that squeezed all of the water out over a very short period of time….. And the barren plateau lacked soil and vegetation to slow the flow of the water once it hit the ground, and simply demonstrated what can happen when the Earth System has too much energy to dissipate all at once in the form of climate catastrophes.

Consequently….

Our planet is progressively becoming uninhabitable!

https://www.salon.com/2023/09/13/humans-are-dangerously-pushing-the-limits-of-our-planet-in-ways-other-than-climate-change/

Earth beyond six of nine planetary boundaries

We’ve already breached 1.5 °C above preindustrial global temperatures and worse to come is already in the pipeline

https://www.abc.net.au/news/2023-09-11/global-temperatures-pass-1-5c-above-pre-industrial-levels/102836304

Not yet getting back to anything as cool as last year’s near record highs after more than 3 months! – https://climatereanalyzer.org/clim/t2_daily/?dm_id=world
3+ months and the anomaly is still trending ever more extreme as the sub-solar point moves towards the Southern Hemisphere!
Global Average Sea Surface Temperature still above previous years ALL TIME RECORD HIGH TEMPERATURE with trend line still widening the gap. 90% of excess solar heat is first absorbed into the oceans to heat the globe as a whole. – https://climatereanalyzer.org/clim/sst_daily/
Southern Hemisphere anomaly also in record extreme territory and rising rapidly. Antarctic rising and ~1 day from record daily high.
Sept. 13 and Antarctic sea ice already beginning to melt after 4+ months of record low freezing rate, to create a global average record low amounts of sea ice. At the southern summer low to come will there be ANY sea ice left around Antarctica? What does this mean for ice shelves and glacier fronts exposed to warm pounding waves and tides? – https://nsidc.org/arcticseaicenews/charctic-interactive-sea-ice-graph/
Sept. 19 and the ice is rapidly melting into ever more extreme low sea ice for the date.
Sept 19 and rapid Antarctic melting keeps global coverage more than 4 σ below any previous low for the date. Not good news for southern summer! https://seaice.visuals.earth/
Record high temperatures & reduced temperatures between polar and ‘temperate’ zones lead to crazy, weak and chaotic jet streams; in turn allowing stalled extreme heat domes, droughts and wildfires; lethally moist air masses, biblical flooding, and catastrophic storms.
OUR GOVERNMENTS ARE STILL PROMOTING AND SUBSIDIZING FOSSIL FUEL BURNING!

Forecast Image

https://climatereanalyzer.org/wx/todays-weather/?var_id=ws500-gph&ortho=5&wt=1

https://www.abc.net.au/news/2023-09-17/unusual-el-nino-development-bureau-of-meteorology-iod/102861886

South America mid Sept. — What about Australia this summer?

Biff Vernon – Facebook: Dangerous temperatures forecast for next week over a large part of South America.
Southern Hemisphere temperatures now: Brazil Max on Thursday 41 °C; 42 on Friday; Uruguay 43 on Saturday; 44 on Sunday.

Earth’s energy imbalance (solar radiant energy in – earth radiant energy out) = energy heating planet Earth.

Simons puts the previous graphs in a geological context based on Shackleton et al’s reconstruction of variations of Earth’s energy balance determined from measurements of Oxygen isotope ratios in sediment cores from the seabeds.

The thread from https://twitter.com/LeonSimons8/status/1698413266421096893 explains in some detail how the following graph was inferred and extrapolated from the above. At first I found it difficult to make sense of this graph until I grasped that the vertical line defining the right-hand side of the graph was data, comparing the imbalance observed directly over the last 50 years, with the variation recorded over the last 150,000[!] years, not the border….

Simons was one of the coauthors of the above paper.

Australia hasn’t escaped

https://twitter.com/joellegergis/status/1709024553048191389

Costs & Consequences

Note that the following X-Tweet is limited to the United States – based on a Scientific American article. The rest of the world is suffering at least as much! Total costs are adjusted for inflation. It isn’t clear whether this also applies to the individual “billion dollar” events in the graph below.

Jonathan Overpeck @GreatLakesPeck Environmental/Climate scientist for 30+ years; Samuel A. Graham Dean, @UMSEAS @UMICH . Tweets my own. Thinking grad school? Join me at @UMSEAS: http://myumi.ch/n8mM2

Given the rapidly growing accumulation of excess heat in Earth’s oceans, if we cannot stop and reverse global warming within the next few years the inevitable result will be ecological and social collapses, within a few decades, and likely global extinction of most complex organisms — including humans within a century or so….

We must act before it is too late!

Featured Image

Based on an image by Leon Simons, https://twitter.com/LeonSimons8/status/1698410404693594417 depicting the urgent existential problem facing humanity today: If we cannot reverse the heating spike forming the right-hand border of the graph and force it below the neutral line forming the graph’s X axis within a few years, most complex life on Earth will be extinct in a century or so.

Views expressed in this post are those of its author(s), not necessarily all Vote Climate One members.

Climate Council warns of wet future for Oz

Climate change, driven by burning fossil fuels, contributing to the Great Deluge, is consigning Australia to escalating climate disasters

Most of Australia’s East Coast from Cape York south to the Victorian border has had over a meter of rain by the end of October — with the rains still continuing. Some of these areas have had more than 2 meters, and a few more than 3 meters! Many rainfall records have been smashed in all of the eastern states: Queensland, New South Wales, Victoria, Tasmania; leading to almost constant flooding through the whole area that is continuing today. The latest reports from the BOM tell us the rains will continue into summer.

This is clearly a function of global warming. Physical laws dictate that as air temperatures rise, the air can carry more water vapor before it begins to condense as rain. Higher temperatures increase the rate of evaporation of water from soils and standing water – encouraging drought. Seemingly contradictory warmer air can precipitate more water in areas where it is raining. As the water condenses out as rain it also releases its ‘heat of fusion’ — and more heat is available to drive more extreme winds able to carry rain to high elevations before the rain freezes to fall back to Earth in devastating hail storms. Over larger areas there is also more energy available to fuel increasingly powerful cyclones.

Increased water means increased plant growth, increased temperature increases the rate at which soils and vegetation dry out — ensuring ever more catastrophic wildfires.

Ever more floods, fires and tempests cause increasing damage to infrastructure and people’s livelihoods and property until the catastrophes follow one another so closely that there are simply not physical or human resources left to repair the damage from one catastrophe before the next catastrophe causes even more damage. If the warming is not stopped this progression leads inevitably leads to social collapse (as we are already seeing in parts of the world), agricultural collapse (and famines as we are already beginning to see in Africa and the Middle East), ecological collapse (as we are already seeing in marine habitats with coral reef communities, kelp beds, sea grass meadows), and finally, population collapses when the land has literally been swept bare (areas in Africa are already on the edge of the cliff).

With the collapse of society, humans will quickly lose the scientific and engineering capabilities to fight further climate change already dialed into the system, such that there will be little hope of avoiding near-term global mass extinction. Continuing ‘business as usual’ support of the fossil fuel industry more-or-less ensures this grim outcome.

The Climate Council’s report, presented below, presents the facts and explains what they mean here in Australia, and some of the things we can to moderate and mitigate the expected damages. This is a good start, but I would be a silly liar if I said this was all we need to do in order to keep from utterly destroying our future.

Vote Climate One will continue to do whatever we can do to encourage serious government leadership and action to fight climate change. Please do what you can to pressure your representatives to counteract the self-serving special interests who consume our resources and return little or nothing from the super-profits they take overseas.

If we can help get climate savvy governments on the problems that really matter, they may be able to mobilize enough action so we can survive our accidental disruption of Earth’s Climate System so our kids and grandkids inherit a world they can live in….

Let’s hope that we can stop global warming soon enough to leave them with a future where they can survive and flourish

Featured Image: Rainfall and Flooding 2022 – Queensland to Tasmania. Current year data from 1 January to 2 November, sourced from Bureau of Meteorology, 2022. Graphic from Chapter 2, The Great Deluge: Climate Extremes in Action, in the featured article.

Views expressed in this post are those of its author(s), not necessarily all Vote Climate One members.

Urgent action needed now to stop warming!

Aside from some flooding Australia has had it fairly easy compared to increasing frequency, extent, and severity of climate catastrophes in other parts of the world.

Don’t let our cooler La Nina and Indian Ocean dipole conditions fool you. The rest of the world really suffering!

Bill McKibben, is an American environmentalist, author, and journalist who has written extensively on the impact of global warming and and leads the climate campaign group 350.org. Here he summarizes evidence from increasingly frequent, extensive, and ferocious climate catastrophes in the Northern Hemisphere that shows global warming is continuing to accelerate.

As many articles posted on Climate Sentinel News in the run-up to Australia’s May 21 federal election also show, nothing we have done to date has measurably slowed the acceleration of global warming that may well lead to runaway warming and global mass extinction of humans and most other complex life on Earth. To stop this process while we can, our nations need to actively mobilize now to stop all carbon emissions and begin rapidly ramping up research and pilot projects to recapture and safely sequester some of the excess carbon already in our atmosphere.

Removing our COALition Government and electing several more ‘teal’ community independents to Parliament in the election just passed has finally given us a Labor Government that might be able to prioritize real climate action. However, because Labor continues to have its share of special interest puppet masters in the fossil fuel industry, pressure still needs to be applied by voters and their teal representatives in Parliament to speed climate action.

As the featured article here shows, we are already seeing the kinds of climate catastrophes able to cause mass human die-off events directly from the climate extremes themselves or famines resulting from associated crop failures.

A buoy rests on the cracked mud of Lake Mead in Nevada, in normal times America’s biggest reservoir (from the article)

by Bill McKibben, 23/08/2022 in the Crucial Years

Water, Water Nowhere – Except the spots that are flooding

China is enduring a truly remarkable heatwave—by some accounts “the worst heatwave known in world climatic history.” (Its main competitor for the title may be last year’s insane ‘heat dome’ that ran Canadian temperatures up to 121 Fahrenheit). The heat just never lets up over some of the most densely populated land on planet earth: It hit 113 degrees Fahrenheit in Chongqing Thursday, the highest temperature ever recorded in the country outside of desert Xinjiang. It hit 110 in Sichuan, which is a province of…80 million people, or two Californias. When it gets that hot, water just evaporates—Sichuan is 80 percent dependent on hydropower, but the reservoirs behind the great dams like Three Gorges are falling nearly as fast as Lake Mead and Lake Powell. The province has cut power day after day, including to Tesla and Toyota factories, and to many of the firms that supply the planet’s auto parts; the EV revolution is being held up by the effects of the problem it is trying to solve.

Read the complete article….

Featured Image: Own resources.

Views expressed in this post are those of its author(s), not necessarily all Vote Climate One members.

Michael Mann on South African flooding catastrophe

In a warming world La Niña enables air over the ocean to carry more water vapor. When pushed into hills ashore, the vapor turns into floods.

Michael Mann discusses the deadly South African floods, the role that climate crisis is playing with these extreme events, and what we need to do about it, with BBC World News “The Context” (Apr 14, 2022

Featured Image: Area of extreme flooding, Durban, South Africa on the same latitude as the NSW northern coast area (e.g., Coffs Harbor) demonstrating the apparently global extent of NB4 rainfalls along this band of the world. (The Guardian also reports on these floods) / From Google Earth Pro, by William Hall. Public domain.

Views expressed in this post are those of its author(s), not necessarily all Vote Climate One members.

Rising crescendos: clusters of climate catastrophes

In a warming climate extreme weather events may encourage other extreme events to closely follow, e.g., fires followed by floods & landslides

Debris from a mudslide covers a home on January 10, 2018 in Montecito, California. Credit: Justin Sullivan/Getty Images / from the article.

by Andrea Thompson, on 01/04/2022 in Scientific American

Double Disaster: Wildfires Followed by Extreme Rainfall Are More Likely with Climate Change: These events can cause devastating landslides and flash floods

At 3:30 A.M. on January 9, 2018, half an inch of rain poured down on the charred slopes of the Santa Ynez Mountains in coastal southern California. The flames of the Thomas Fire—at the time the largest wildfire in state history—had swept through the previous month, leaving the soil and vegetation scorched and unable to soak up the onslaught of water. The destabilized ground gave way in a devastating landslide. Boulders crashed into houses in the town of Montecito, Calif., and a highway was buried under several feet of mud. The disaster killed 23 people and caused an estimate of around $200 million in damage.

Read the complete article….

See the scientific report that is the source of this article: Touma et al., 01/04/2022, Climate change increases risk of extreme rainfall following wildfire in the western United States in Science Advances

Featured Image: This image from a rescue helicopter records the burn scar from the Thomas Fire, as well as the path of a deadly mudslide in Montecito, Calif., in January 2018. Credit: California National Guard, CC BY 2.0 / from No Relief from Rain: Climate Change Fuels Compound Disasters: Climate change is increasing the risk of fire-rain events, raising mudslide concerns in fire-prone communities. by Leah Campbell, 12/12/2021 in EOS.

Views expressed in this post are those of its author(s), not necessarily all Vote Climate One members.

Floods and then more floods! Can we expect more yet?

Multiple floods in La Niña years are not unknown in Australia, but global warming can supply more water that makes extreme flooding even worse.

Jason O’Brien/AAP Image from the article

by Margaret Cook, 31/03/2022 in the Conversation

Why can floods like those in the Northern Rivers come in clusters?

Right now, Lismore residents are going through their second major flood in a month.

On February 28th, the devastating first flood peaked at 14.4 metres, fully two metres higher than the previous record of 12.27 metres in 1954, and well above the town’s 10-metre-high levee wall, constructed in 2005. Four people died, with 2000 homes destroyed or unlivable of the city’s 19,000.

Even as Lismore and Northern Rivers residents struggle to recover from the first flood, the floods are coming again. On March 29th, more heavy rain began falling onto the soaked catchment feeding into Wilsons River.

Read the complete article….

Featured Image: Lismore locals are still cleaning up after February’s floods – now they are being hit again. Darren England/AAP Image / from the article.

Views expressed in this post are those of its author(s), not necessarily all Vote Climate One members.

What ‘Mr Doesn’t Hold a Hose’ thinks of Global Warming

Budget papers show Morrison government plans to cut climate spending if it wins election: Reduction in spending across clean energy agencies represents a 35% annual cut over four years.
By Adam Morton, 29/03/2022 in The Guardian

Views expressed in this post are those of its author(s), not necessarily all Vote Climate One members.

Excuse profanity, but Juice Media tells the truth

Floods and climate disasters will keep rising until global warming is reversed. Scummo’s govt. will only continue shoveling coal on the fire.

Honest Government Ad | The Floods
The Australian Government has made an ad about this summer’s floods and it’s surprisingly honest and informative – 17/03/2022 in thejuicemedia

Editor’s comment: This was recorded BEFORE the present NB4 flooding in a sequence of NB4 floods…. Think about who you are voting for!

Featured image: River levels could top 16 metres at Lismore amid more expected rain, the weather bureau says. / from Northern Beaches Review article 28/02/2022 by Australian Associated Press, NSW flood crisis ‘unprecedented’: premier

Views expressed in this post are those of its author(s), not necessarily all Vote Climate One members.

What Mr ‘Doesn’t Hold a Hose’ thinks of Global Warming

Budget papers show Morrison government plans to cut climate spending if it wins election: Reduction in spending across clean energy agencies represents a 35% annual cut over four years.
By Adam Morton, 29/03/2022 in The Guardian

Views expressed in this post are those of its author(s), not necessarily all Vote Climate One members.