Sept. 2023 climate extremes
Notable observations and news items from the Web, with no processing and little in the way of comment. Make of them what you will.
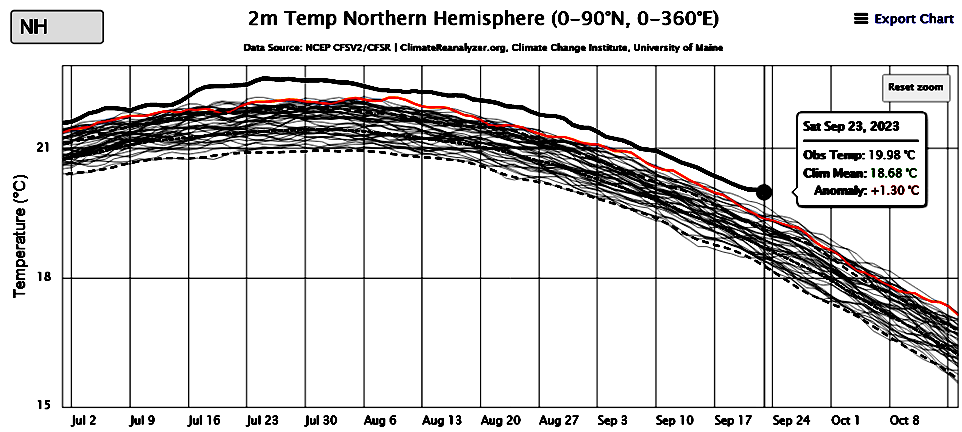
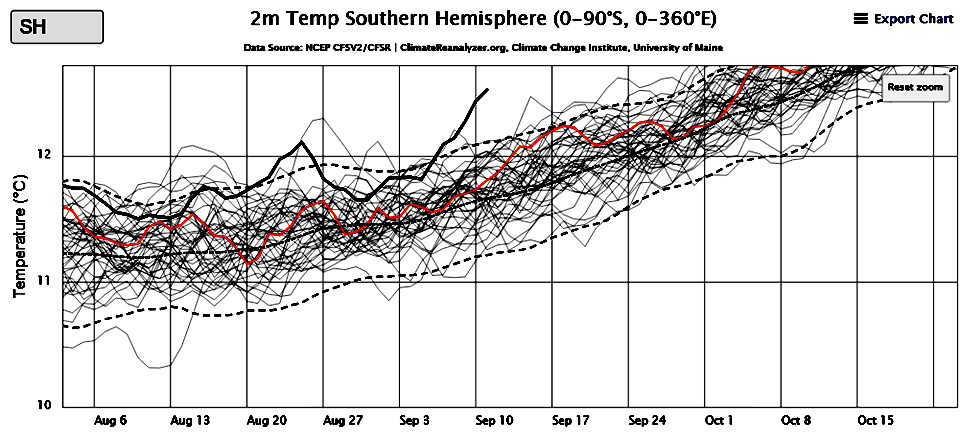
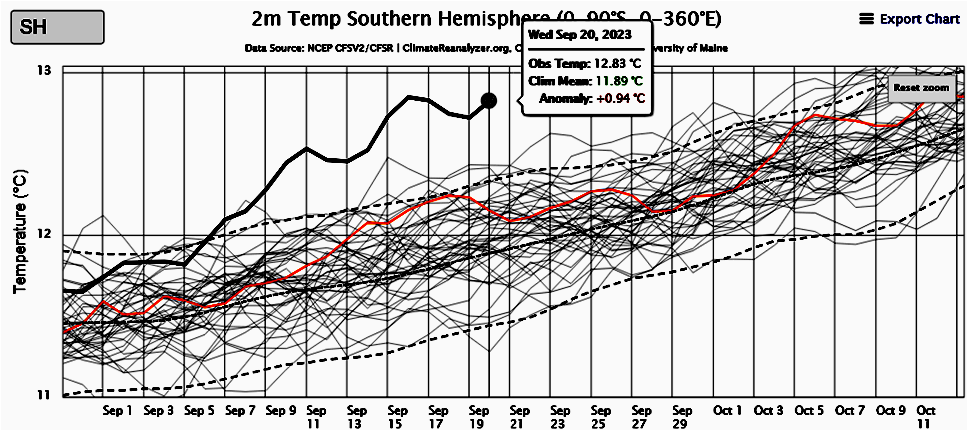
Leading up to this September’s extremes
The hottest summer in human history – a visual timeline
Jonathan Watts, Lucy Swan, Rich Cousins, Garry Blight, Harvey Symons and Paul Scruton
29/09/2023 in The GuardianFrom June to August 2023, a series of extreme weather events exacerbated by climate breakdown caused death and destruction across the globe.
As the world sweltered through the hottest three month spell in human history this summer, extreme weather disasters took more than 18,000 lives, drove at least 150,000 people from their homes, affected hundreds of millions of others and caused billions of dollars of damage.
That is a conservative tally from the most widely covered disasters between early June and early September, which have been compiled in the timeline below as a reminder of how tough this period has been and what might lie ahead.
For details and the complete timeline, read the complete article….
https://grist.org/extreme-heat/parts-of-the-world-have-already-grown-too-hot-for-human-survival/
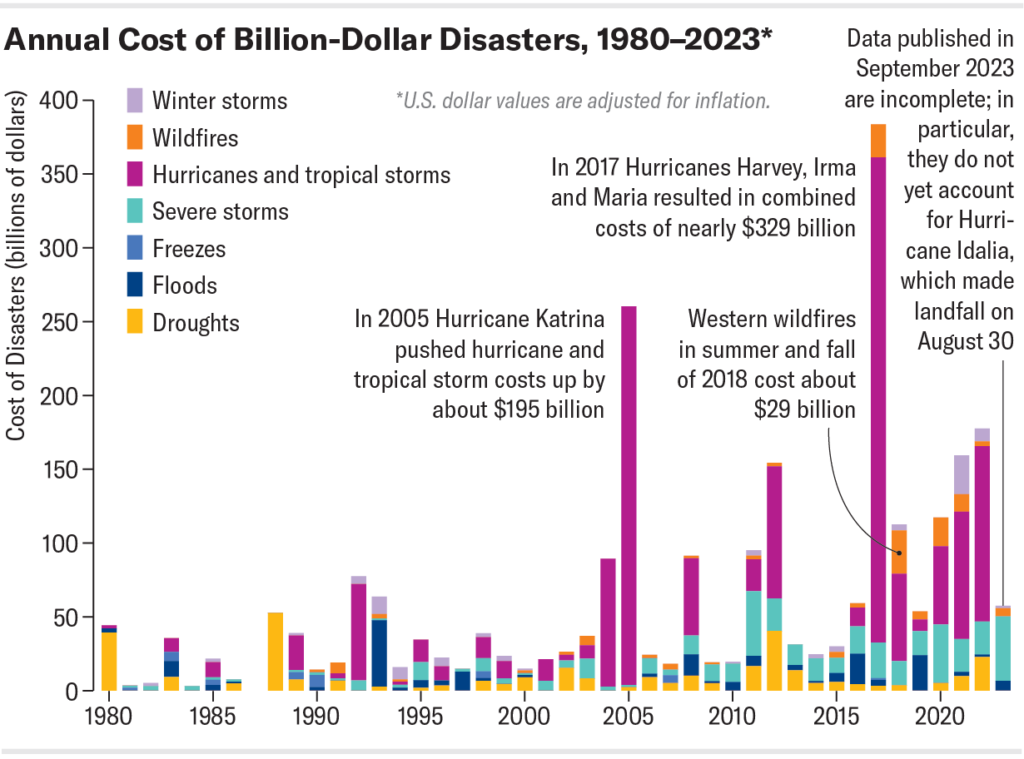
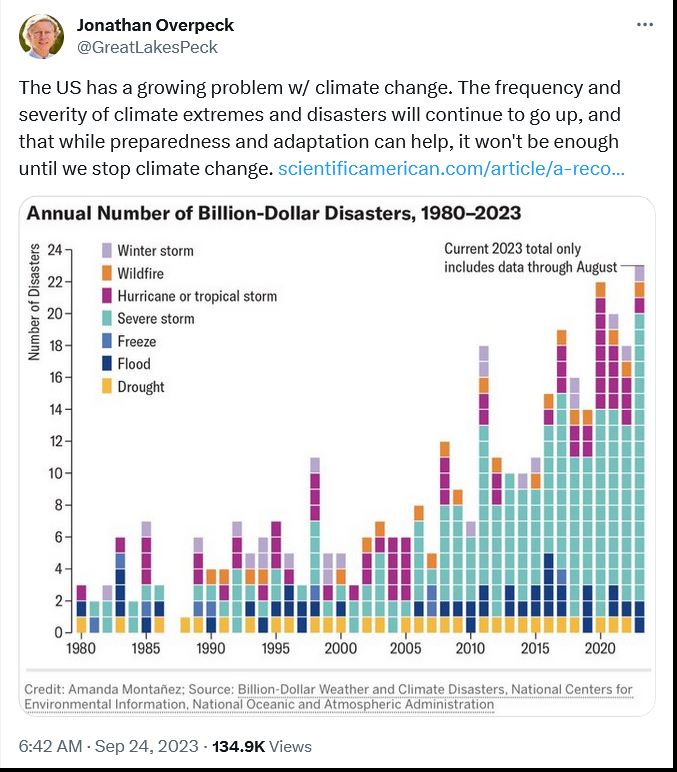
How much are these extremes costing society. For an idea see the following graphic from Scientific American’s blog. Note: this graphic applies only to the US,

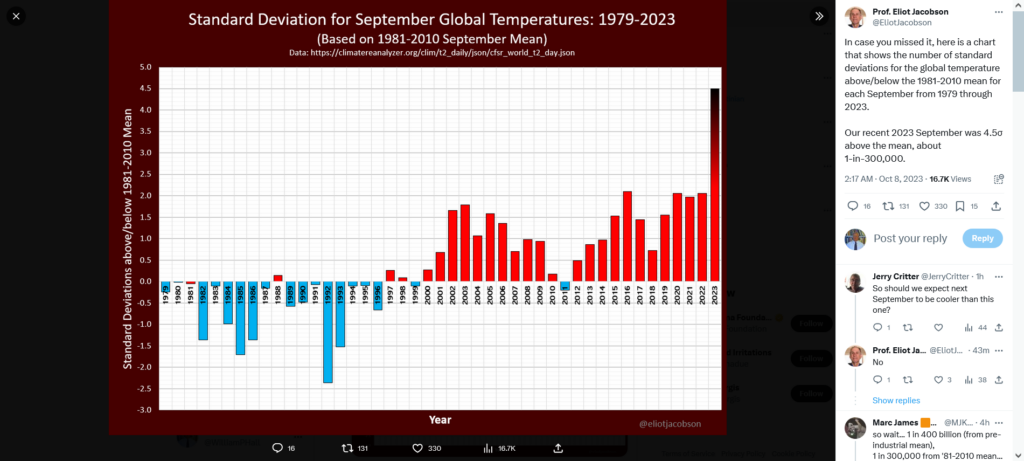
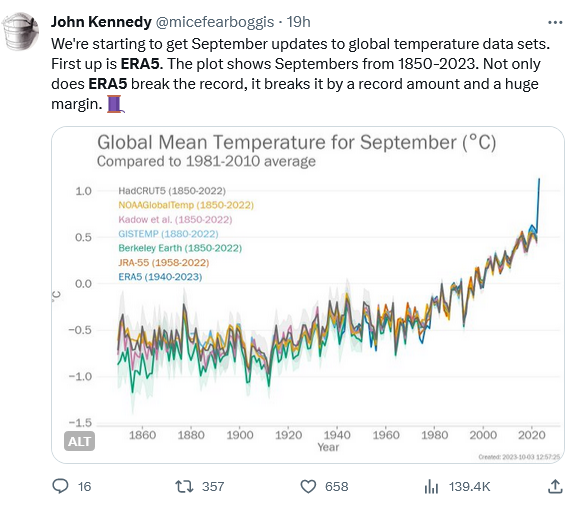
https://www.theguardian.com/environment/2023/aug/28/crazy-off-the-charts-records-has-humanity-finally-broken-the-climate Warning: Data is provided for this article by climate scientists who suffer from the reticence causing academic and institutional scientists to downplay any overly ‘dramatic’ warnings in order to avoid alarming departmental colleagues, administrators, or governments influencing hiring, promotion, financial support for research, etc. Google “scientific reticence” and you will find lots of evidence on how it works.
https://www.theguardian.com/world/2023/sep/13/antartica-global-warming-sea-ice-caps-regime-shift
There is far worse to come as warming continues to increase https://www.theguardian.com/environment/2023/sep/19/global-heating-made-mediterranean-floods-more-likely-study-says
Implications
The current extremely low sea ice will have a range of impacts. Changed ocean stratification and circulation will alter basal melting beneath ice shelves48. Greater coastal exposure will increase coastal erosion and reduce ice-shelf stability49. Changes in dense shelf water production will alter bottom water formation and deep ocean ventilation50. Sea ice changes will also have contrasting influences on Adélie and emperor penguin colonies51,52, and substantially alter human activities along the Antarctic coastline.
Anthropogenic greenhouse gas emissions have been attributed as the primary cause of Southern Ocean warming, and here we suggest a potential link to a regime shift in Antarctic sea ice. While for many years, Antarctic sea ice increased despite increasing global temperatures6, it appears that we may now be seeing the inevitable decline, long projected by climate models53. The far-reaching implications of Antarctic sea ice loss highlight the urgent need to reduce greenhouse gas emissions.
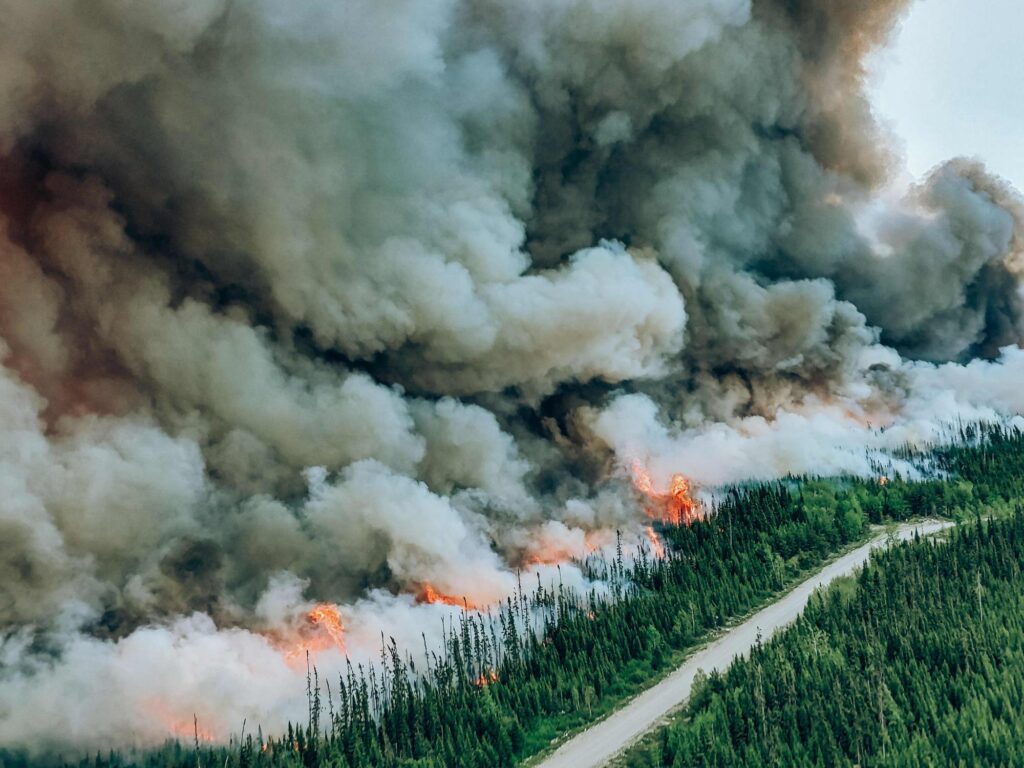
Canadian wildfires are consuming North America’s boreal forests
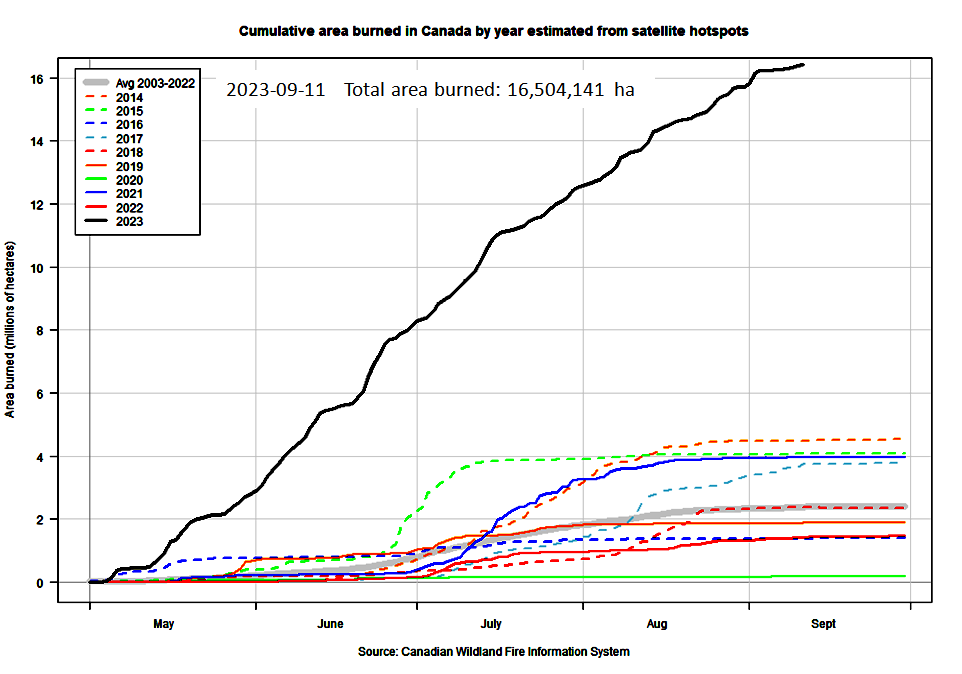
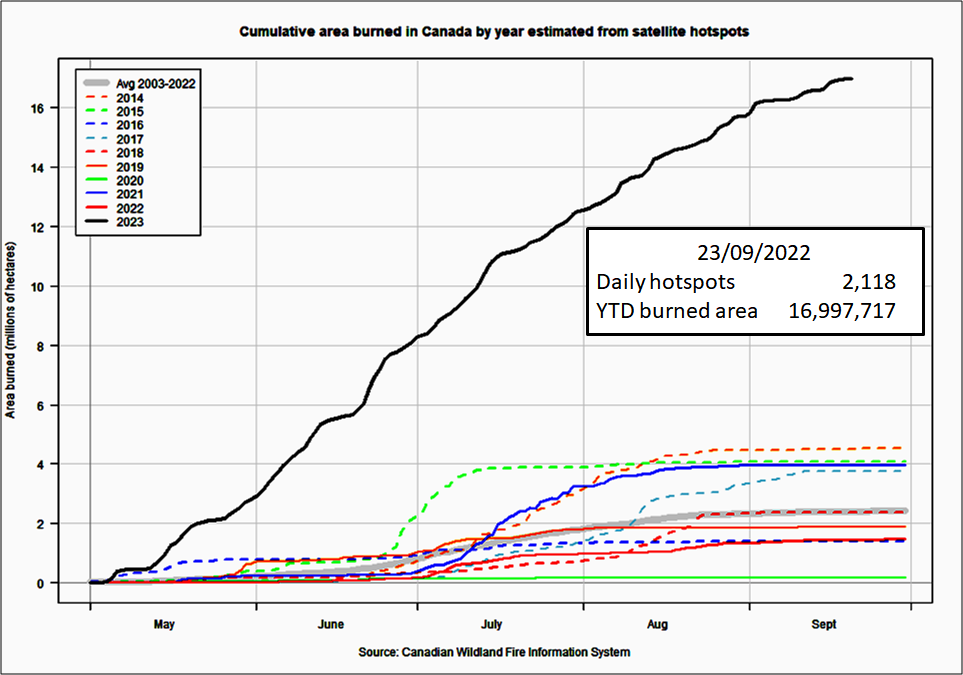
Cumulative total land area burned to date
2023-09-25 17,850,290
2023-09-24 n.a.
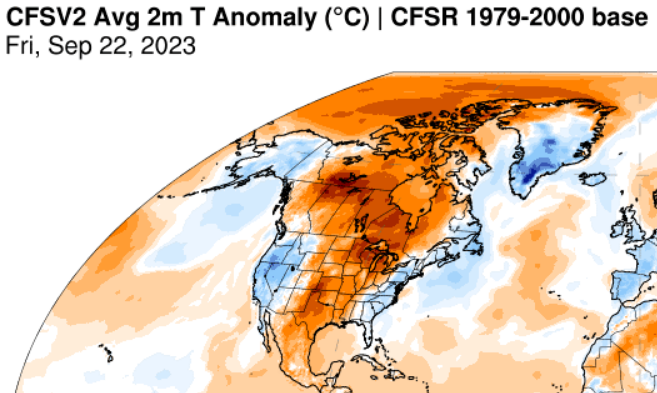
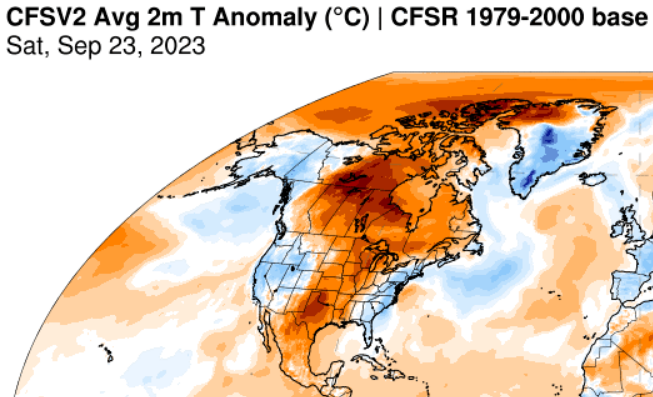
2023-09-23 17,812,661
2023-09-22 17,100,899
2023-09-21 17,012,456
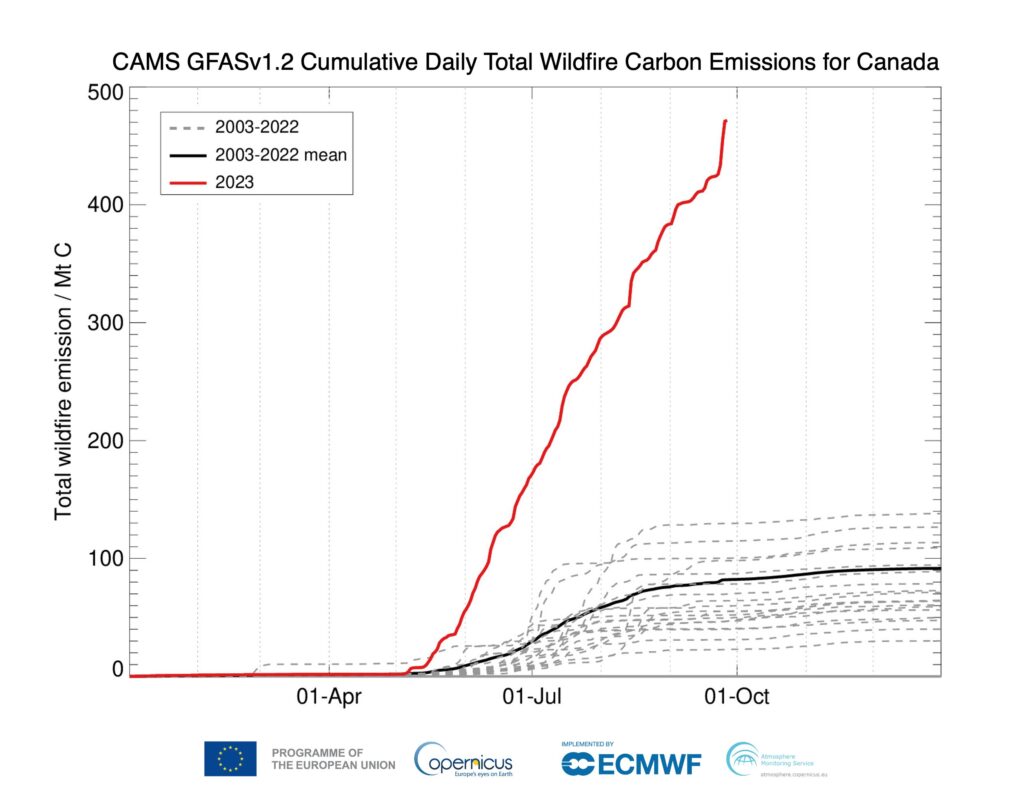
The record for the 23rd blew the Canadian system’s off the chart! The following chart from Copernicus, the EU’s equivalent of NASA, that operates the satellites, suggests the data from the 23d is probably a real record of what the satellites actually recorded. In most years the wildfires would have been more-or-less through for the year. Yet 23 Sept shows BY FAR the largest number of hotspots recorded for the year so far, previous highs being 9269 for June 22 and 9692 for July 13.
For the latest Natural Resources Canada tabulation, see https://cwfis.cfs.nrcan.gc.ca/maps/fm3?type=arpt. Note 1: the current version of the total burned area chart can be seen by scrolling down to the bottom of the table accessed by this link.
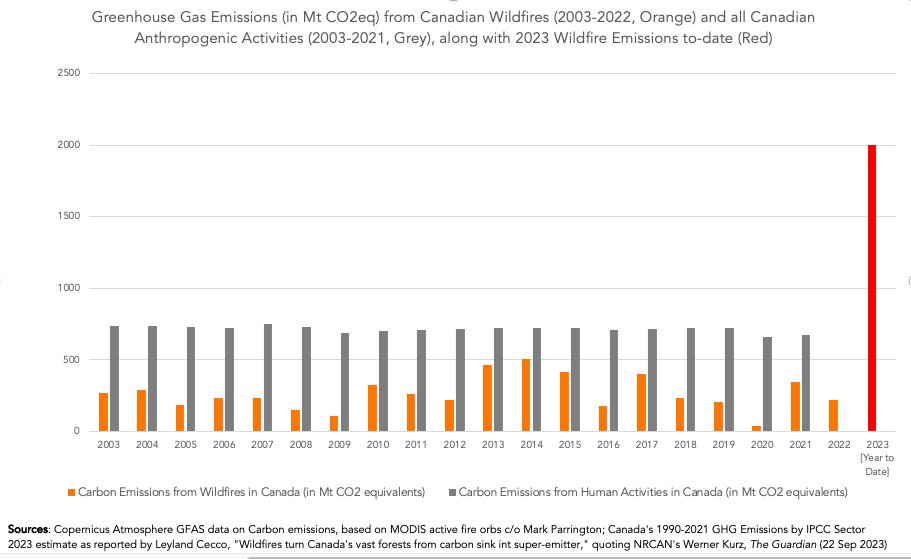
Note 2: the following Guardian chart was PUBLISHED on 22 Sept.
climate change impacts on forest landscapes, natural disturbances, wildlife habitat.
https://www.theguardian.com/world/2023/sep/22/canada-wildfires-forests-carbon-emissions – “This year’s out-of-control blazes released 2bn tonnes of CO2 – probably triple the country’s annual carbon footprint”.
Note: warmer winter temperatures allowed mountain pine beetle populations to grow explosively through this region due to additional reproduction of adult beetles that were normally killed off by hard freezing winters. I did several Facebook posts in 2016 and 2018 on the increasing fire hazard this would create until the dead biomass was removed. This year’s extreme temperatures facilitated this!
See Hall (2020) Portents for the Future – 2020 Wildfires on the Siberian Permafrost.
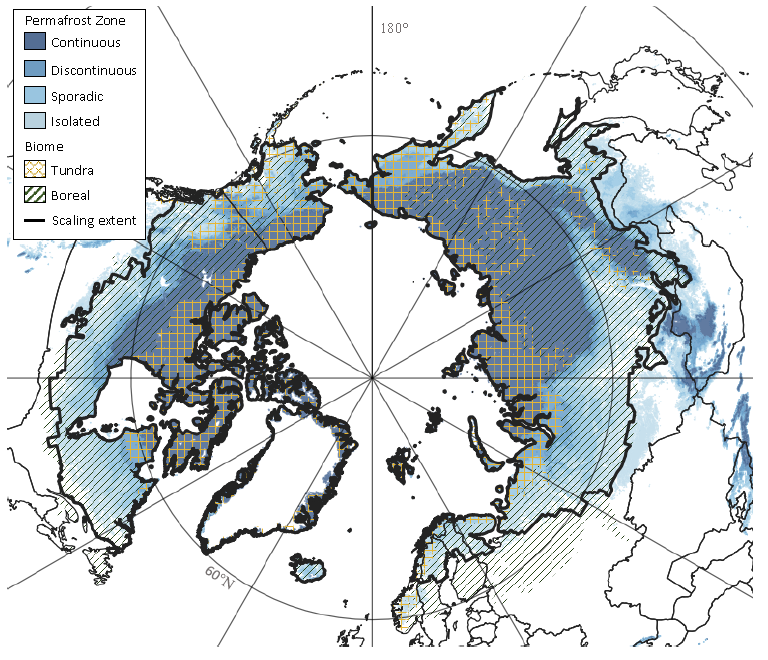
Permafrost zones on brink of runaway GHG emissions(?)
Global permafrost now (2000-2020) likely to be a net emitter of greenhouse gases methane and N₂O – Ramage, et al. (September 11, 2023 unreviewed preprint) The net GHG balance and budget of the permafrost region (2000-2020) from ecosystem flux upscaling.
[Note that 2020- Siberian wildfires plus this years’ wildfires in the Canadian Arctic Zone probably produced massive increases in permafrost GHG emissions beyond what was happening during the years included in this survey.]
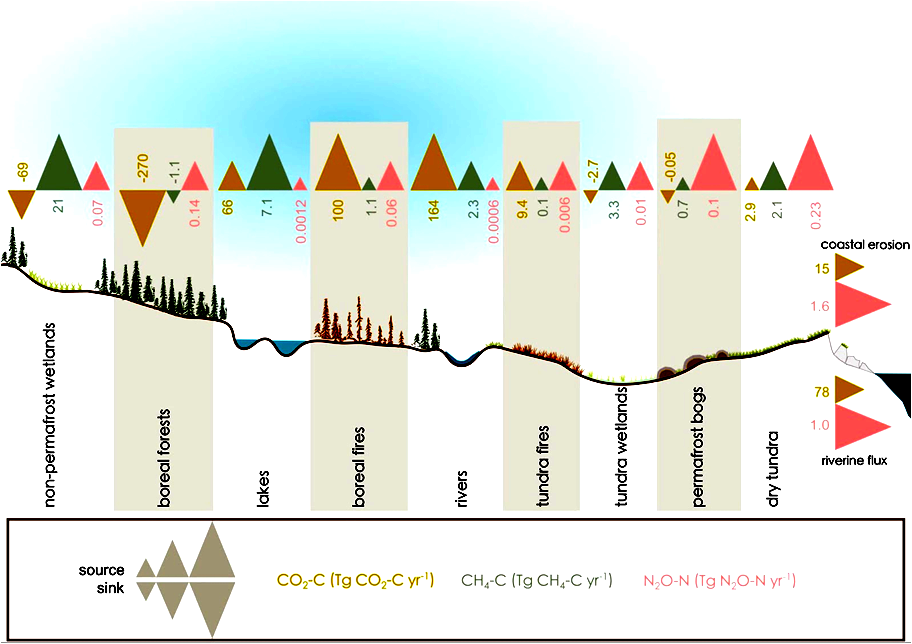
fluxes from coastal erosion and riverine fluxes are also reported in Tg C yr-1 and Tg N yr-1. Symbols for fluxes indicate high (x>Q3), medium (Q1<x<Q3), and low (<Q1) fluxes, in comparison the quartile (Q). Note that the magnitudes across three di erent GHG fluxes within each land cover class cannot be compared with each other.
https://www.theguardian.com/environment/2023/sep/11/us-record-billion-dollar-climate-disasters Note, as the frequency, extent, and ferocity of climate disasters continue to increase with accelerating global warming, newer disasters will overlap and add to destruction from previous disasters where there has not been enough time to complete repair and remediation leading to the accelerating accumulated climate damage — until society no longer has the resources to continue repairing and replacing what has already been repaired and replaced. At this point social collapse is inevitable…… We must stop and reverse the process of global warming that is causing this or face near-term extinction.
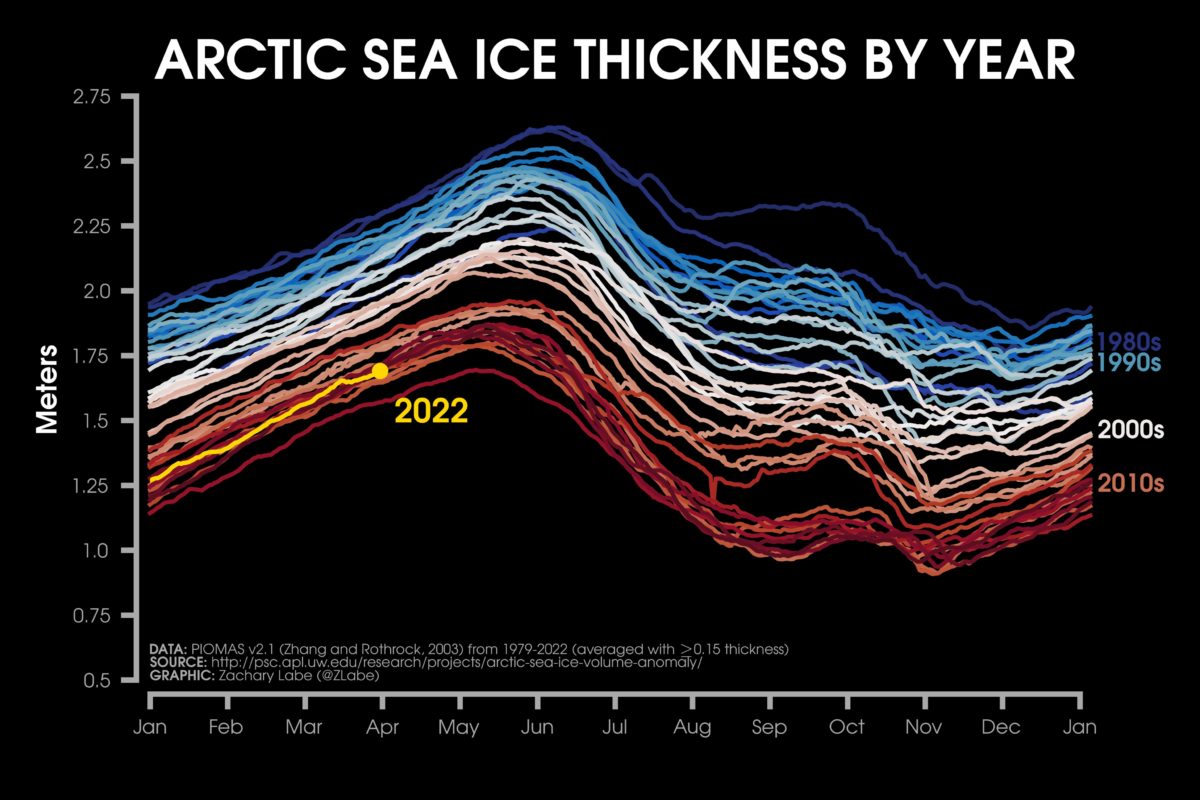
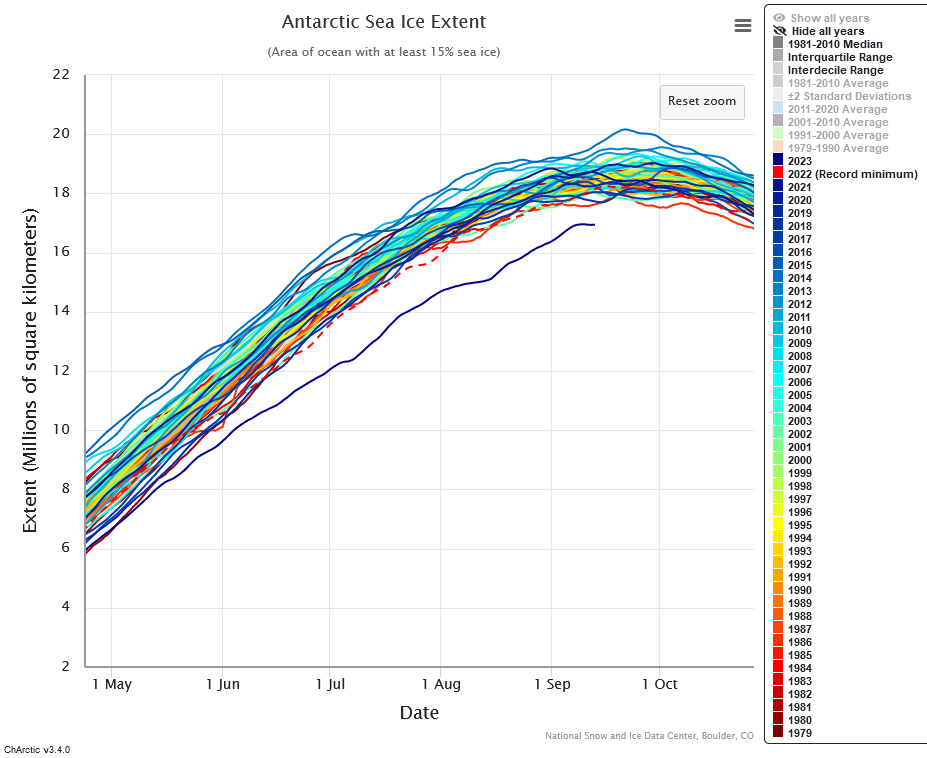
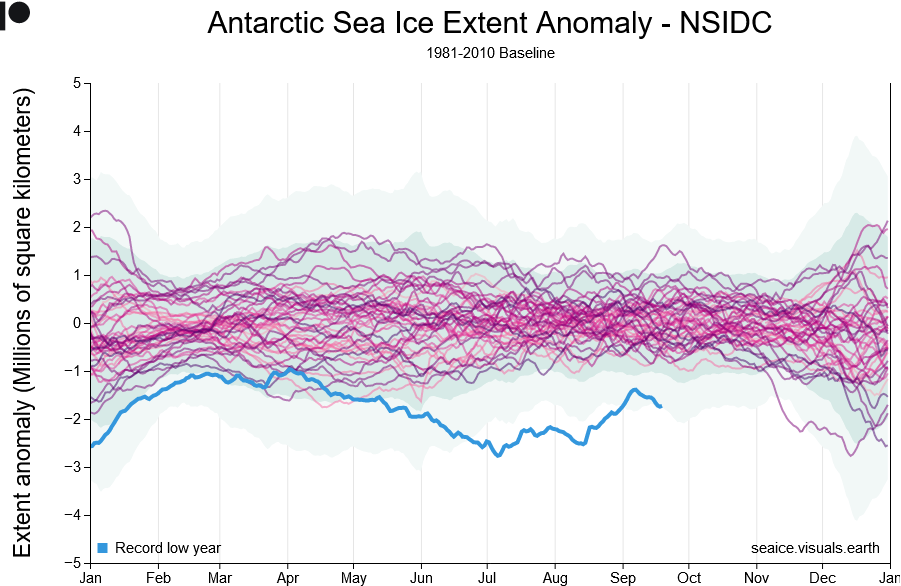
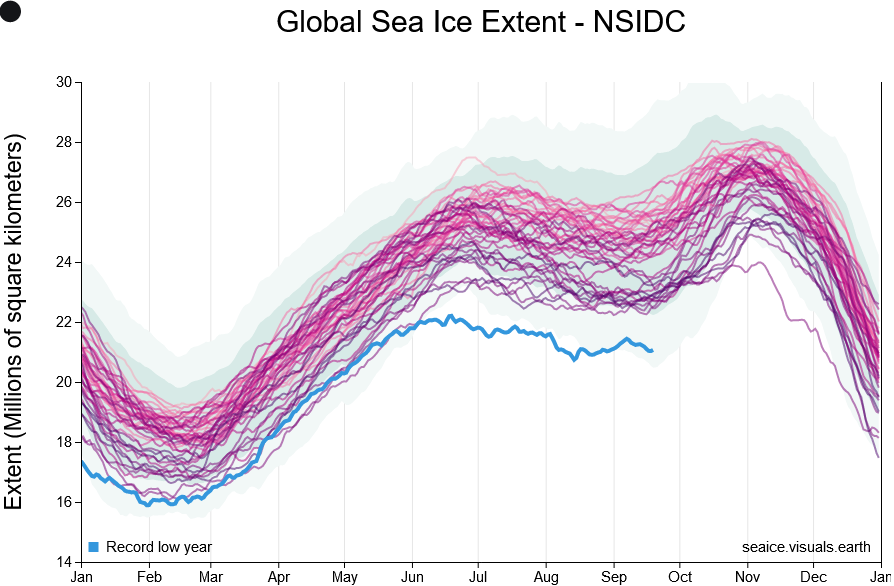
Dwindling sea-ice reflects less solar energy away
https://www.theguardian.com/world/2023/sep/13/antartica-global-warming-sea-ice-caps-regime-shift
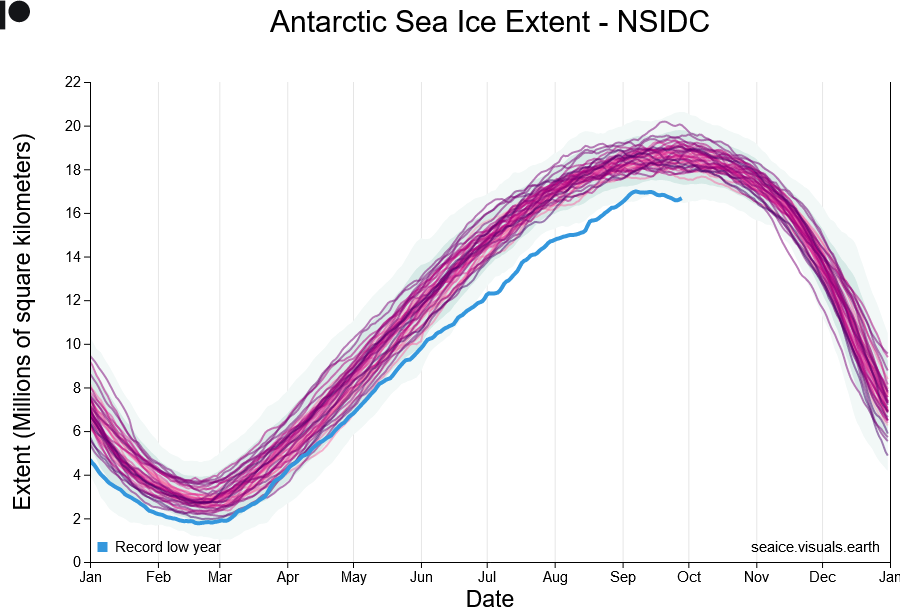
Antarctic sea-ice at ‘mind-blowing’ low alarms experts Excellent BBC article with good links to further research and discussions.
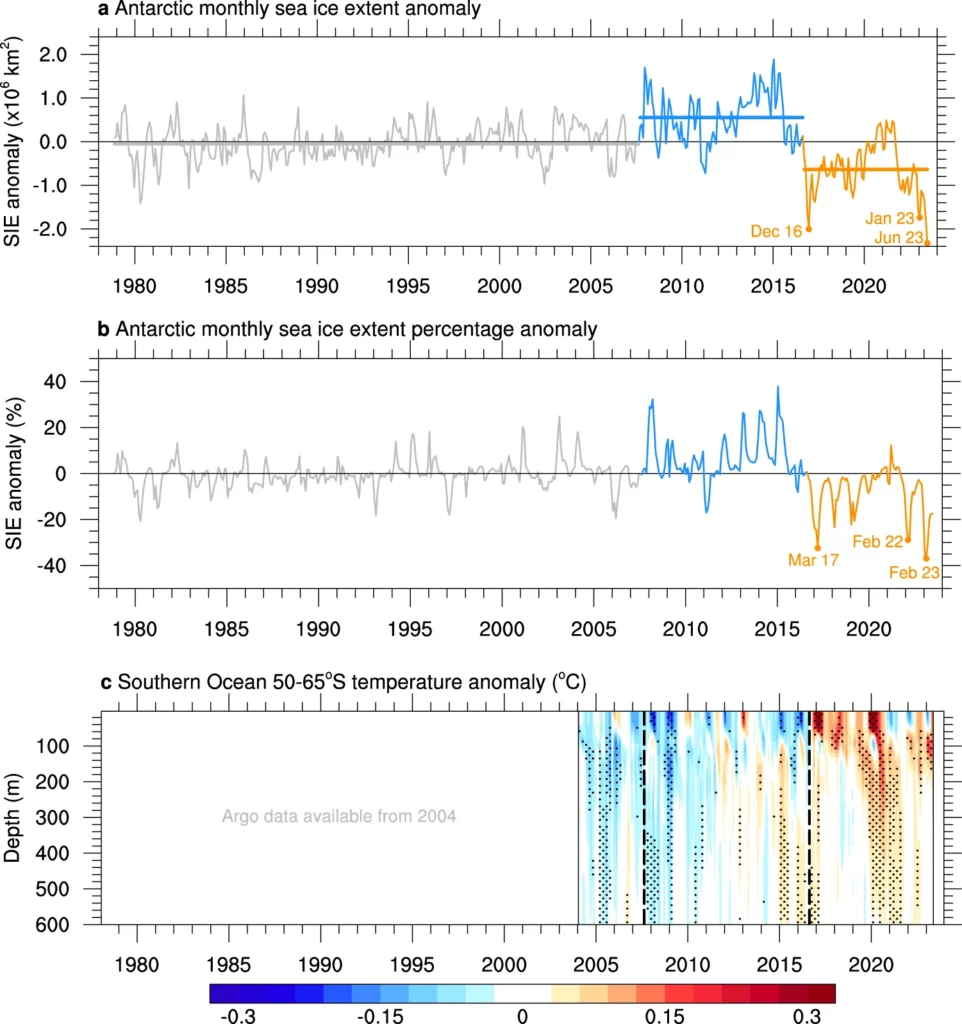
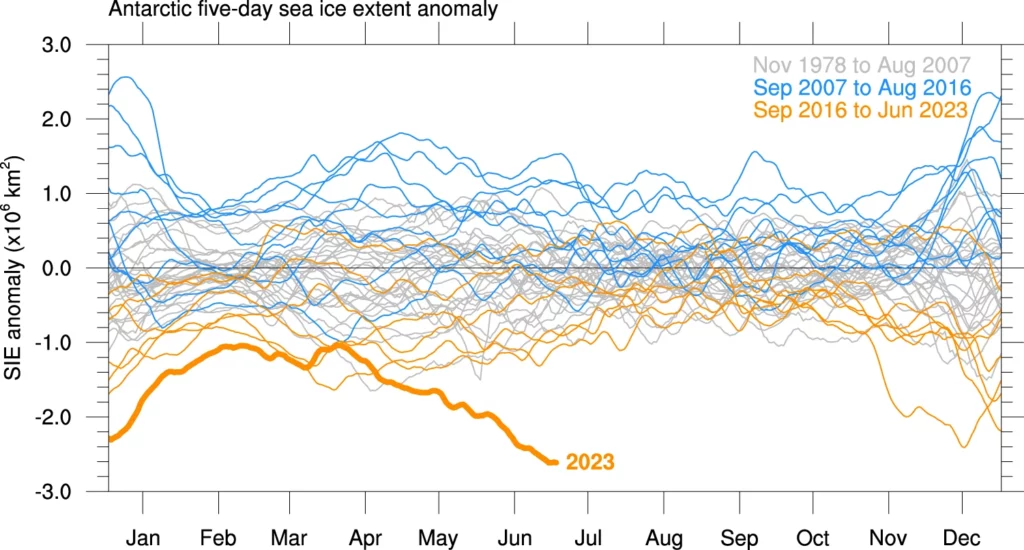
(13.09/2023) Nature Communications Earth & Environment. Record low Antarctic sea ice coverage indicates a new sea ice state.
In February 2023, Antarctic sea ice set a record minimum; there have now been three record-breaking low sea ice summers in seven years. Following the summer minimum, circumpolar Antarctic sea ice coverage remained exceptionally low during the autumn and winter advance, leading to the largest negative areal extent anomalies observed over the satellite era. Here, we show the confluence of Southern Ocean subsurface warming and record minima and suggest that ocean warming has played a role in pushing Antarctic sea ice into a new low-extent state. In addition, this new state exhibits different seasonal persistence characteristics, suggesting that the underlying processes controlling Antarctic sea ice coverage may have altered. [my emphasis]
Implications
The current extremely low [Antarctic] sea ice will have a range of impacts. Changed ocean stratification and circulation will alter basal melting beneath ice shelves48. Greater coastal exposure will increase coastal erosion and reduce ice-shelf stability49. Changes in dense shelf water production will alter bottom water formation and deep ocean ventilation50. Sea ice changes will also have contrasting influences on Adélie and emperor penguin colonies51,52, and substantially alter human activities along the Antarctic coastline.
Anthropogenic greenhouse gas emissions have been attributed as the primary cause of Southern Ocean warming, and here we suggest a potential link to a regime shift in Antarctic sea ice. While for many years, Antarctic sea ice increased despite increasing global temperatures, it appears that we may now be seeing the inevitable decline, long projected by climate models. The far-reaching implications of Antarctic sea ice loss highlight the urgent need to reduce greenhouse gas emissions. [my emphasis]
End. For the complete article see Record low Antarctic sea ice coverage indicates a new sea ice state.
A very good summary of the state of global sea-ice to the end of September: https://www.carbonbrief.org/exceptional-antarctic-melt-drives-months-of-record-low-global-sea-ice-cover/
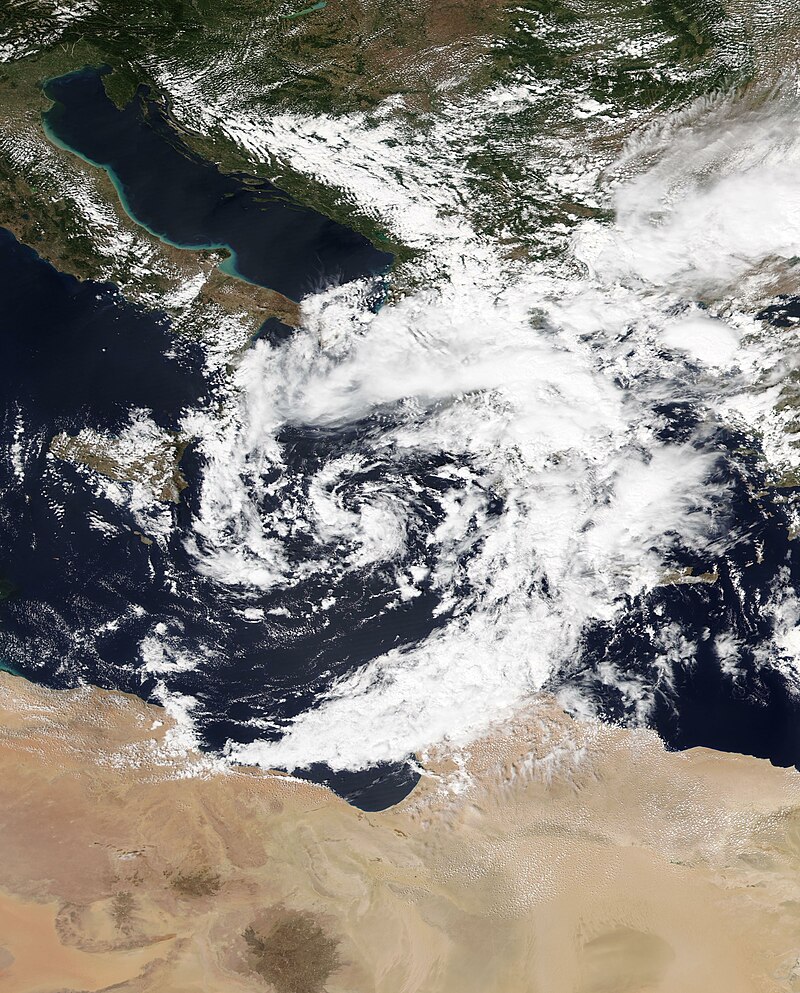
Storm Daniel comprehensively trashed several countries around the Eastern Mediterranean between 4 and 13 Sept.
Wikipedia tells the story and links to many of the news items. It was the deadliest Mediterranean tropical-like cyclone in recorded history
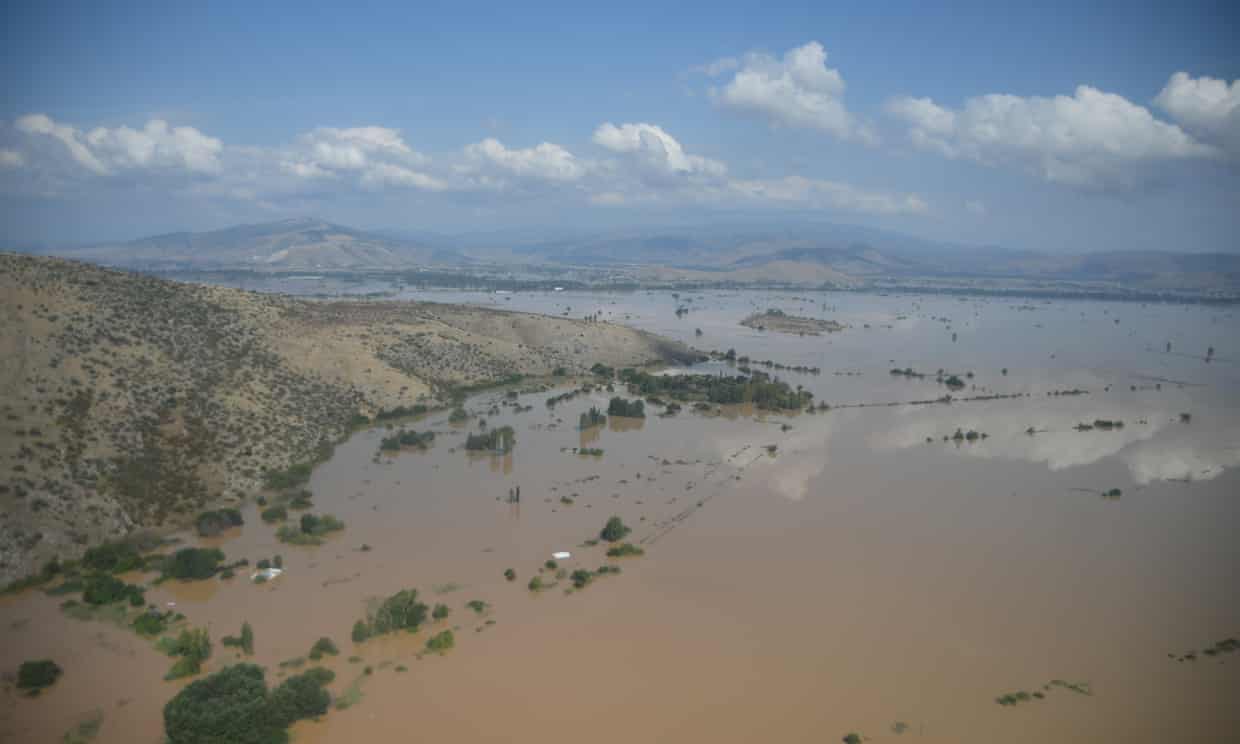
Greece
https://www.theguardian.com/world/2023/sep/09/greek-rescuers-working-through-the-night-to-locate-villagers-trapped-by-flood: “The once fertile Thessaly plain, the nation’s breadbasket, now lies metres deep under mud and silt, with great swaths resembling a lake.” I read somewhere else that 1/3 of Greece’s TOTAL prime agricultural land was under water….
https://earthobservatory.nasa.gov/images/151807/a-deluge-in-greece
Libya – Too much water in the atmosphere!
Key facts from CDR (Center for Disaster Recovery):
https://disasterphilanthropy.org/disasters/2023-libya-floods/
- As of Sept. 15, the Libyan Red Crescent said the death toll had reached 11,300 people in Derna alone. Officials expect this figure to continue to rise, possibly as high as 20,000. About 170 people were also killed in other parts of eastern Libya, including in Susa, Marj, Bayda and Um Razaz. More than 7,000 people were injured and at least 10,100 people are still reported to be missing. Because of the lack of telecommunications, some may be displaced and unable to reach family, but due to the large-scale destruction, it is hard to confirm these figures.
- According to Floodlist, Libya’s National Center of Meteorology reported, “in a 24 hour period to Sept. 10, a staggering 414.1 mm [16.2 inches] of rain was recorded in Bayda, while 240 mm [9.5 inches] of rain fell in Marawah in the District of Jabal al Akhdar, and 170 mm [6.7] fell in Al Abraq in the Derna District.”
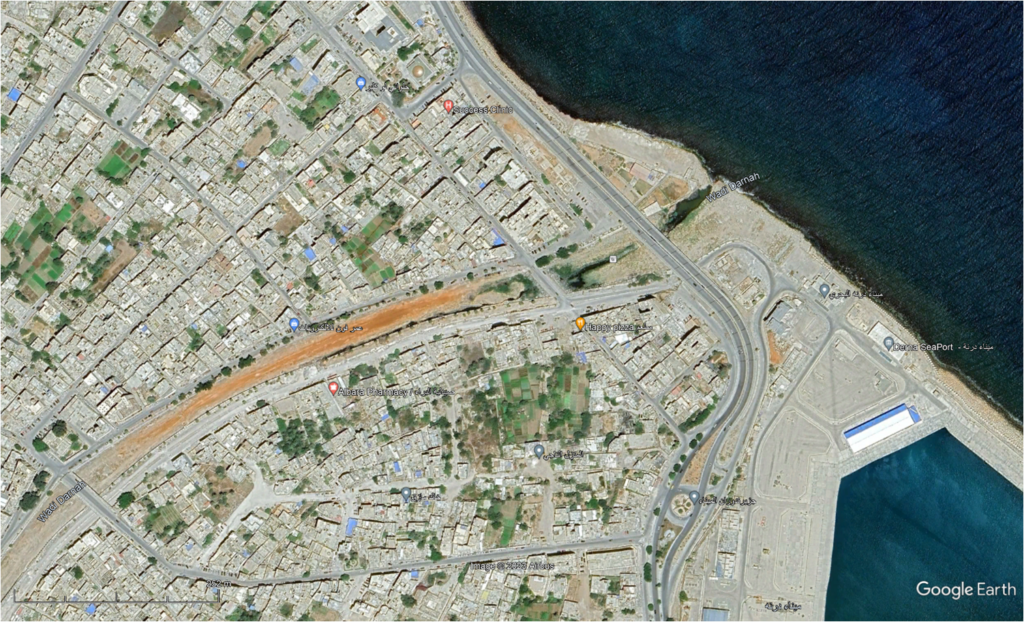
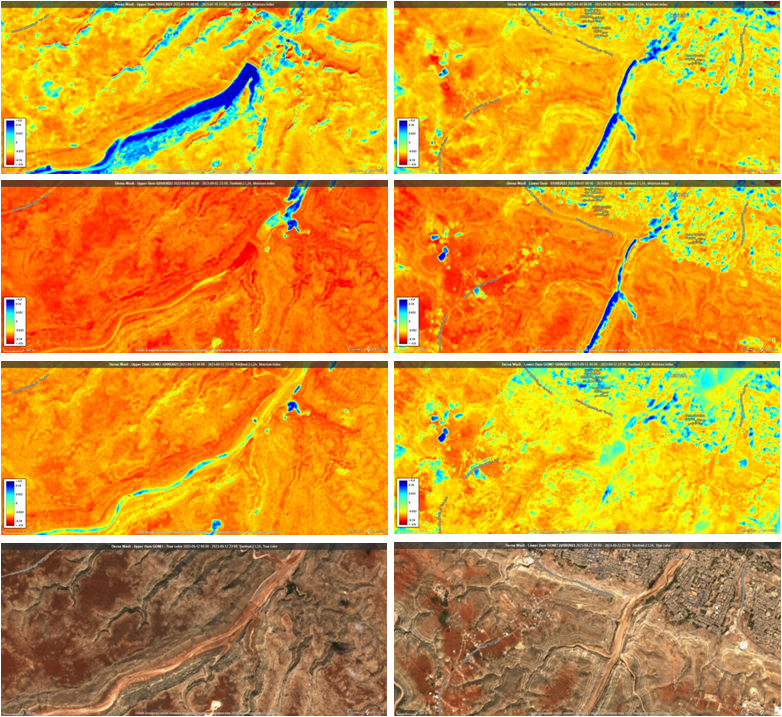
I used publicly available satellite imagery to try assess the damage attributed largely due to the failure of two dams. My conclusion is that the dams were no more than momentary and relatively insignificant barriers to to the flow of an inconceivably large volume of water. The following satellite images from Google Earth, and Sentinel Hub’s EO Browser clearly demonstrate the power of our planet’s increasingly extreme weather events driven by global warming. As the oceans and atmosphere warm, the atmosphere is able to transport increasingly stupendous volumes of water (in the form of water vapor) over the land to be dropped when the air cools for any reason.
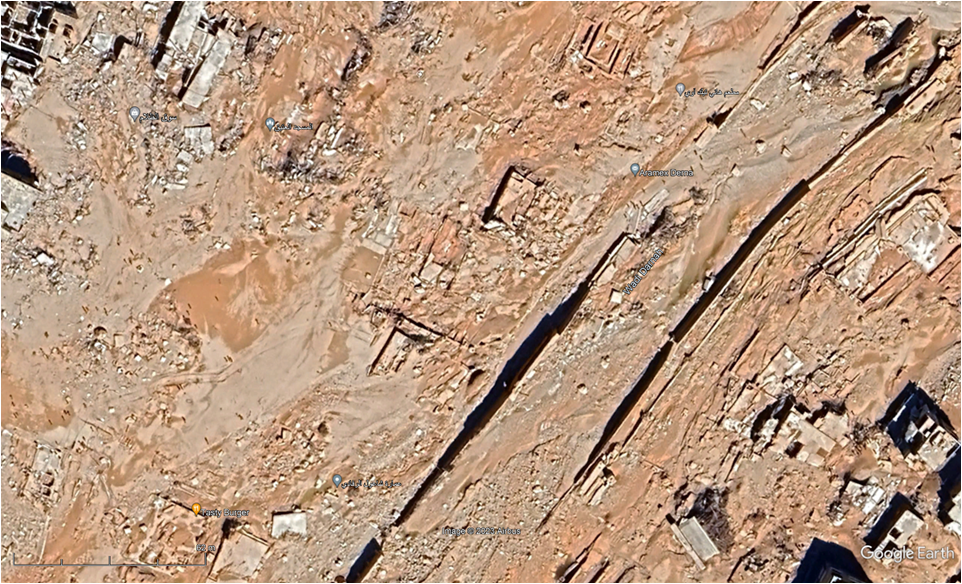
The following image is what appears to be the center of the city of Derna (pop ~100,000) immediately before Storm Daniel dropped part of its load of water in the watershed of Wadi Derna. The very dry stream bed of Wadi Derna crosses the center of the image. If you have access to Google Earth, you can zoom in to see shadows of the few individual people out in the mid-day sun.
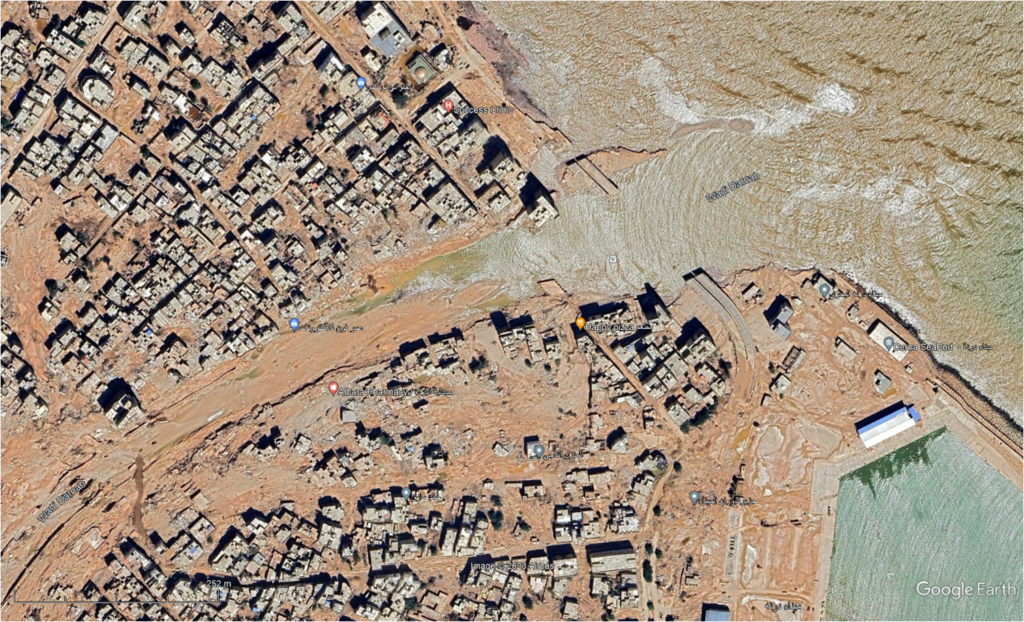
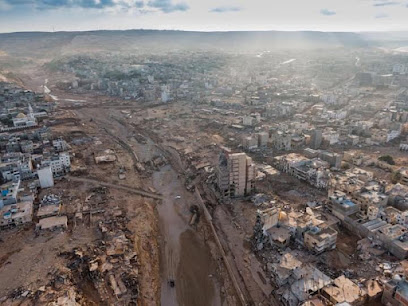
Immediately after it looked like this:
The next two pictures zoom in on the area between the vanished bridge in the above images and the next bridge upstream (just off the edge of the above).
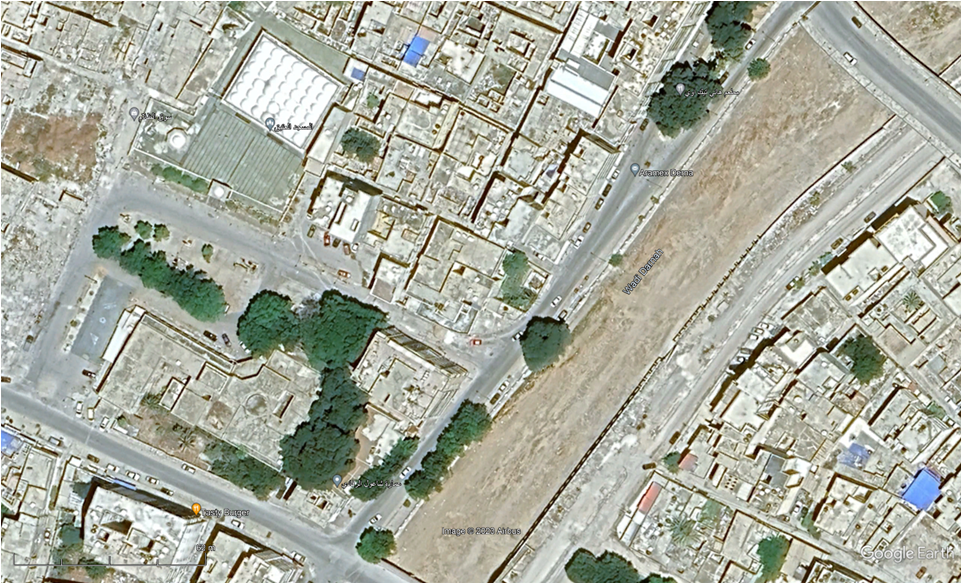
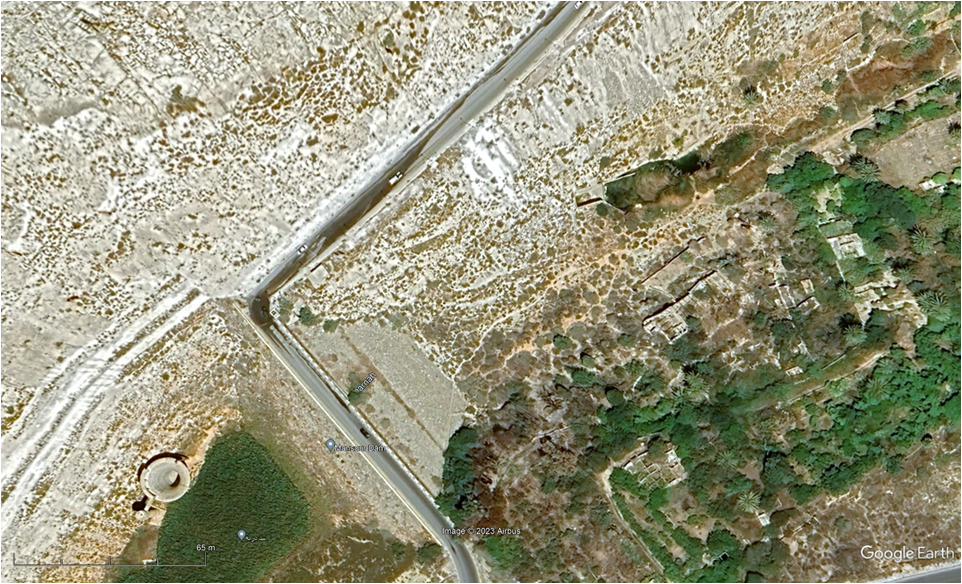
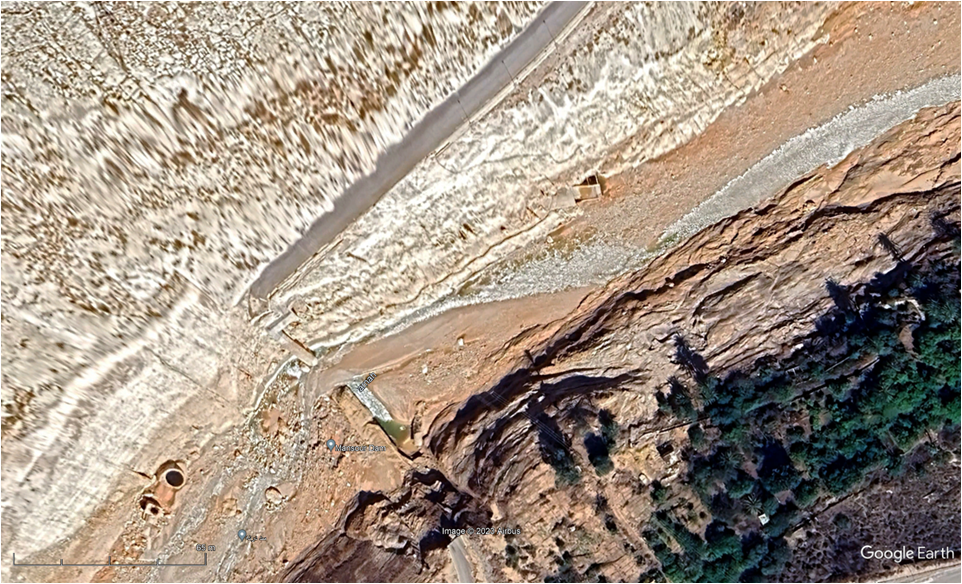
The next two pictures show the site of the lower dam – 250 meters upstream from the inland edge of the city.
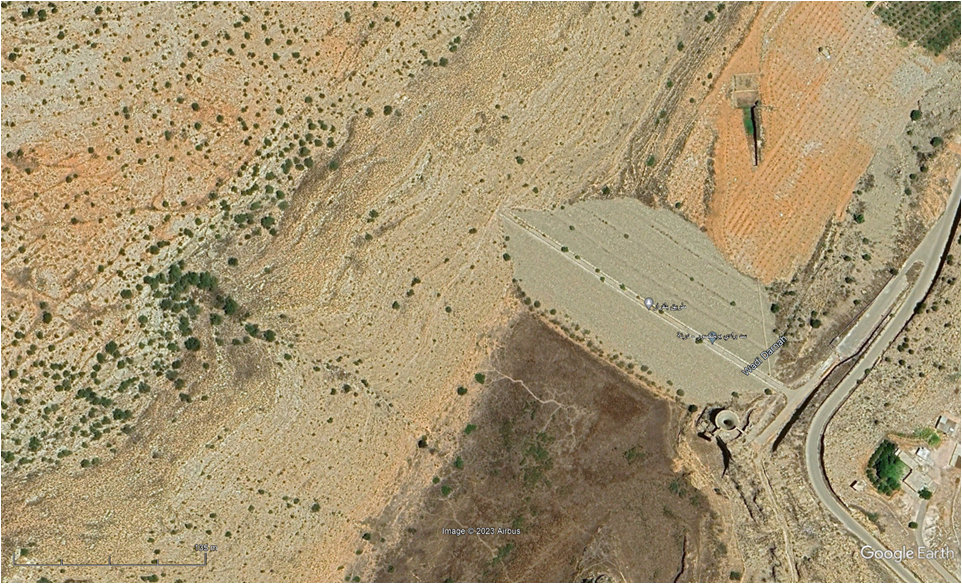
The next Google Earth image is of the upper dam (12.5 km upstream from the lower dam) from immediately before Storm David’s rain. There is no high resolution image available from after the flood.
The last composite graphic gives an impression of the amount of water held behind both dams in the days immediately prior to Storm David. All are sourced via Sentinel Hub’s EO Browser and all are at the same scale – close to the maximum resolution available. The left four images are of the upper dam and its lake, while those on the right are of the lower dam and its lake. The upper three images of each dam use the Normalized Difference Moisture Index NDMI – that basically highlights any moisture in the otherwise barren landscape. The bottom picture is the same view as the one immediately above, except that it displays “true colors”. On the left in the top picture, on 10/01/2023 there was some water backed up behind the dam, perhaps 2 m deep at the dam wall given that most of the upstream face is still dry. The second picture, on 02/09/2023 shortly before Storm Daniel shows essentially zero moisture behind the dam, except there is a tiny blue streak in the bottom of the bright yellow area that is too small to be resolved at the magnification shown here. The blue areas below the dam are well watered orchards and fields – not standing water. The dam is visible in both of the above pictures. The third picture, from 12/09/2023 immediately after Storm Daniel shows the Wadi Derna has been scraped clean of any sign of a dam or the well watered agricultural area below the dam save the blue area off to the side. Inspection of the area just downstream from the pictures here in the before and after show the complete obliteration of farms and vegetation together with the road to a height of 20+ meters above the bottom of the wadi. A little further upstream – a bit closer to the dam, the landscape has been scraped up to a height of 38 m! above the wadi bottom, where the width of the wadi is approximately 200 m across. The height of this point is ~215 m above sea level (at least 10 m higher than the top of the dam!).
A similar story can be constructed for the pictures of the lower dam in the right column. The dams were minor inconveniences to the flow of the total volume of the storm water.
The Wadi Derna drains a large and relatively barren plateau with some of the weirdest landforms I have seen, and could possibly be organized so it receives large volumes of water from a number of subsidiary drainages at the same time. Or, more likely, the insanely hot Mediterranean air was supersaturated with water, and the storm dynamics led to rapid cooling that squeezed all of the water out over a very short period of time….. And the barren plateau lacked soil and vegetation to slow the flow of the water once it hit the ground, and simply demonstrated what can happen when the Earth System has too much energy to dissipate all at once in the form of climate catastrophes.
Consequently….
Our planet is progressively becoming uninhabitable!
Earth beyond six of nine planetary boundaries
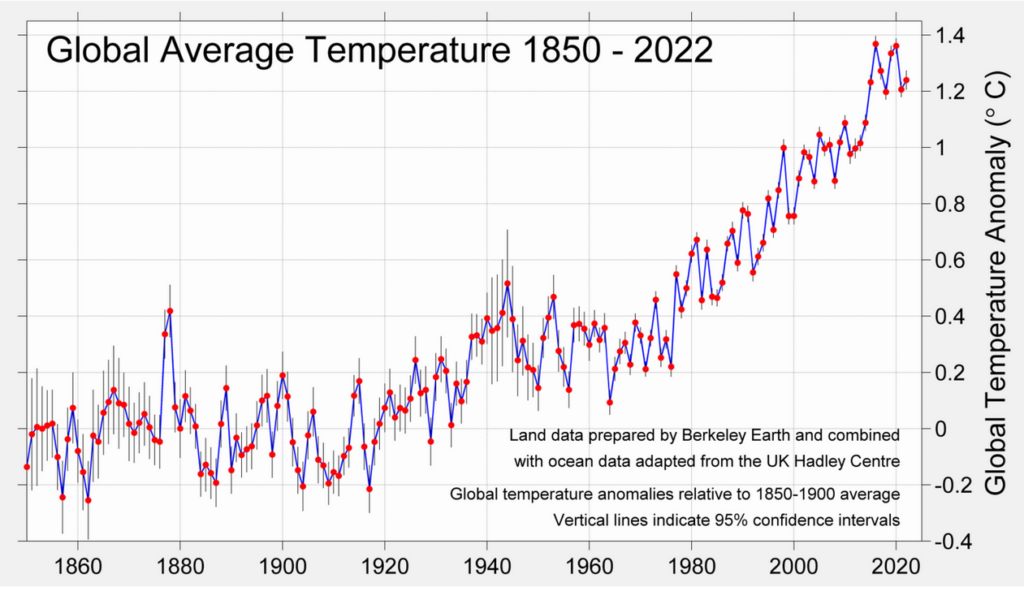
We’ve already breached 1.5 °C above preindustrial global temperatures and worse to come is already in the pipeline
Record high temperatures & reduced temperatures between polar and ‘temperate’ zones lead to crazy, weak and chaotic jet streams; in turn allowing stalled extreme heat domes, droughts and wildfires; lethally moist air masses, biblical flooding, and catastrophic storms.
OUR GOVERNMENTS ARE STILL PROMOTING AND SUBSIDIZING FOSSIL FUEL BURNING!
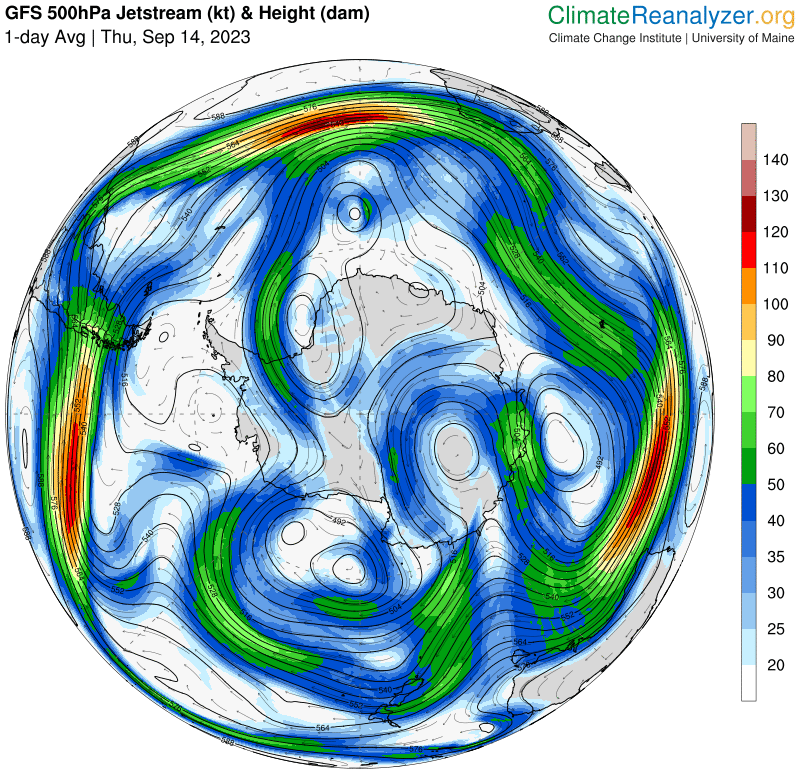
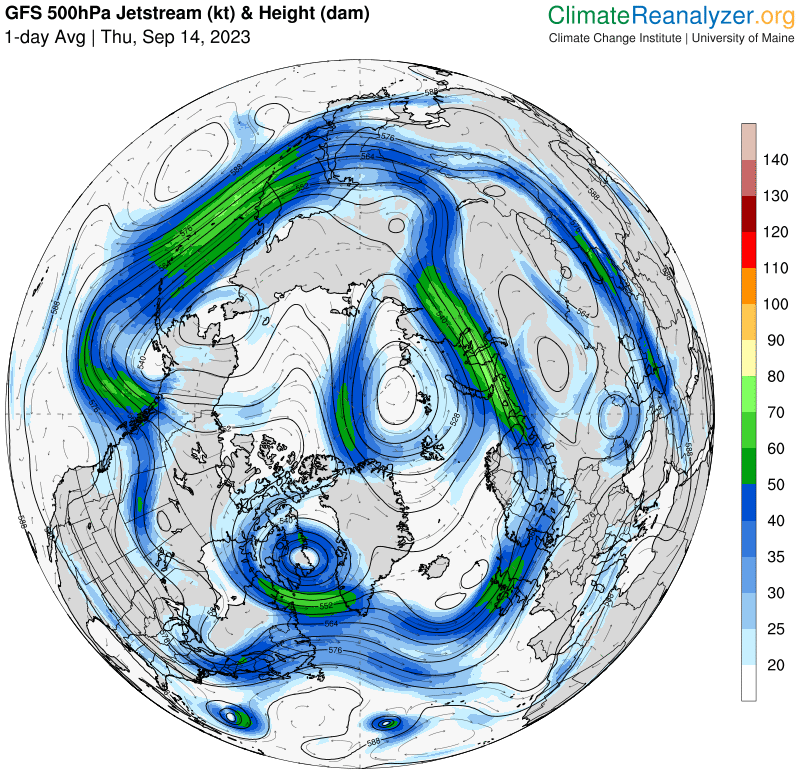
https://climatereanalyzer.org/wx/todays-weather/?var_id=ws500-gph&ortho=5&wt=1
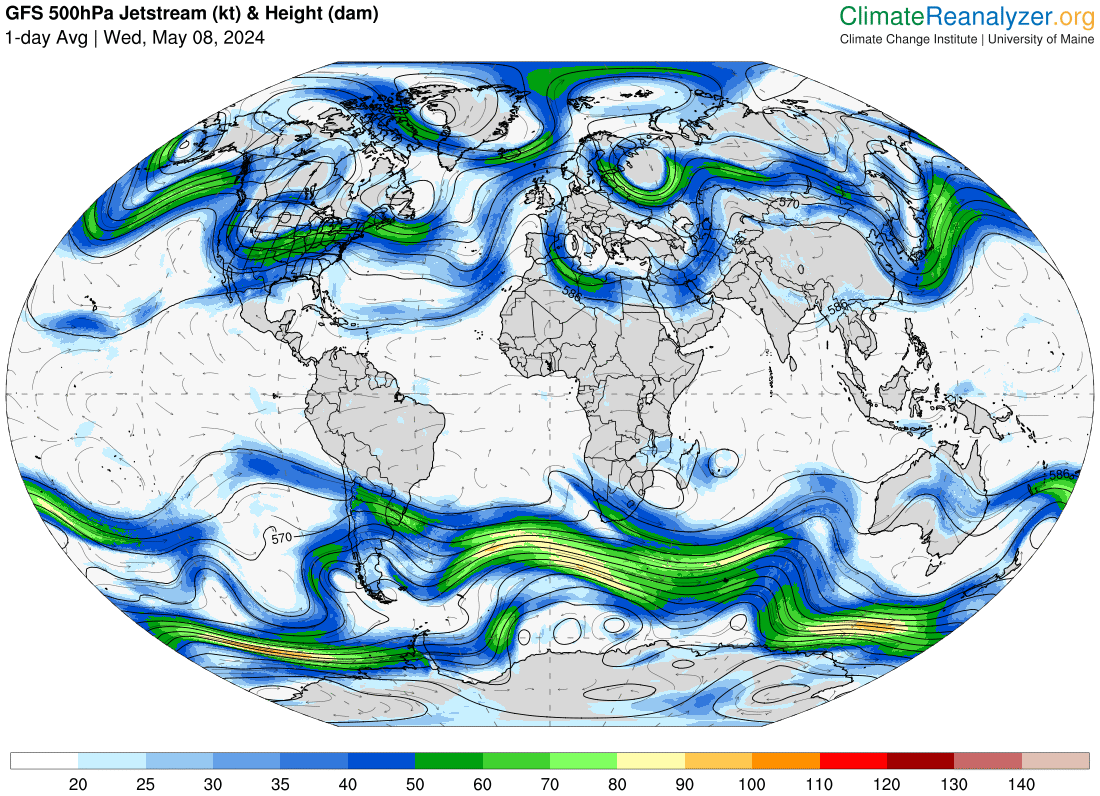
South America mid Sept. — What about Australia this summer?
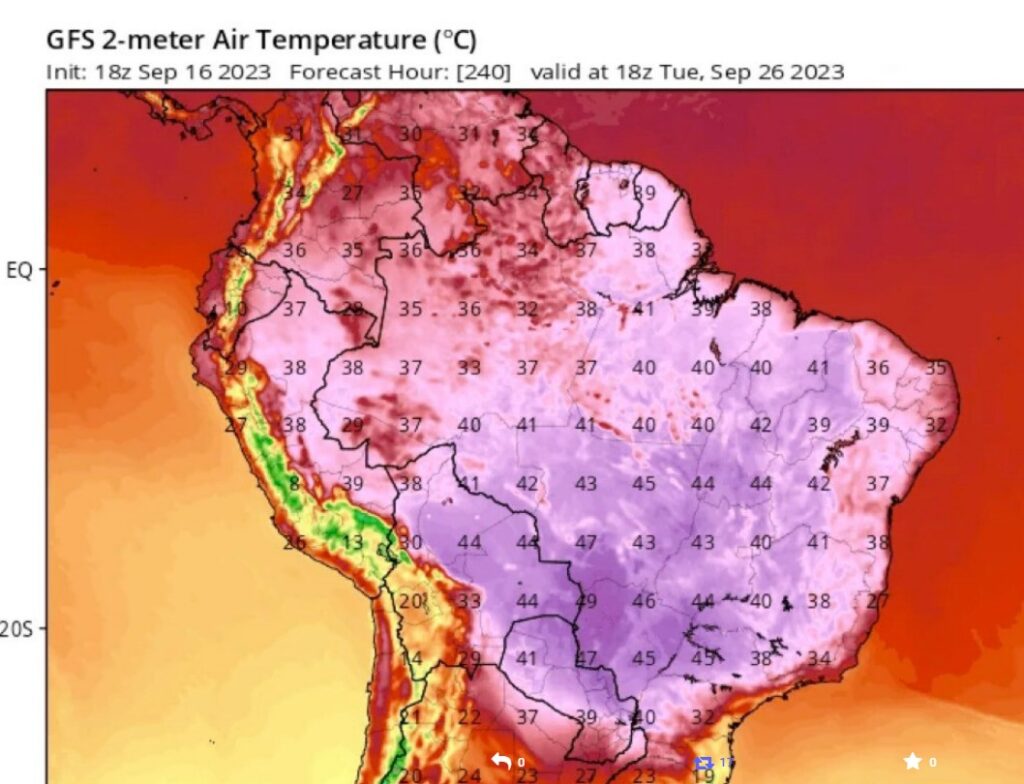
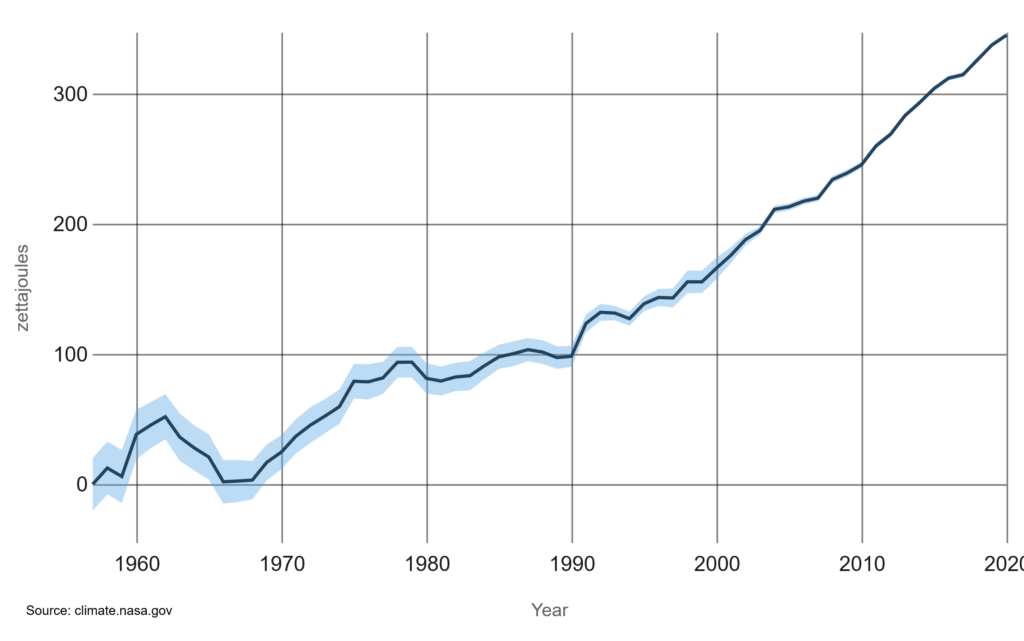
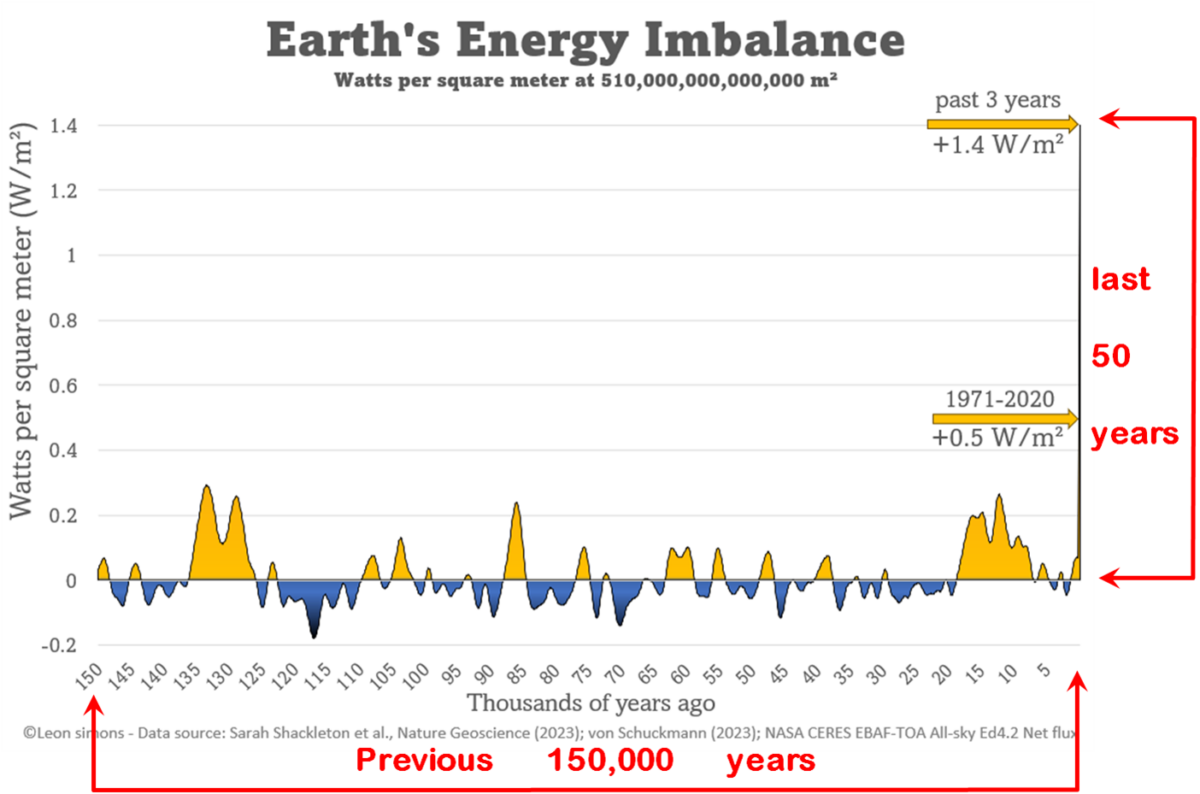
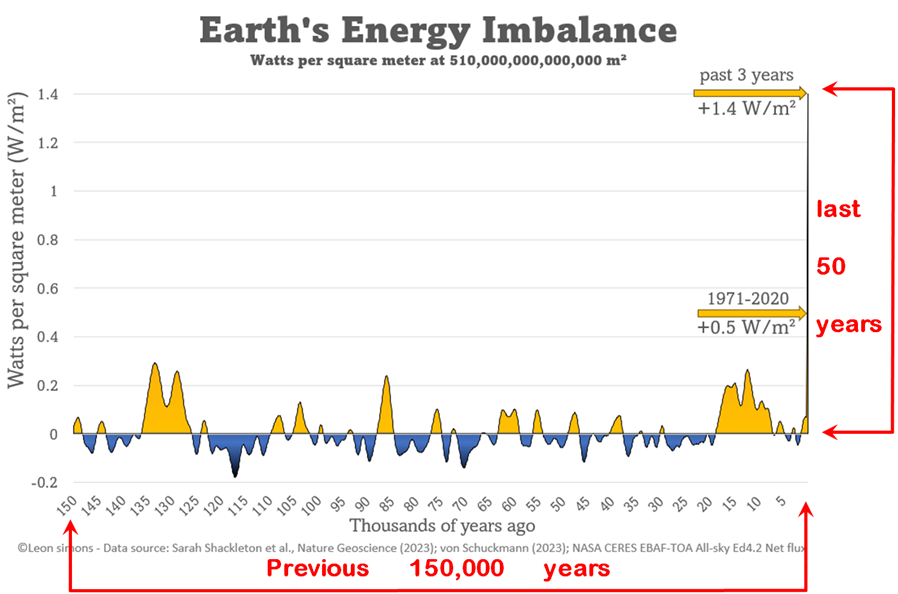
Earth’s energy imbalance (solar radiant energy in – earth radiant energy out) = energy heating planet Earth.
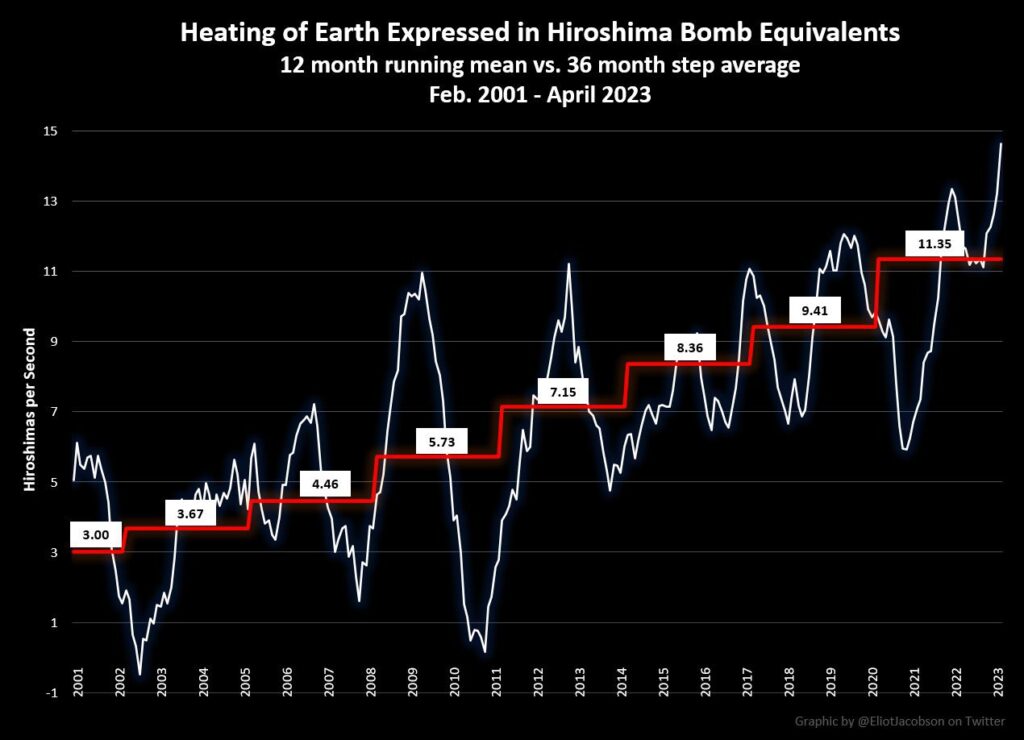
Leon Simons [Mission: To understand & protect the home planet. Innovator, climate researcher, social entrepreneur. Board member Club of Rome NL], who works outside the ‘reticence’ imposed by the usual academic and institutional employers considers the significance of recent reports on the Earth’s energy imbalance. Note: Simons is a coauthor on at least two peer reviewed scientific reports in this area.
Simons puts the previous graphs in a geological context based on Shackleton et al’s reconstruction of variations of Earth’s energy balance determined from measurements of Oxygen isotope ratios in sediment cores from the seabeds.
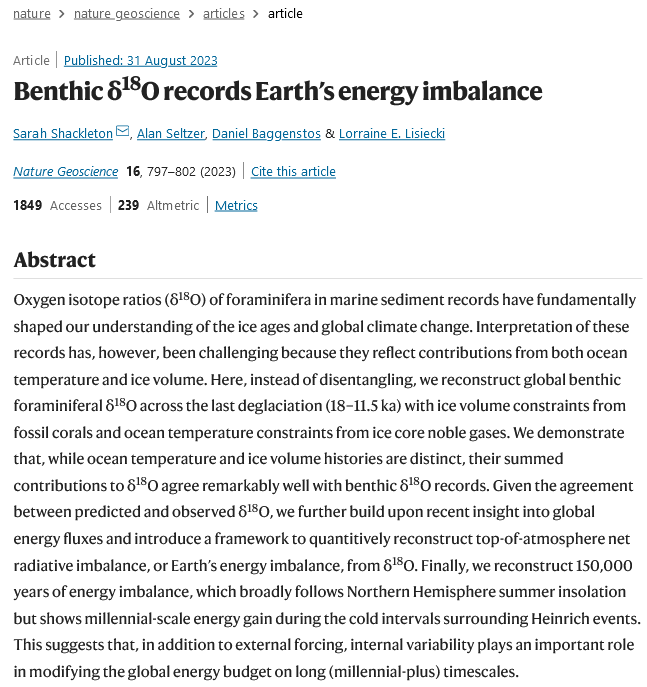
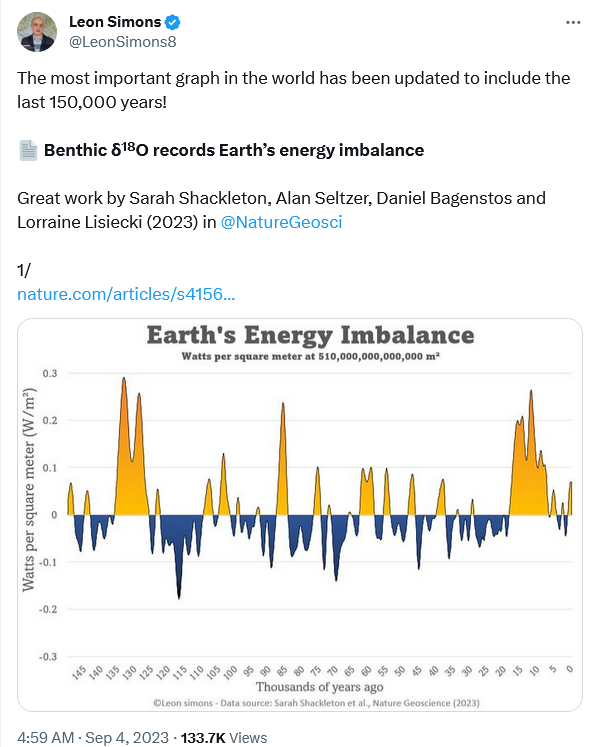
The thread from https://twitter.com/LeonSimons8/status/1698413266421096893 explains in some detail how the following graph was inferred and extrapolated from the above. At first I found it difficult to make sense of this graph until I grasped that the vertical line defining the right-hand side of the graph was data, comparing the imbalance observed directly over the last 50 years, with the variation recorded over the last 150,000[!] years, not the border….
Simons was one of the coauthors of the above paper.
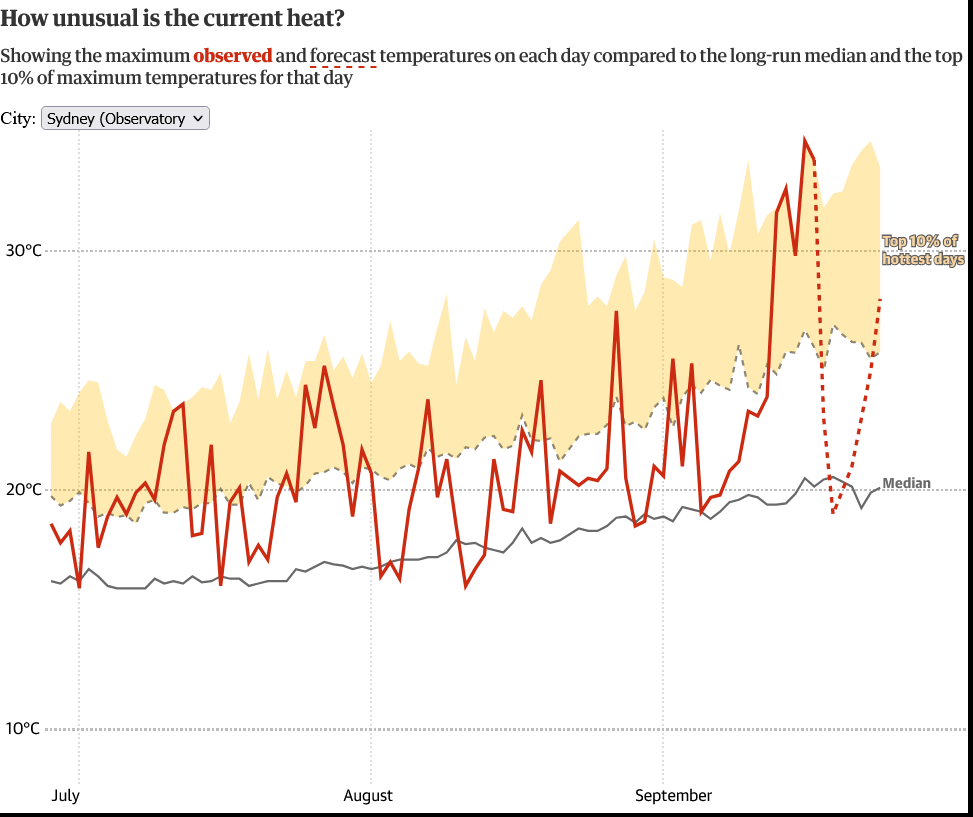
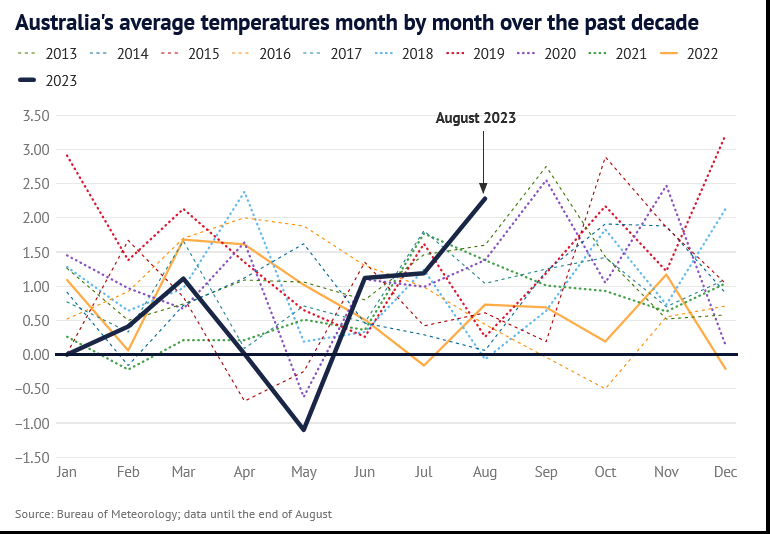
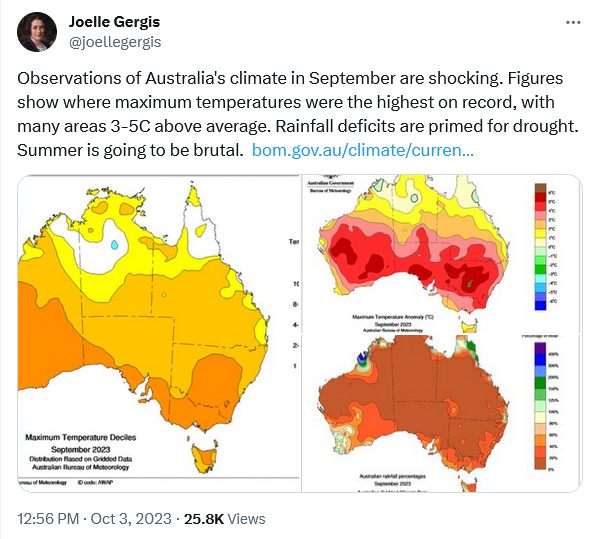
Australia hasn’t escaped
Costs & Consequences
Note that the following X-Tweet is limited to the United States – based on a Scientific American article. The rest of the world is suffering at least as much! Total costs are adjusted for inflation. It isn’t clear whether this also applies to the individual “billion dollar” events in the graph below.
Given the rapidly growing accumulation of excess heat in Earth’s oceans, if we cannot stop and reverse global warming within the next few years the inevitable result will be ecological and social collapses, within a few decades, and likely global extinction of most complex organisms — including humans within a century or so….
We must act before it is too late!
Featured Image
Based on an image by Leon Simons, https://twitter.com/LeonSimons8/status/1698410404693594417 depicting the urgent existential problem facing humanity today: If we cannot reverse the heating spike forming the right-hand border of the graph and force it below the neutral line forming the graph’s X axis within a few years, most complex life on Earth will be extinct in a century or so.