Australian MPs: Act now! Later may be too late!

Human activities are triggering self-reinforcing existential climate risks that are growing more lethal with time — our extinction is likely

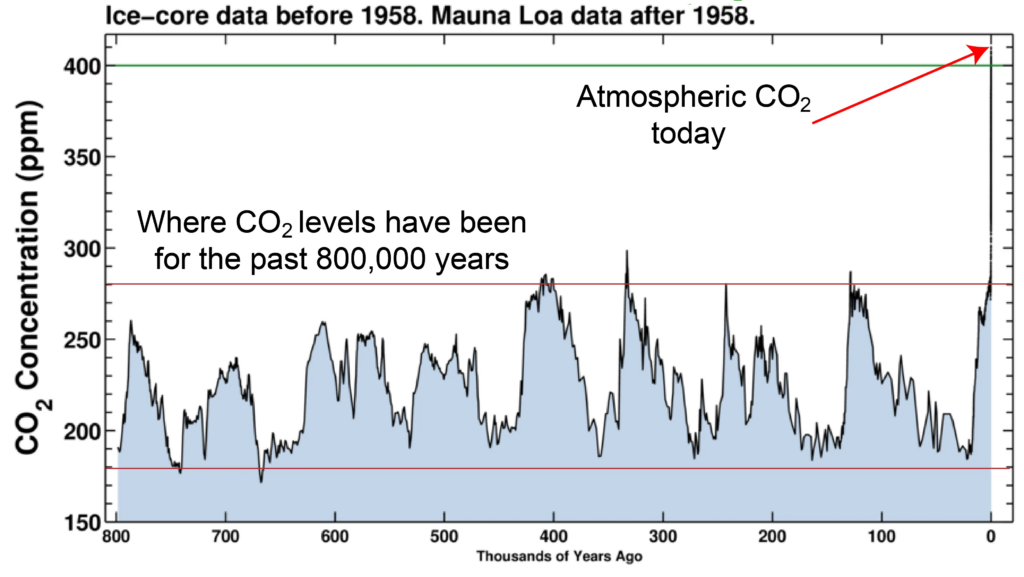
Over the last 200 years prodigious amounts of carbon-based fossil fuels (coal, oil, methane) have been burned to produce waste gases (mostly CO₂) and useful energy to drive the Industrial Revolution, our affluence, our toys, our technologies, our wars, and everything that has followed. The fossil carbon humans have extracted from the Earth and burned in an instant of geological time took our planet millions of years to accumulate and store in the geosphere (i.e., rocks & soil). In the same geological instant, the waste gases released from the burning are fundamentally changing Earth’s atmosphere (the air we breathe, etc…). Because of the physical properties of CO₂ molecules and other atmospheric emissions, this has trapped enough additional solar heat in the atmosphere to significantly raise average temperatures around the world. In turn, the added heat is already causing unprecedented climatic disasters. These existential climate risks will only become more frequent and catastrophic as temperatures continue to rise. (See CO2: Past, Present, & Future – one of many dozens of articles covering the same facts, and Climate apocalypse).

However, natural regulatory processes in the climate system have kept the environment stable enough for more than 800,000 years up until the 20th Century – enough time for humans to evolve and develop the social systems, agriculture, technology, and cultural riches we benefit from today.

Image modified from the Scripps Institution of Oceanography
Atmospheric CO2 levels (blue line) and temperature (red line) from year 1,000 to 1978. Data for CO2 from Vostok ice core, Law Dome ice core, and Mauna Loa air samples. Data for temperature from Vostok ice core. CO2 measured here is in parts per million (ppm = by weight), which is similar to ppmv (by volume).

As shown in the graphs above, the shock to the composition of the atmosphere caused by these human generated changes is increasingly disrupting natural climate regulation. If we do not quickly stop and repair the damage we have done to the atmosphere, then over the next few decades increasingly extreme, frequent and extensive climate changes and catastrophes will be causing more death and destruction to our societies than we have the capacity to repair. In turn, this climate collapse will lead to agricultural, economic and social collapse followed by mass die-offs and probable human extinction within a century or two.

Business as usual cannot cope with a global systems breakdown. Nor can uncoordinated individual actions. However, at least for a few more years before systems breakdown has progressed too far, we should still be able to assemble the technology and knowledge to avoid this doom. Beginning with primitive Victorian era steam-punk technologies backed by a very limited scientific understanding of climate and geophysics, humans took over 150 years to burn enough fossil fuel to accidentally cause the present crisis. Today we have now developed a deep and detailed scientific understanding of how the world works and vastly more powerful technologies. With will, leadership, and cooperation at international, national, state, and local areas we should be able to locate, diagnose and repair aspects of the climate system we have broken to re-stabilize it in a state we can live with.

However, to do this we will have to revolutionise many of our governments. We need to change them from their usual businesses of representing and working for the special interests of their donors, patrons and puppet masters (many of them associated with fossil fuel industries), to a new business of truly representing the needs of the citizens they supposedly represent – – especially in the face of the growing climate crisis.

If you are an MP, you need to join this revolution!

The factual scientific evidence of the consequence we face if we fail to stop and reverse global warming is overwhelming. However, I recognize that a life in politics where almost everything can be ‘negotiated’ does not prepare most politicians to understand the difference between responding to non-negotiable facts of physical reality and the business-as-usual of getting elected/re-elected and trading influence.

In the remainder of this work I present some of the overwhelming evidence of the dangers we face from an increasingly destabilised climate system driven by unrestrained global warming, and why our governments must change and act if we are to have any hope of surviving the existential global crisis this is causing. Because this evidence is based on scientific laws developed over some 400 years of testing and practical use, it is totally independent of whatever people might want to ‘believe’ now about how the world works

Laws of physics, geology, chemistry and biology

The scientific laws of physics and chemistry describe how the universe we live in works, irrespective of anything we humans might want to believe. Because atoms and molecules work the way they do, burning carbon releases ‘greenhouse’ (i.e., heat trapping) gases into the atmosphere. Because the increased concentration of these gases in the atmosphere traps reduces the amount of solar energy leaving our planet, the world is growing warmer.

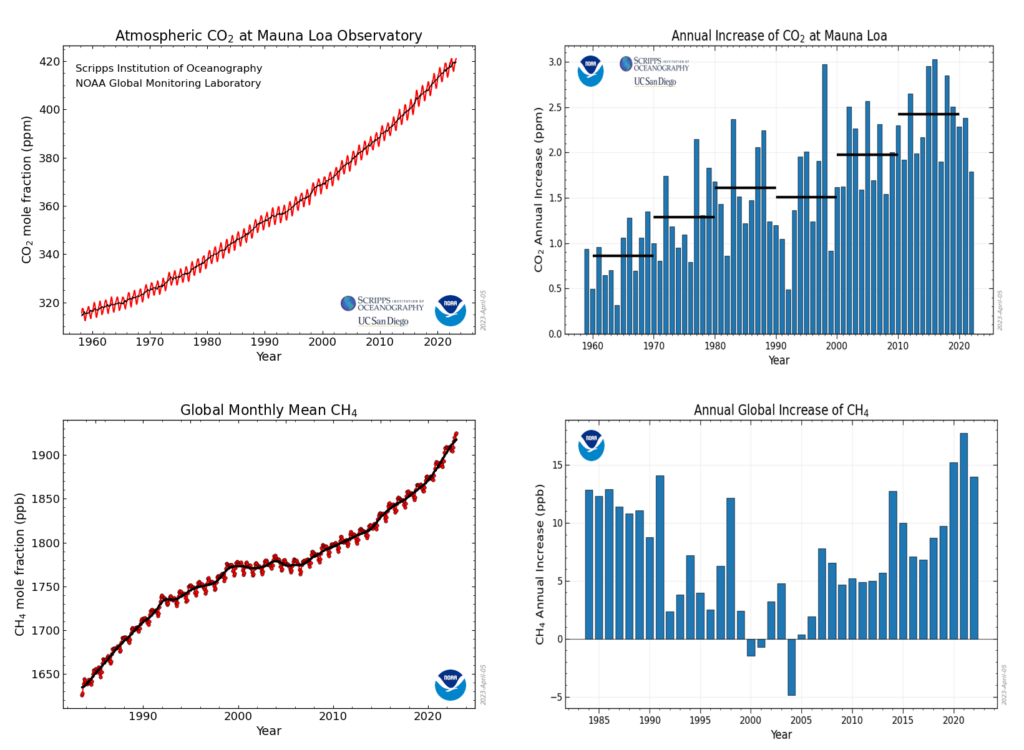
The US National Oceanic and Atmospheric Administration‘s (NOAA) Mauna Loa observatory’s records show the longest available continuous series of meticulous(!) measurements of important greenhouse gases. Variation in the two most important gases are shown below. The amount of these gases in the atmosphere increased every year since the recording began (except for methane which showed slight decreases in three out of 5 years beginning in 2000). More importantly, the rate of CO₂ increase has also increased in 5 of the 6 decades in the record (i.e., it’s getting worse even faster now than it was earlier!). These kinds of graphs are based on many discrete observations taken every day for many years at particular locations (in this case Mauna Loa, Hawaii) that are replicated by similar observations from other stable locations around the world (e.g., Cape Grim, Tasmania – see also CSIRO Atmospheric Composition and Chemistry).

NOAA Carbon Cycle Greenhouse Gases / Trends in CO₂ (carbon dioxide) / Trends in CH₄ (methane). The average amounts of gas are plotted (red dots) on a monthly basis. The average increase in the amounts of gas are plotted yearly.  Source gml.noaa.gov.

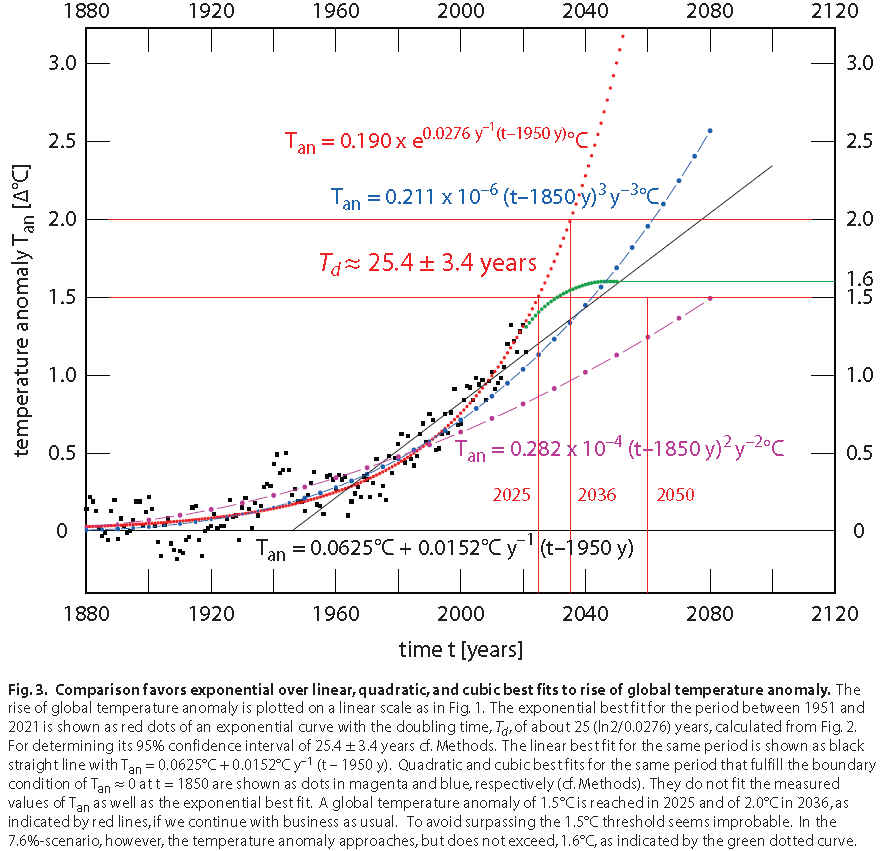
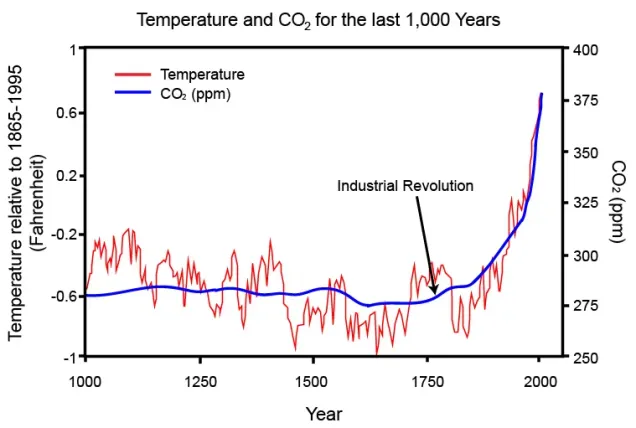
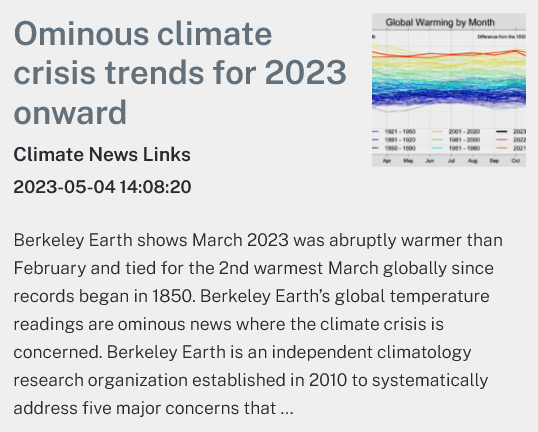
Greenhouse gases in the atmosphere act as a thermal blanket causing the Earth’s temperature to rise by reducing the amount of solar heat lost to space — same heat in, less heat out: inevitably everything covered by the blanket gets warmer. Just how much warmer is measured by the ‘temperature anomaly‘.

It should be no surprise that dumping millions of years worth of carbon accumulation into the atmosphere as greenhouse gases at an accelerating rate over 200 years or so has significantly affected global temperatures.

Berkeley Earth’s Global Temperature Report for 2022 – Posted on by Robert Rohde.
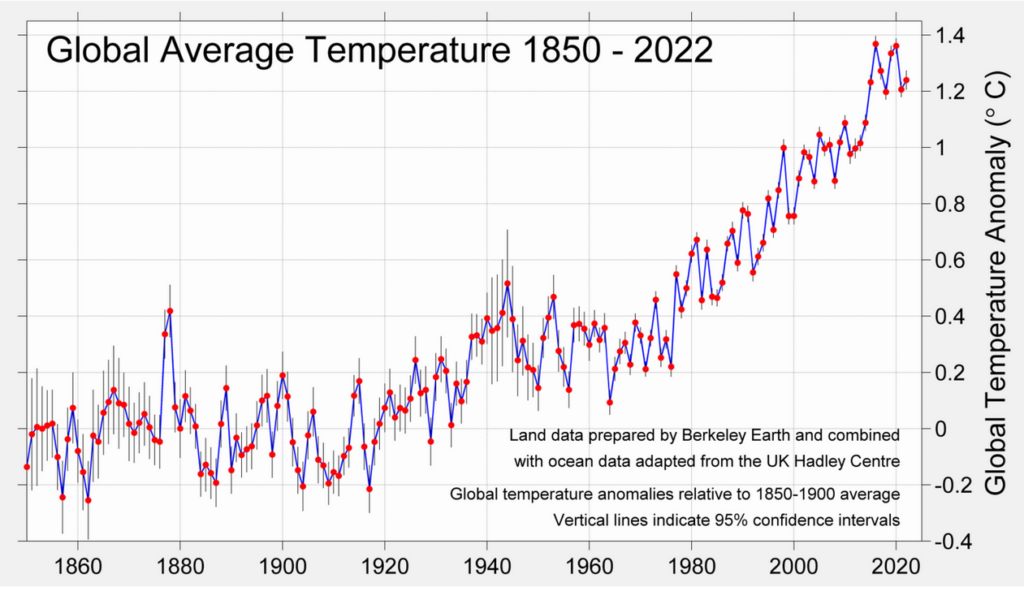
The global mean temperature in 2022 is estimated to have been 1.24 °C (2.24 °F) above the average temperature from 1850-1900, a period often used as a pre-industrial baseline for global temperature targets. This is ~0.03 °C (~0.05 °F) warmer than in 2021. As a result, 2021 is nominally the fifth warmest year to have been directly observed, though the years 2015, 2017, 2018, 2021, and 2022 all cluster closely together relative to their uncertainty estimates. In particular 2022 and 2015 are essentially tied, and 2022 could just as easily be regarded as the 6th warmest year. This global mean temperature in 2022 is equivalent to 0.91 °C (1.64 °F) above the 1951-1980 average, which is often used as a reference period for comparing global climate analyses. The last eight years stand out as the eight warmest years to have been directly observed. (Note: Berkeley Earth’s methodologies and their differences from other groups providing similar global temperature records are described here.)

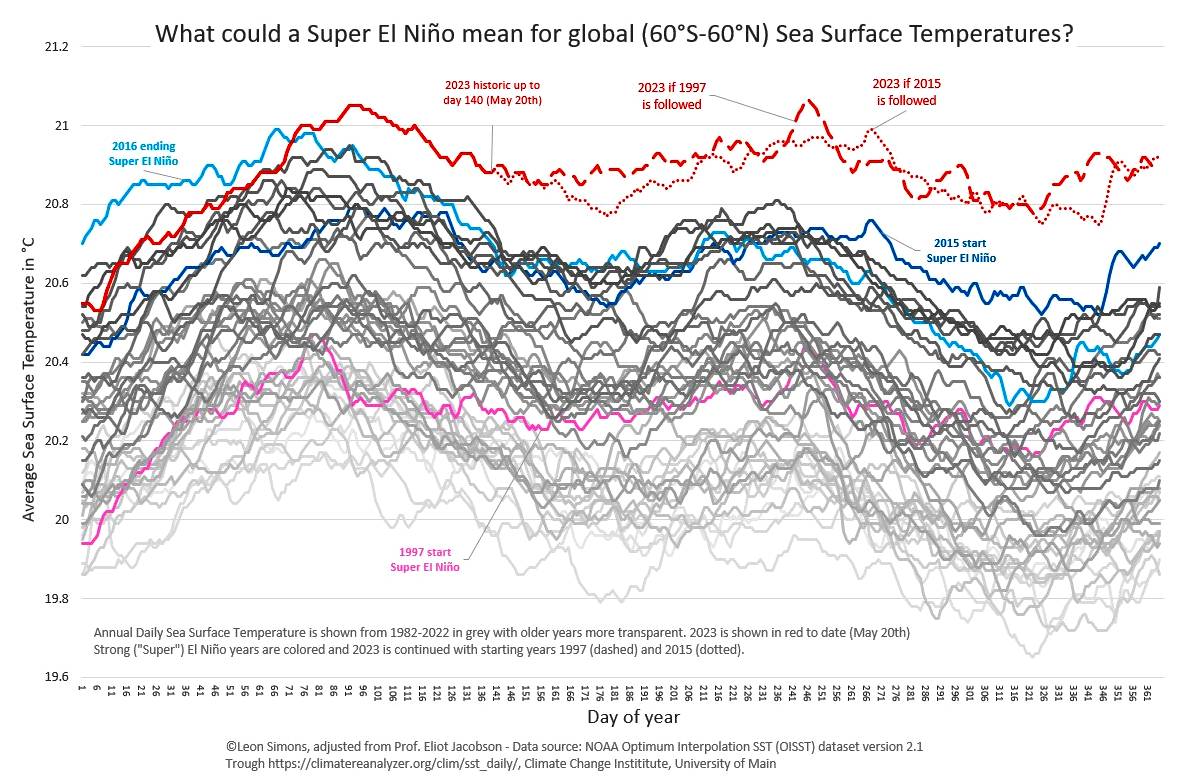
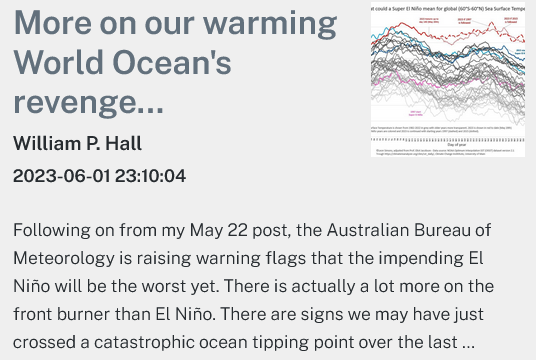
Around ninety percent of the excess heat Earth absorbs is held in the oceans, and water in its three forms (gas, liquid and ice) is the main transporter for distributing that energy around the planet.

OCEAN HEAT CONTENT CHANGES SINCE 1955 (NOAA)
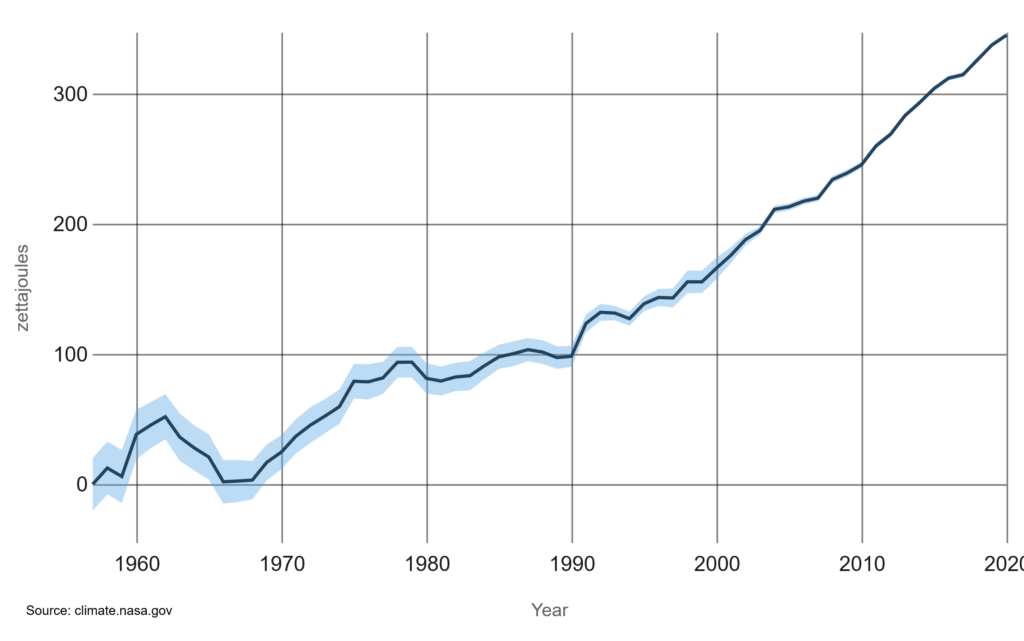
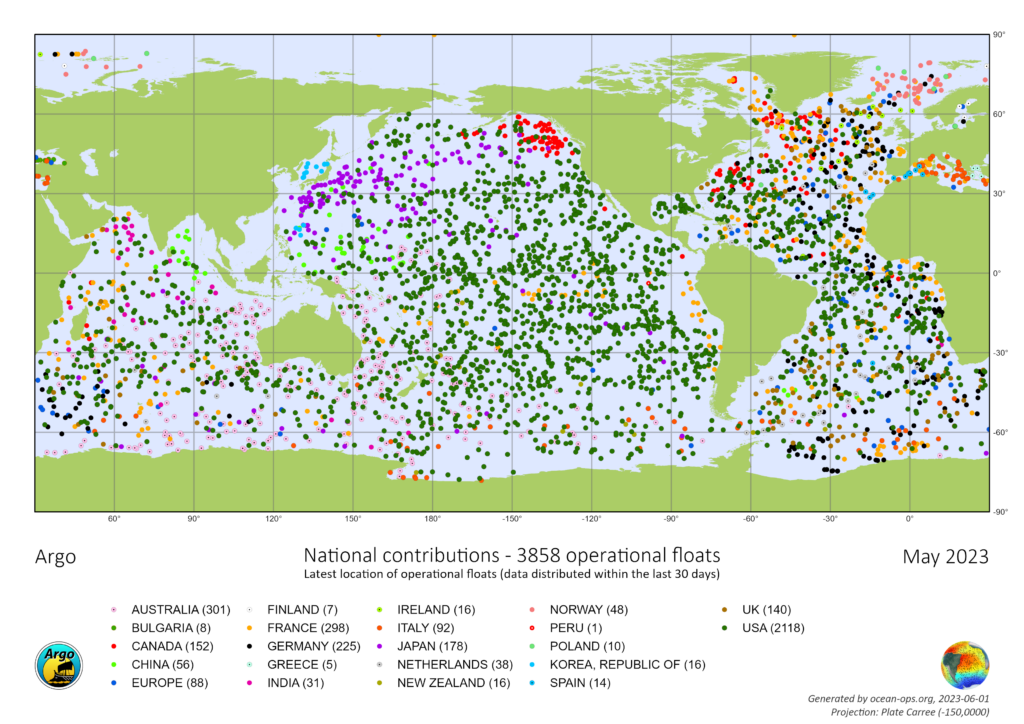
Data source: Observations from various ocean measurement devices, including conductivity-temperature-depth instruments (CTDs), Argo profiling floats, and eXpendable BathyThermographs (XBTs). Credit: NOAA/NCEI World Ocean Database. A more detailed graph including additional measurements from instrumented mooring arrays, and ice-tethered profilers (ITPs) covers the period 1992 – 2022. Credit NASA ECCO. Covering more than 70% of Earth’s surface, our global ocean has a very high heat capacity. It has absorbed 90% of the warming that has occurred in recent decades due to increasing greenhouse gases, and the top few meters of the ocean store as much heat as Earth’s entire atmosphere.
Note: If you want to grasp how many and what kinds of precision measurements – cross-checked across a variety of measurement platforms go into constructing these graphs, I suggest taking the time to go through one of ECCO’s presentations: ECCO: Integrating Ocean and Water.

Water (= H₂O) is a major component in the climate system and the main carrier of energy driving weather and climate change.

Each of water’s three physical states: water vapour (=gas), liquid water, and frozen water (=ice), together with transitions between the three states, all play important roles in the absorption, storage, transport, and release of heat around the planet. In its own right water vapour is also the most important and variable greenhouse gas.

Of all the natural materials forming the outer layers of the Earth, water has the second highest heat capacity of any known chemical compound. A lot of energy needs to be absorbed or released to warm or cool a quantity of water by even one degree — the amount of heat needed to raise the temperature of 1 gm water by 1 °C at standard pressure and temperature has its own name, the calorie. (An old unit of measure, but the easiest to follow here.) This same amount of heat is released when the 1 gm cools by 1°. To raise the temperature of 1.3 sextillion litres just by 1° of the world’s oceans takes the absorption of a humongous amount of heat!

Water (Hydrosphere) and Air (Atmosphere)

Water in the world Ocean

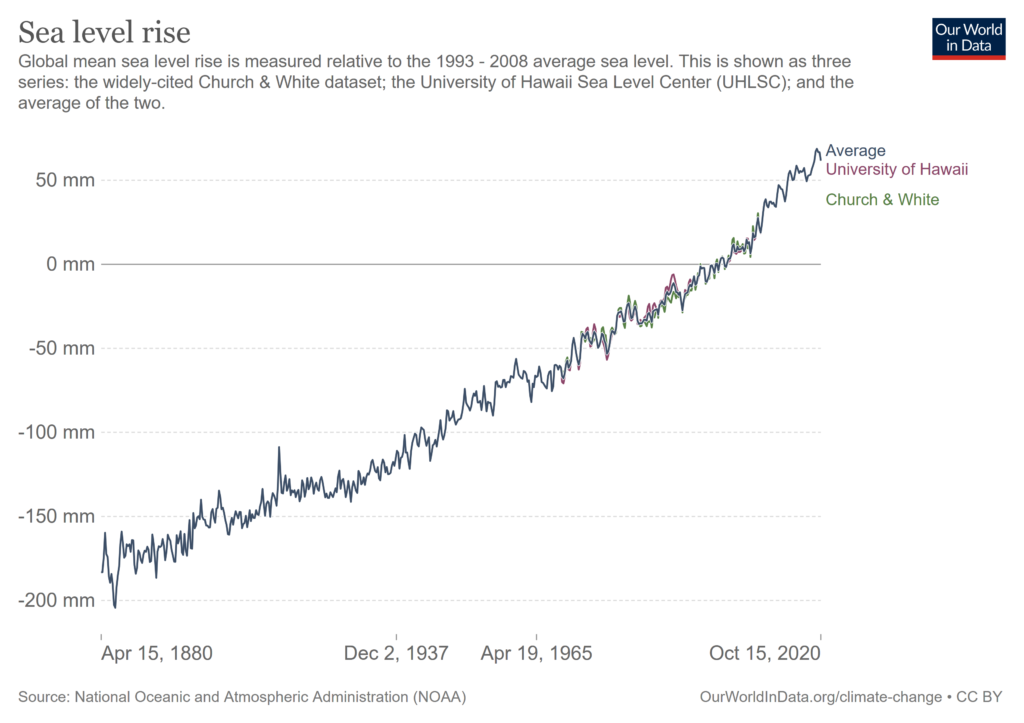
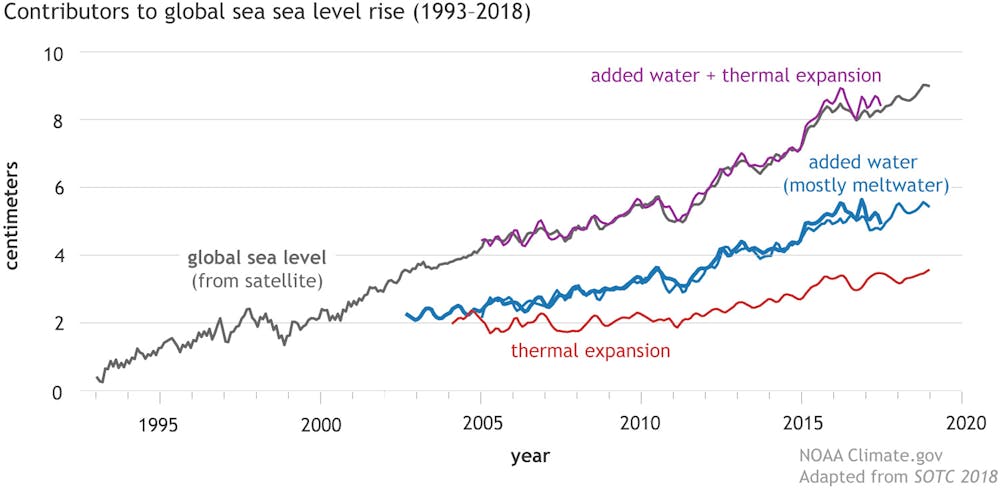
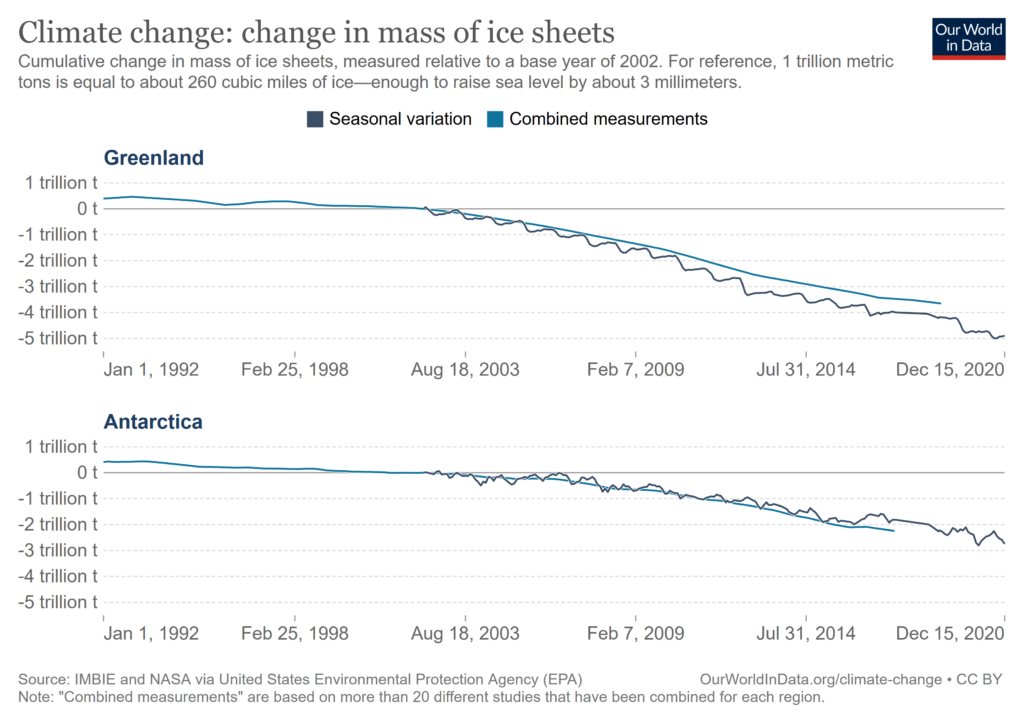
At temperatures above 4 °C, water expands as it warms. In other words, a parcel of water composed of a given number of molecules occupying space expands in volume as it warms from 4 °C to boiling. Thus, as the ocean warms, sea levels rise. Water running off the land from melting glaciers and ice sheets causes sea levels to rise further and faster.

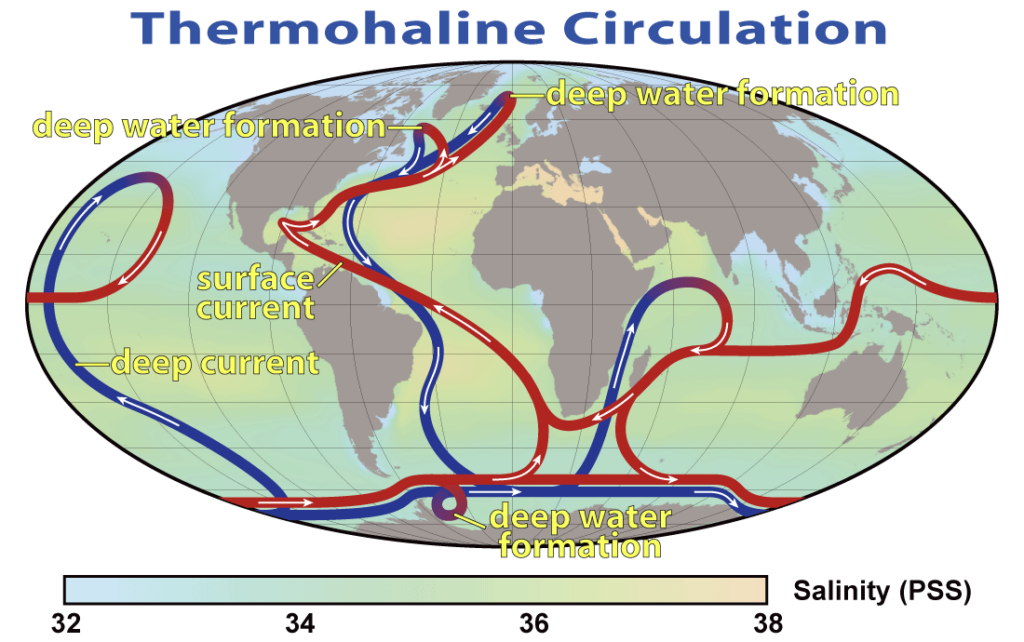
Warmer waters lying over cooler waters of the same salt content tend not to mix. However, as warm salt water evaporates, salt is left behind, making the remaining surface water denser, until it becomes heavier than cooler water below, allowing the warm water to sink and mix with the cooler water. This helps to suck in ocean currents to replace parcels of the cooling saltier water as they become denser and sink into the depths.

Thus, ocean currents are important engines for transporting heat around the globe.

Water in the atmosphere

Boiling or evaporating 1 gm of liquid water to gas (i.e., invisible steam) at one atmosphere of pressure takes approximately 540 calories of energy (= heat of vaporisation/evaporation)! Similarly, when H₂O gas condenses to form visible steam (i.e., a mist of liquid water) the same energy of vaporisation is released as heat.

When liquid water freezes to form solid ice it releases ~80 calories/gm, while 80 calories of energy needs to be extracted from the surrounding environment to freeze 1 gm of liquid water to ice.

The gas laws discovered in the 1800s through practical experience with the thermodynamics of steam and internal combustion engines govern the relationships between temperature, volume, and pressure of gases. As heat energy warms a parcel of gas at a standard pressure, the absorbed energy causes the gas molecules comprising the parcel to move faster – resulting in increased volume (lowering the density of the parcel compared to surrounding parcels that have not changed in temperature). Or, vice versa increasing pressure will cause the gas parcel to heat up. Similarly, cooling gas will shrink in volume (i.e., become more dense) as its temperature decreases, or warming gas will increase its volume becoming less dense as it is heated. This is why parcels of warm air tend to rise in generally cooler air and vice versa.

Finally, another set of laws describes the solubility of water vapour in Earth’s atmosphere, and the solubility of the various gases forming the atmosphere in water. A parcel carrying the maximum concentration of a dissolved material is said to be ‘saturated’. Normally any excess over the point of saturation is precipitated out of the solution. Where precipitation of water vapour in the atmosphere is concerned, the precipitated water is called dew (if it collects on a surface), mist (if the droplets are small enough to remain floating in the atmosphere), rain (if droplets are large enough to fall to the ground) or snow (if it is cold enough for the precipitation of solid water). Hail is precipitated as liquid droplets that coalesce and freeze on the way to the ground. Basically, the capacity for the atmosphere to carry water as dissolved water vapour and the rate at which the vapour evaporates from the liquid increases substantially with temperature.

Note that the process of evaporation absorbs a lot of energy (i.e., the vapour stores the energy that drove the evaporation as latent heat) which is released as sensible heat when the dissolved vapour condenses and precipitates. Warm air can hold a lot of water vapour while cold air can only hold a little vapour. Thus a warm air mass is often able to suck moisture out of vegetation and soils, but as that mass rises in elevation and cools a temperature may be reached where the air is saturated (this is called the ‘dew point‘) and possibly massive amounts of water are precipitated as rain or snow together with the release of huge amounts of latent heat as sensible heat causing the air mass to rise still higher (e.g., into towering anvil topped cumulonimbus clouds). The rising air is liable to suck in high speed winds and possibly even form small and large hail, cyclones, and tornadoes. The higher the temperature of the air mass is when the dew point is reached, the more precipitation, heat and wind is generated.

As global warming increases baseline and average temperatures around the world, the amount of energy contained in parcels of water vapour increases, and thus increases the total amount of energy available to drive extreme weather events.

Water on the land and in the biosphere

Liquid water is a powerful solvent for all kinds of minerals and flows downhill wherever it can. Flowing water is relatively dense, and therefore an important agent for the transport of solid materials ranging from particles of sand to potentially huge boulders and even buildings. Consequently, standing and flowing waters are the major agents of dissolution, erosion and storm damage: especially when combined with storm-force winds.

All living things on Earth are partially comprised of water, with humans being about 60% water and even trees 50% water. The water in and around living things acts a) as a solvent and as a medium of transport for the dissolved gases required for photosynthesis (where this exists) and respiration; b) as a medium of transport for the ions, molecular nutrients and waste products of cellular metabolism and growth; c) as a structural element in the three-dimensional folding of proteins and other macromolecules; and d) as a structural element in the maintenance of hydraulic rigidity of the shapes of cells and vesicles, and even whole organisms. 

Every type of living thing requires the availability of a minimum amount of water of a minimum quality to survive. Conversely, too much water and/or water of the wrong quality (i.e., it may be transporting harmful substances as particles or in solution) or wrong temperature (i.e., the shapes and activities of proteins involved in metabolism unavoidably change with changing temperature) may also kill.

Air in the water

Atmospheric gases (e.g., nitrogen, oxygen, carbon dioxide) are more soluble in cold water than warm water. In other words, cold water can carry a lot more dissolved O₂ and CO₂ than warm water can.

CO₂ is relatively soluble in water because it readily forms carbonic acid. This is important for global warming because the oceans currently absorb about 30% of all global CO₂ emissions, thus slowing the rise of global temperatures due to the greenhouse effect. However, this is bad news for life on Planet Earth for three reasons: First, as the gas is increasingly absorbed into the water some of it turns into carbonic acid. This makes the water more acidic, dissolving calcium from shells and bones – contributing to the die off of plankton, corals, shellfish and bony fish. Secondly, given that CO₂ is the waste product of respiration it slows the respiration of all marine and aquatic organisms. Three, as water temperature rises CO₂ becomes substantially less soluble. This can be catastrophic for global warming because it acts like a time bomb. Rising temperatures drive significant amounts of CO₂ out of solution in the ocean, back into the atmosphere, where it acts as a positive feedback driving global temperatures still higher in a potentially vicious cycle.

O₂’s solubility in water is limited, but dissolved O₂ is critical to life for all complex organisms that respire water. This includes all aquatic or oceanic organisms: many bacteria, most protozoa, single-celled and multicellular algae (net O₂ producers by day, overnight they must extract O₂ at night for respiration) up to whole forests of giant kelp, giant squids, whale-sharks, and the largest whales. In the pre-industrial world O₂ levels in most waters were close to saturation. Any degree of warming beyond what species are adapted to live in reduces the amount of O₂ the water can carry. Species will begin dying when the O₂ levels fall below levels the different species have evolved to tolerate. For example, along the Southern California coast where I grew up, whole forests of giant kelp die off when the ocean temperature rises to around 23 °C. So do the myriad of other species living in those forests that may still be able to respire, because at some to many points in their lifecycles they required something the kelp provided. Other kelp forests around the world, and in Australia are also dying off, e.g., the once rich kelp forests of Tasmania – possibly even more comprehensively than they have in California (e.g., northern Tasmania).

And then there are the horrific die-off events in the rivers and lakes of Australia’s Murray-Darling region, where the combination of blistering heat combined with off-the-charts CO₂ levels is absolutely lethal to whole ecosystems. This year’s event even killed carp that can breathe air!

How will our Atmosphere, Hydro-/Cryo-sphere, Geosphere and Biosphere respond to global warming on the real Planet Earth?

Meteorology, climate science, earth systems science extend the basic laws of physics, chemistry and a little bit of biology into the real world. However, even a brief review of some of the basic laws of physics and chemistry above for water, oxygen, and CO₂ gives some hint of just how complex weather and climate change really are. Earth’s Climate System that generates weather and climate change in the world we live in is a complex dynamical system composed of probably hundreds of variables often interacting with one another in non-linear. Some of these interactions are poorly understood or even unrecognised even by the scientists studying them.

Even though the Earth System is absolutely and fundamentally governed by the physical laws of nature, trying to predict future weather and climate conditions is fraught with difficulties of two kinds. First, complex systems of many variables, where some of the variables have non-linear positive feedback relations with one another, often behave chaotically under some or even many conditions. (See also climate change feedback.) Second, is that some of the variables are probably still unknown to science or not well understood. Even the largest supercomputers in the world capable of performing more than 100 quadrillion calculations per second and working with millions of daily observations from around the world can only make usefully accurate weather predictions out to around 8 days before wandering off into random noise.

For these reasons, predicting the future trends of global warming with a high degree of accuracy and certainty is frankly impossible.  However, what is almost certain is that if we do not stop and reverse the process of global warming there will be major disruptions to all of these systems which will make much of the Earth uninhabitable for complex life.

How trustworthy are the sciences and the warnings?

The UN’s Intergovernmental Panel on Climate Change (IPCC) deals with the uncertainties by running large numbers of similar earth/climate system models (ensembles) with slightly varying inputs on supercomputers to forecast possible future trends and their likelihoods. These outputs are analysed statistically to determine frequent trends and the range of uncertainties around these trends. Thus, many believe that the models give us a relatively good idea of how changes in specific environmental variables are likely to change the climate.

Unfortunately, with regard to managing climate risks, the reality is that this approach is too conservative because:

  • It filters out some or all of the instances of chaotic extreme deviations from the likely results because these are usually considered to be consequences of “system breakdown” in what is assumed to be a bad model — even though system breaking ‘exponential blow-ups’ are to be expected in complex dynamical systems. In other words, the bad result where the model ‘breaks down’ may well be a realistically valid prediction of the model.
  • Most scientists agree that the RATE of climate change is increasing with time. However, the delays in knowledge flow between observation of reality and assessment and presentation of results mean that there is a lag built into the IPCC reports.  That is, the delays inherent in analysing and writing up the results, delays in conducting peer review and publishing the original research, conceiving and constructing and running the mathematical models based on those results to forecast the future, analysing and writing up the results of the modelling, delays in publishing these results; and then comes the added time cost to incorporate the published results in an IPCC Report. This IPCC process alone takes a minimum of 2-3 additional years of three drafts, two peer reviews, and a final sign-off by the political appointees of the 170 countries comprising the UN’s World Meteorological Organization. Thus, the years-old input data providing a baseline for the models’ predictions necessarily do not include the array of record-breaking temperature, greenhouse gas, and weather readings associated with the increasingly extreme weather events of the last few years.
  • Finally most IPCC scientists are associated with academic and research institutions funded by governments, where academic progress and promotions depend on not being too novel or controversial (i.e., exhibiting ‘scientific reticence‘). This leads to scientific self-censorship — downplaying alarming findings, reinforced by the need that IPCC Reports require political approvals by government appointees to be published.

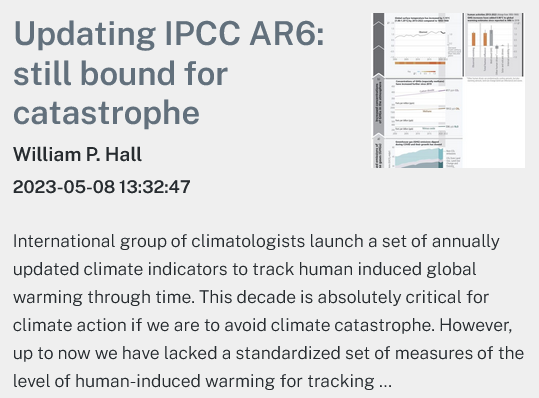
The following graphic is the IPCC’s own depiction of their authoring and review process.
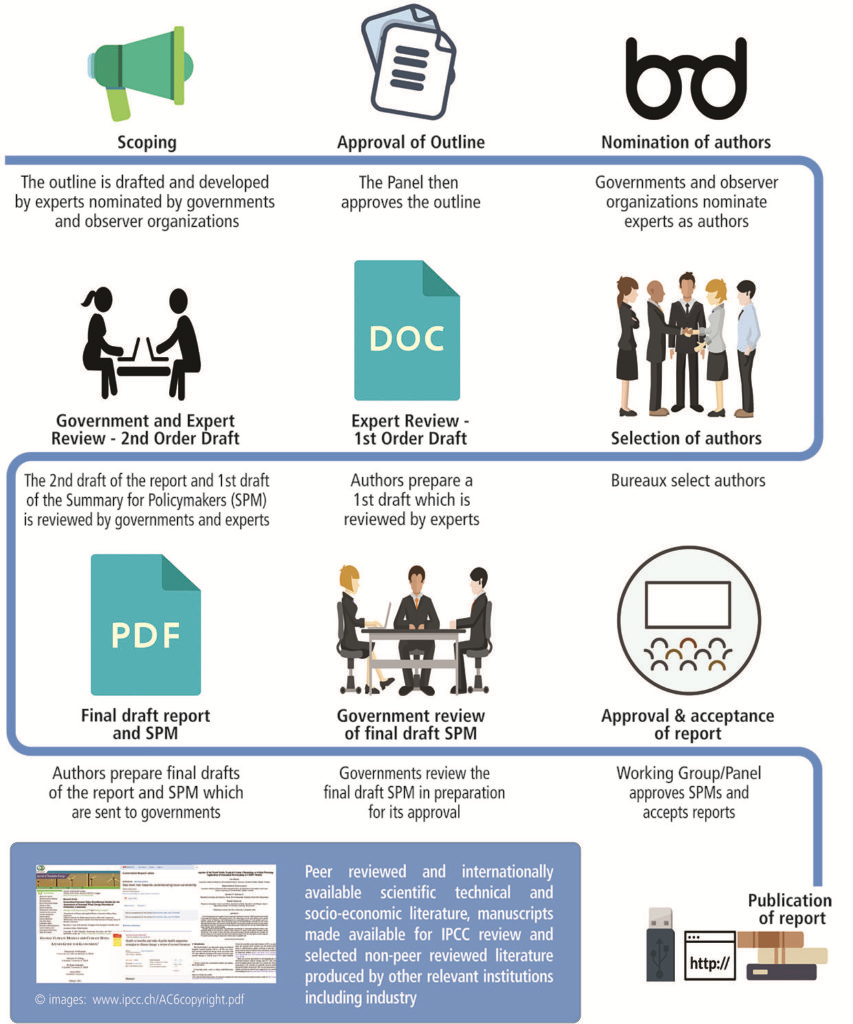
The graphic and a comprehensive description of IPCC’s writing and review processes are given in their document, Preparing Reports. In turn, even more detail on how each kind of document is prepared, reviewed and signed off is provided in the IPCC [Documentation] Procedures, according to the the Principles Governing IPCC Work that lay down the role, organisation and procedures of the IPCC. These guiding Principles establish comprehensiveness, objectivity, openness and transparency for all IPCC Work
.

Note, this and other issues with the IPCC’s predictions are examined in detail in my presentation: Some fundamental issues relating to the science underlying climate policy: The IPCC and COP26 couldn’t help but get it wrong.

Thus, when the formal IPCC reports publish their predictions for the future consequences: it follows that this is a gold-standard, scientifically correct but somewhat rose-tinted statement of the best possible outcomes we can hope for from the present state of the escalating climate emergency. The actual future is most likely to be worse, or even more worse. 

Given all of these factors, it is virtually impossible that the IPCC reports are in any way overstating the magnitude and dangers of the climate crisis.  Those who claim the IPCC reports are ‘alarmist’ are seriously misinformed or else aim to be deliberately misleading.

How do we know all of this?

There is a vast array of direct observational evidence from the real world (e.g., the graphs of increasing greenhouse gas concentrations and rising global temperatures presented above) showing that our global climate is already deteriorating at historically and even geologically unprecedented rates. A few recent observations sample this kind of evidence.

Identifying, analysing, and managing climate risks

Most climate scientists have backgrounds in mathematics, physics or geology where they are used to working with well behaved regular systems — not complex dynamical systems with potentially chaotic and unknown variables where the models are inherently fallible in their predictions of the future. Although the mathematical theory of chaos emerged from early attempts to model climate, few have any formal grounding in complex systems or chaos theory. Consequently, they tend to believe their models can predict the future with some degree of statistical accuracy, rather than accepting that models are good for explaining what can happen but not what will or won’t happen.

Scientists (including a few climate scientists) who continue to deny that current climate change is mainly due to human activity are often used to dealing with changes over long periods of time, where natural and well understood processes are more or less adequate to explain how climate has changed in the past.  Many of today’s deniers formed their opinions years ago (e.g. 1980s) when even climate specialists actively debated the extent and causes of climate change.  In people prone to denial, ‘confirmation bias’ then begins to reinforce conclusions, where data fitting their belief is eagerly accepted, but seemingly contradictory data is critically scrutinised and rejected. 

Over time, with the overwhelming additional data supporting unnaturally accelerated climate temperatures on land, air and sea, almost all genuine climate scientists have come to conclude that human activities are in fact changing the climate.  The holdouts are usually in those other disciplines that have a default assumption that natural processes always explain changes in climate.

And then, there are those who have totally unscientific reasons for denying that humans cause climate change.Following on my career as an evolutionary biologist (PhD Harvard 1973) with strong backgrounds in geology, physics, systems sciences (systems ecology, genetic systems, cybernetics), I was employed for 17 years as a knowledge management systems analyst and designer with what became Tenix and then Tenix Defence through the life-cycle of “Australia’s most successful naval surface combatant project – by far” – the ANZAC ship project. I worked very closely with the company’s engineering systems analysts and risk managers (often the same people did both). The ANZAC Project was so successful because the prime contract was performance-based rather than specifications based. We were contracted to deliver for a fixed price certain capabilities and reliabilities in service rather than meticulously detailed products.

Large defence systems – especially like warships and aircraft with their multitudes of subsystems, assemblies and piece parts, are complex dynamical systems that are inherently but unpredictably fallible due to unanticipated dynamics, human errors, or unpredictable failures of critical parts. It was the job of contract analysts, systems engineers, design engineers and knowledge managers (me), to work out a ship design and construction process that could be trusted to meet the customers’ requirements within the negotiated fixed price.

Failure Modes Effects and Criticality Analysis (FMECA)

The critical analytical tool in Tenix’s success, apparently unknown to climate science, is application of the Military Standard, Failure Modes Effects and Criticality Analysis (FMECA) within a risk analytical and management framework. Briefly, this involves (1) tabulating all conceivable failures and the potential consequence of the particular failure mode (i.e., its criticality) for every component of the system that might have a detrimental effect on the system’s safety or functionality, (2) preparing at least a matrix for every failure mode showing the approximate likelihood of failure, and (optionally) the likely consequences/costs to the system should the failure occur, and the costs to repair or mitigate the mode.

Applying FMECA to global warming

Should we ignore a risk because its consequences are so severe we fear accepting that it is real?

The following graphic plots an analytical matrix for the risk of human extinction from a failure to stop global warming at a safe global temperature for human survival. A serious analysis of this risk (that is unthinkable to many) demands examining the physical realities associated with each dimension of the matrix and looking for solutions to reduce consequences and likelihood of the risk happening, and to provide the maximum time possible to manage it; or alternatively, to entirely avoid the activities causing the risk. Unfortunately, given that the risk from global warming is associated with the project to power industrial, technological, and population growth by burning fossil fuels that began 150 years ago. Thus we have no choices but to live or die with the consequences arising from this project.

Slides 10 and 76 from Hall (2016). The angst of global warming – our species’ existential risk

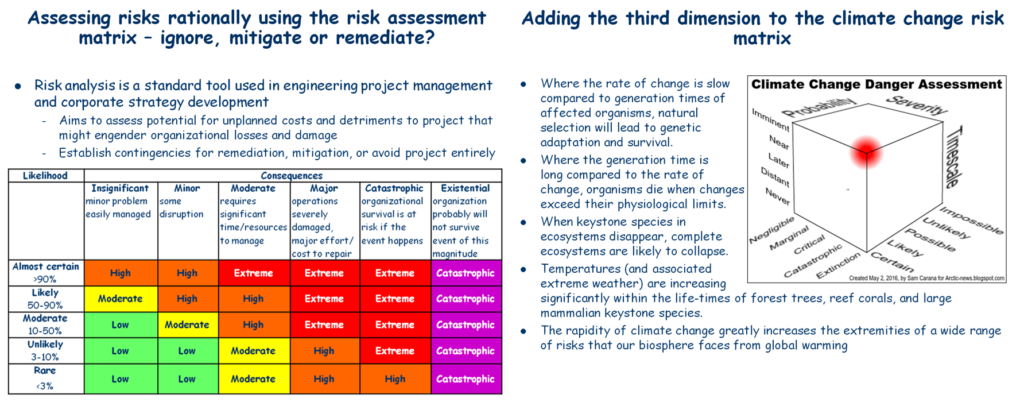
Our planning to manage the risk must consider the third dimension — TIME. How much time do we have to manage the risk if we are to avoid its consequences? The possible consequences of the risk are existential – i.e., extinction of human society as we know it or even the entire species. The probability is likely to be certain if we do not stop and reverse global warming. The timescale is imminent, i.e., within the expected lifespan of today’s children.

Should we heed the science and the warnings?

The Intergovernmental Panel on Climate Change was established by the United Nations to research and provide the “best” scientific advice available to governments of the world regarding the science, trends, and likely progress of climate change. The Panel’s staff is selected and overseen by all the member states of the World Meteorological Organization. The peer review is exhaustive and intensive – probably more so than for any other scientific endeavour ever.

For reasons I have detailed it would be virtually impossible for any formal publication of the IPCC to overstate the dangers represented by climate change. Where the IPCC says that even the current trends will be catastrophic if realised, I would say that they are ‘existential’: A word the IPCC rarely uses and never defines.

Most dictionaries (e.g., see OneLook Dictionary Search) only define the word in terms of ‘existentialism’ – a branch of philosophy. In discussion of the climate crisis, in the framework of global catastrophic risk, “an existential danger threatens the very existence of something” (ref. Macmillan Dictionary).

The Wikipedia article on Global Catastrophic Risk defines “existential” in these terms:

Existential risks are defined as “risks that threaten the destruction of humanity’s long-term potential.” The instantiation of an existential risk (an existential catastrophe) would either cause outright human extinction or irreversibly lock in a drastically inferior state of affairs. Existential risks are a subclass of global catastrophic risks, where the damage is not only global but also terminal and permanent, preventing recovery and thereby affecting both current and all future generations.Note: This discussion of definitions may seem to be highly pedantic. It isn’t. It is deadly serious. Humanity faces a serious risk of triggering a global mass extinction event akin to the End Permian event that was “Earth’s most severe known extinction event,[11][12] with the extinction of 57% of biological families, 83% of genera, 81% of marine species[13][14][15] and 70% of terrestrial vertebrate species.[16] It is the largest known mass extinction of insects.[17]If you are declaring a state of emergency, it does not help to describe the emergency in soothing terms.

Views expressed in this post are those of its author(s), not necessarily all Vote Climate One members.

More on our warming World Ocean’s revenge…

Following on from my May 22 post, the Australian Bureau of Meteorology is raising warning flags that the impending El Niño will be the worst yet.

There is actually a lot more on the front burner than El Niño. There are signs we may have just crossed a catastrophic ocean tipping point over the last three and a half months. The following thread of tweets and news items summarizes a very scary thread of observational data.

We may have broken Earth’s Thermohaline Circulation.

The data based on millions of satellite observations and hundreds of thousands of Argo Float profiles of ocean temperature, salinity and density suggests that the driver of major ocean currents distributing excess heat around the world has stopped working because it is choked with relatively hot and relatively fresh water.

In 2020 Argo collected 12,000 data profiles each month (400 a day) or around 436,500 profiles a year. Each profile provides for each increment of depth a a record of the variation in ocean temperatures, salinity, and pressure from 2,000 m deep to the surface, together with the precise global positioning coordinates where the probe surfaced.

In the past water flowing into the polar regions was quite salty because a lot of moisture evaporated from the surface in tropical and sub-tropical regions, leaving the salt behind to make the water more dense. However, because the water was hot the density was somewhat lowered due to thermal expansion it stayed on the surface because it floated over the surface of cooler but fresher water. As the salty water flowed into polar regions it cooled enough that even though it was being diluted by precipitation and runoff from melting snow and ice on the land, the cooling and increasingly diluted water become dense enough sink under the warm salty waters drawn towards the poles by the sinking polar waters. This circulation also carried oxygen into the depths and nutrients from the depths towards the surface in areas where deep water wells up to replace the surface water flowing towards the poles in tropical and temperate areas.

Wikipedia: Thermohaline circulation (THC) is a part of the large-scale ocean circulation that is driven by global density gradients created by surface heat and freshwater fluxes.

However, as global average temperatures rise and more heat is trapped in the ocean evaporation everywhere puts more moisture into the air that falls as rain in tropical and subtropical areas, diluting the warmer ocean surface waters. In polar and sub-polar areas the increased moisture greatly increasing the runoff from the land from rain and melting snow and ice, that further dilutes the increasingly diluted ocean surface water flowing into polar regions from tropical and subtropical areas.

The result is that the thermohaline conveyors driving the major ocean currents are probably being choked and possibly being completely stopped by masses of water that are too hot and dilute to sink. Even worse, the warm dilute water washing against the ice sheets and glaciers reaching the ocean melts ice at an increasing rate making the surface waters even fresher.

On 26 May, 2023 we are seeing an all-time low extent of sea ice since the satellite record began in 1979. http://kjpluck.github.io/seaice/

Denmark’s Polar Portal (below) shows the melting of the multi-year Arctic sea ice from its winter peak in June 2004 until now. [Click the picture to load the live site, scroll up to to see the “Sea Ice Thickness and Volume” title. Note the grey slider bar below the map. Click the “Animate Monthly” to load the animation — which will take some time to download the data. You may use the slider to scroll through the series of monthly maps, or you can control buttons below the slider to start and stop the animation or step back or forward one month at a time. The red color represents multi-year ice around 4 meters thick, lavender to blue ice is single year ice less than about 1.5 m thick.]

Note, there is an interesting but deadly physical twist here: As water temperature drops below 4 °C cold/freezing fresh water floats on top of warmer relatively salty water, and freezes-over in the winter at higher temperatures than saltier water. Paradoxically, floating ice and snow accumulating on the surface actually insulates the lower layer of warm salty water from further cooling, where the winter surface temperature may be 20-50 °C below freezing. However, the fronts of large glaciers flowing into the ocean may be grounded hundreds of meters below sea level or floating on even deeper warm water(!). This means they will still be melting rapidly from the bottom up even in the dead of winter when fresh water is freezing. The ice melt dilutes the polar oceans even more – so say nothing of raising sea levels that will, in turn, lead to the floating of glacier fronts, exposing even more areas to melting.

What is happening as I write this warning?

If you follow the threads and commentary attached to these tweets here, the links show what was happening a week ago.

The following Guardian articles highlight the existential risk we are facing.

Melting ice around Antarctica could cause a 40% slowdown of a global deep ocean current by 2050 if current greenhouse gas emissions continue, according to researchers. Photograph: Anadolu Agency/Getty Images / from the article

Graham Redfearn – 30/03/2023 in The Guardian

Melting Antarctic ice predicted to cause rapid slowdown of deep ocean current by 2050

New research by Australian scientists suggests 40% slowdown in just three decades could alter world’s climate for centuries.

[Actually, the data presented here suggests that as of the last three months or so this stoppage has already begun!]

Melting ice around Antarctica will cause a rapid slowdown of a major global deep ocean current by 2050 that could alter the world’s climate for centuries and accelerate sea level rise, according to scientists behind new research.

The research suggests if greenhouse gas emissions continue at today’s levels, the current in the deepest parts of the ocean could slow down by 40% in only three decades.

This, the scientists said, could generate a cascade of impacts that could push up sea levels, alter weather patterns and starve marine life of a vital source of nutrients.

Read the complete article….
Antarctica’s Larsen B ice shelf. There has never been less ice around the continent than there was last week. Photograph: staphy/Getty Images/iStockphoto / from the article

Graham Redfearn – 05/03/2023 in The Guardian

‘Everyone should be concerned’: Antarctic sea ice reaches lowest levels ever recorded

With the continent holding enough ice to raise sea levels by many metres if it was to melt, polar scientists are scrambling for answers.

For 44 years, satellites have helped scientists track how much ice is floating on the ocean around Antarctica’s 18,000km coastline.

The continent’s fringing waters witness a massive shift each year, with sea ice peaking at about 18m sq km each September before dropping to just above 2m sq km by February.

But across those four decades of satellite observations, there has never been less ice around the continent than there was last week.

“We are seeing less ice everywhere. It’s a circumpolar event.”

In the southern hemisphere summer of 2022, the amount of sea ice dropped to 1.92m sq km on 25 February – an all-time low based on satellite observations that started in 1979.

Read the complete article….
Melting ice in Antarctica has affected a key global ocean current, research suggests. Photograph: Anadolu Agency/Getty Images / from the article

Donna Lu – 26/05/2023 in The Guardian

Slowing ocean current caused by melting Antarctic ice could have drastic climate impact, study says

The Southern Ocean overturning circulation has ebbed 30% since the 90s, CSIRO scientist claims, leading to higher sea levels and changing weather.

A major global deep ocean current has slowed down by approximately 30% since the 1990s as a result of melting Antarctic ice, which could have critical consequences for Earth’s climate patterns and sea levels, new research suggests.

Known as the Southern Ocean overturning circulation, the global circulation system plays a key role in influencing the Earth’s climate, including rainfall and warming patterns. It also determines how much heat and carbon dioxide the oceans store.

Scientists warn that its slowdown could have drastic impacts, including increasing sea levels, altering weather patterns and depriving marine ecosystems of vital nutrients.

Read the complete article….

Markus Noll – 23/05/2023 in EarthArXiv

Exponential life-threatening rise of the global temperature

Global temperatures are rising. This paper demonstrates for the first time that the global temperature increase has not been linear but is exponential with a doubling time of about 25 years. Both the amount of carbon dioxide produced by the combustion of fossil fuels and the amount of carbon dioxide in the atmosphere have also risen exponentially, with a similar doubling time. The exponential trajectories of rising global temperature, carbon dioxide emission, and atmospheric carbon dioxide concentration support the idea that all three are entirely man-made. This analysis shows that during the past 70 years, the increasing use of fossil fuels results more from human activities than population growth, and that reducing the use of fossil fuels by 7.6% each year, the “7.6%-scenario”, can prevent annual global temperatures from surpassing pre-industrial temperatures by 1.6°C, a critical threshold to sustaining life on Earth.

Read the complete article….

Driven by exponentially increasing global temperatures, this process is also very likely to be accelerating at an exponential rate (doubling time of about 25 years).

Or worse!

What I think we are seeing in this data is that we have crossed a chaotically discontinuous ‘tipping point’. Prior to March 12, the thermohaline circulation was slowing as surface waters were gradually becoming warmer and more dilute, and thus less dense, decreasing the sinking rate of the cooling warm salty water that was driving the circulation. Around March 12, the surface waters actually became less dense than the deeper waters and thus stopped sinking at all to begin piling up in the polar regions where they would increase the rate of ice melting to be diluted still further.

With no sinking water to keep the the thermohaline circulation working, it has effectively been jammed and we are now in a totally new climate regime that is likely to get a lot hotter, a lot faster.

If this isn’t a climate emergency, I don’t know what is.

As at May 30, the heat anomaly is still growing. The average surface temperature of the World Ocean is a good 0.2 °C hotter than it has been on this day since the satellite records began in 1979; and it is only 0.1 °C cooler than the hottest temperature ever recorded in this era for any time of the year.

Featured Image

Figure from https://twitter.com/LeonSimons8/status/1663936433801887744/photo/1. “Will a Super El Niño materialize like in 1997 and 2015? What will that mean for global Sea Surface Temperatures? And for global and regional weather extremes?” This seems to be answered by https://twitter.com/LeonSimons8/status/1663195220207362048/photo/1

Views expressed in this post are those of its author(s), not necessarily all Vote Climate One members.

Coral reef ecosystems on the way to being cooked

The accelerating heat content of the world’s oceans will soon be forcing coral reef ecosystems towards their collapse into mass extinction

Click here for a detailed explanation of the graph

Views expressed in this post are those of its author(s), not necessarily all Vote Climate One members.

European Space Agency research on rising sea-levels

The European Space Agency presents some of its satellite-based research programs on ice melting and rising sea levels..

by Space for Our Climate 10/02/2022 — European Space Agency
New research sums up sea-level rise: Sea-level rise is arguably one of the most serious consequences of the climate crisis. While using satellite data to monitor how the height of the sea is changing provides critical evidence for decision-making, satellites are also essential to measuring the individual components, such as seawater temperature and glacier melt, that contribute to the overall rise. Confidence in the accuracy of these separate measures is key. ESA-funded research now confirms that the figures match up.

Views expressed in this post are those of its author(s), not necessarily all Vote Climate One members.

Rising sea-level risk: can’t know when or how much

Melting polar glaciers are main contributors to rising sea level. The melting process is highly non-linear and thus inherently unpredictable

At least since the 1800s, world sea levels have been rising gradually but at a slowly accelerating rate. Since in the last 140 years it has risen around 17 cm, with around 6 cm of that in the 20 years between 2000 and 2020. And this is only a small part of the hugely complex planetary climate system that has an inherently unpredictable capacity to produce abrupt and catastrophically large changes in climate conditions.

Shows a slow acceleration in the rate of sea level rise.

The rising sea-level has two sources: runoff from the land (mostly glacial melt water) and thermal expansion of the ocean itself due to warming from excess solar energy accumulating from the global warming process.

Sourced from East Coast flooding is a reminder that sea level is rising as the climate warms – here’s why the ocean is pouring in more often – by Jianjun Lin, 07/11/2021 in the Conversation.

The melt water in the rising sea-level comes from two primary sources, melting glaciers and ice cap on Greenland that has increased 6-fold over the last couple of decades; and melting glaciers and ice cap on Antarctica which has more than doubled over the same time. This is measured by the loss of mass variable – representing the weight of the water that has been added to the oceans.

As described in the feature article below, the melting rate of a glacier is determined by its speed as it is creeping/sliding down the continental slope into the ocean. This in turn is determined by a complex set of interacting factors, e.g., temperature, angle of slope, width and roughness of the bed, how much meltwater is in the bed to lubricate/float the ice, where and how the ice may crack and crumble, how many bends there are in the valley, ocean conditions at the foot, whether and to what extent warm and salty (salt lowers the melting temperature of ice) ocean water penetrates into the glacier bed under its foot, thickness and extent of the floating ice shelf at the glacier’s foot and so on. Simply stated, melt rates are inherently unpredictable. However, one thing we can be sure of is that the melt rate will speed up as ambient temperatures increase the rate of ice melting, and rain replaces snow as the main form of precipitation.

The geological record provides good evidence that episodes of abrupt ice melting can cause raise sea-levels a lot faster than they are now, perhaps even showing large changes in rate over a few decades.

See Wikipedia: Meltwater pulse 1A: Meltwater pulse 1A (MWP1a) is the name used by Quaternary geologists, paleoclimatologists, and oceanographers for a period of rapid post-glacial sea level rise, between 13,500 and 14,700 years ago, during which global sea level rose between 16 meters (52 ft) and 25 meters (82 ft) in about 400–500 years, giving mean rates of roughly 40–60 mm (0.13–0.20 ft)/yr…. This rate of sea level rise was much larger than the rate of current sea level rise, which has been estimated to be in the region of 2–3 mm (0.0066–0.0098 ft)/yr.

There may well be enough ice in the West Antarctic Ice Sheet — especially if combined with an equally rapid melting of the Greenland Ice Sheet to support an equivalent amount of melting to the Meltwater Pulse 1A. It is notable that the land surface underlying very large areas of both West Antarctica and Greenland are below sea level – giving ample opportunities for warm ocean water to help speed the melting and collapse of the ice sheets.

Glacier front meets the sea

Why Melting Ice in Antarctica is Making Waves: Scientists recently discovered that the Thwaites Ice Shelf, a floating ice shelf that supports the Florida-sized Thwaites Glacier, could collapse in as little as five years because of global warming.

Climate Reality Project, 28/01/2022

This past December, the massive Thwaites Glacier in Western Antarctica made headlines for all the wrong reasons. Specifically, because new research revealed that the ice shelf preventing it from sliding into the ocean and drastically raising sea levels could collapse well within the next decade.

This Florida-sized glacier had already worried experts for years, going as far as to regularly be called the “Doomsday Glacier”. And yet, this update from the scientific community was still groundbreaking. 

It’s news that the world — particularly low-lying island and coastal communities — should understand and act on. So, what exactly is Thwaites Glacier, what does the latest research about it say, and what consequences could come from its decline?

FIRST THINGS FIRST, WHAT IS THWAITES GLACIER?

Thwaites Glacier is a massive body of dense ice located in Western Antarctica. Measuring about 80 miles (120 km) across, it’s the widest glacier on Earth.

Decline of West Antarctic Glaciers Appears Irreversible

Thwaites Glacier in Western Antarctica. Credit: NASA

The glacier has an ice shelf — a permanent piece of floating ice connected to it — that branches out into the Amundsen Sea. Now, understanding what exactly an ice shelf does is crucial.

Read the complete article….

As long as the world continues to warm and large amounts of snow and ice remain lying on the land, sea levels will continue to rise. The risk of an abrupt sea-level rise is real. The human and economic costs of such an event would be catastrophic if it happens. It therefore makes very good sense that mitigation works should begin soon with planning in place at federal, state and local levels to accelerate the work if we have any clear early warning signs that abrupt melting is actually beginning.

It is also clear that our present LNP COALition governments deeply deny the risks Australia faces from global warming and the climate emergency, and should be replaced with rational people who put action on the climate emergency at the top of their to do lists if they should be elected to Parliament.

The puppets show and tell
Captain Humbug (A.K.A. Scotty from Marketing) showing the parliamentary puppet troop what it is all about behind his then PM, “Don’t be afraid, don’t be scared, it won’t hurt you. It’s coal.” With these words Australia’s Treasurer Scott Morrison taunted the Opposition, attempting to ridicule its commitment to renewable energy.” – Picture from The Conversation (15-02-2017). See also Katherine Murphy in The Guardian on 09/02/2017 for the live video — “Scott Morrison brings coal to question time: what fresh idiocy is this? What a bunch of clowns, hamming it up – while out in the real world an ominous and oppressive heat just won’t let up.”

Also, from the official transcript dated 20/12/2019 from the PM’s own office, Scotty made it abundantly clear to John Stanley on 2GB Radio that HE doesn’t fight fires… “But I know Australians understand… that, you know, I don’t hold a hose, mate, and I don’t sit in a control room. That’s the brave people who do that are doing that job. But I know that Australians would want me back at this time out of these fatalities. So I’ll happily come back [from his secret holiday in Hawaii] and do that.”

Sixteen year-old Greta tells us and everyone at the 2019 World Economic Forum in Davos how we and our governments should actually respond to the climate emergency:

greta-act-as-if-the-house-was-on-fire
Listen to Greta’s speech live. Except for her reliance on the IPCC’s overoptimistic emissions budget, everything she says is spot on that even she, as a child, can understand.

In other words, smell the smoke, see the reality, and fight the fire that is burning up our only planet so we can give our offspring a hopeful future. This is the only issue that matters. All Capt. Humbug and his troop of wooden-headed puppets are doing is rearranging the furniture in the burning house to be incinerated along with anything else we may care about. In Greta’s words, “even a small child can understand [this]”. People hope for their children’s futures. She doesn’t want your hope. She wants you to panic enough to wake up and fight the fire…. so she can have some hope for her future. Vote Climate One’s Traffic Light Voting System will help you use your vote wisely on behalf of our offsprings’ futures.

Views expressed in this post are those of its author(s), not necessarily all Vote Climate One members.

What was extreme in the past for the world’s oceans is now the normal

by Carolyn Gramling, 01/02/2022 in Science News
The past’s extreme ocean heat waves are now the new normal: More than half the global ocean experiences high temperatures that were rare a century ago.

See also 2021 might not have been the hottest year on record, but the heating oceans are hotter than ever

Views expressed in this post are those of its author(s), not necessarily all Vote Climate One members.

Dying coral reefs and collapsing reef ecosystems: evidence of more progress towards the point of no return on the way to Hothouse extinction

Part 5 of David Spratt’s guidebook to events along the road to Hothouse Hell: Increasingly frequent and stronger marine heatwaves are bleaching and killing corals, architects of reef ecosystems. Rotting organic matter emits GHGs

Coral polyps are the primary architects of the remarkably diverse coral reef ecosystems that border lands and islands in tropical oceans around the world. As such coral reefs provide shelter and sustenance for a significant fraction of our ocean’s biomass for at least part of their lives. Coral polyps are colonial animals related to jellyfish and sea anemones. However, thanks to symbiotic algae that live in their bodies, they are sinks for capturing and sequestering CO₂ in forming the limestone reefs. Over the last 10,000 years or so, they have thrived in waters close to the maximum temperatures their photosynthetic algae can tolerate. However, as the world begins to warm beyond temperatures observed for many 10s of thousands of years corals have had to expel their algae and become bleached. As Spratt describes, bleaching is becoming common event for the Great Barrier Reef, and is leading to dying coral reefs and collapsing reef ecosystems around the world.

As masses of polyps die and rot they become net greenhouse gas emitters (CO₂, methane, hydrogen sulfide – H₂S – where the H₂S is also highly toxic) and end up covered by slimes of bacteria and algae. The dead reef becomes quite toxic, and loses many of the species that originally thrived there through starvation, poisoning, or loss of habitat. Thus, the rising greenhouse gas emissions from dying and decomposing reef ecosystems adds yet another source of positive feedback to drive global temperatures (including ocean temperatures) higher yet.

Great Barrier Reef bleaching 2016

28 January 2022

Have tipping points already been passed for critical climate systems? (5) Coral Reefs: A death spiral

by David Spratt in Climate Code Red
Fifth in a series.
Read 1  |  2  |  3  |  4  |  5  |  6  |  7

Ecosystems, including coral reefs, mangroves and kelp forests in Australia, are degrading fast as the world’s sixth mass extinction gathers pace. 

… 

Corals survive within a narrow water temperature band, and suffer heat stress and expel zooxanthellae if the ocean temperature gets too high. Bleaching events vary in intensity; in the extreme case, all zooxanthellae are expelled and the living colony will appear totally white (hence “bleaching”).  As elevated sea temperatures persist, coral mortality rates increase: corals may recover, if there are any zooxanthellae left in their tissues, but if not, death appears to be inevitable. 

The bottom line: If severe bleaching events occur regularly at shorter than 10–15 year intervals, then reefs face a death spiral of coral mortality followed by inadequate recovery periods. And that is what is happening now. Along Australia’s Great Barrier Reef, the frequency of mass bleaching is increasing, with events occurring in 1998, 2002, 2016, 2017 and 2020.  The 2016-17 events severely bleached half the reef, whose extent has been reduced by three-quarters over the last 40 years. Coral reproduction on the Great Barrier Reef has fallen 89% after repeated recent bleachings.  [My emphasis]

Read the complete article….

Analyses published yesterday shows that it is probably already too late to save dying coral reefs and reef ecosystems (including the Great Barrier Reef) from terminal collapse in the next decade or two

One of these articles is referenced in today’s The Age newspapers.

James Cook University marine biologist Jodie Rummer at work on the Great Barrier Reef. She has witnessed previous bleaching and described it as “scary and disturbing”.Credit:Grumpy Turtle

No climate change refuge for coral reefs: study

by Miki Perkins, 02/02/2022 in The Age

Global warming of 1.5 degrees above pre-industrial levels will be catastrophic for almost all coral reefs, including those that scientists once hoped would act as refuges during climate change.

Only 0.2 per cent of coral reefs globally are likely to avoid frequent heat stress if temperatures warm, according to new research from an international team of universities, including James Cook University in Townsville.

Even thermal refuges, which experts assumed would be more able to endure warming oceans owing to factors such as the consistent upwelling of cool deep waters, would provide almost no protection to reef animals, the study found. It is published today in PLOS Climate.

Read the complete article….

Actually, there were two articles on rapidly rising sea surface temperatures (SST) published yesterday in the science journal, PLOS Climate. Together they seem to seal the fate of most of our planet’s coral reef ecosystems:

Future loss of local-scale thermal refugia in coral reef ecosystems

by Adele M Dixon, et al., 01/02/2022 in
PLOS Climate – https://doi.org/10.1371/journal.pclm.0000004

Global distribution of exposure category in the 1986–2019 climate and at 1.5 and 2.0°C of future global warming. [DHW is the sum of SST anomalies 1°C higher than the long-term maximum monthly mean (MMM) over a 12-week period] Exposure categories are thermal refugia (probability of DHW events > 4°C-weeks less than 0.1 yr‒1), intermediate (probability of DHW events > 4°C-weeks from 0.1–0.2 yr‒1) and exposed (probability of DHW events > 4°C-weeks greater than 0.2 yr‒1). Percentages indicate the regional (on map) and global (right of map) proportion of thermal refugia (blue) and exposed reefs (red). The 12 coral reef regions are outlined in light blue. The base map is made with Natural Earth.

ABSTRACT: Thermal refugia underpin climate-smart management of coral reefs, but whether current thermal refugia will remain so under future warming is uncertain…. We confirm that warming of 1.5°C relative to pre-industrial levels will be catastrophic for coral reefs….

Read the complete article…..

The recent normalization of historical marine heat extremes

by K. Tanaka & Kyle S. Van Houtan 01/02/2202 in
PLOS Climate – https://doi.org/10.1371/journal.pclm.0000007

Decadal evolution of frequency of extreme marine heat from 1980–2019. Extreme heat defined as exceeding the localized (1° × 1°), monthly, 98th percentile of sea surface temperatures (SST) observed during 1870–1919, averaged from HadISSTv1.1 and COBESSTv2 products. Extreme heat, resolved for boreal winter (Jan-Mar) and summer (Jul-Sep), accumulates steadily over time beginning in the Southern, South Atlantic, and Indian basins. Regions of the mid North Atlantic and eastern South Pacific indicate a low occurrence. The base map layer was drawn using the “rworldmap” R package (https://cran.r-project.org/web/packages/rworldmap/index.html:

ABSTRACT: Climate change exposes marine ecosystems to extreme conditions with increasing frequency…. For the year 2019, our index reports that 57% of the global ocean surface recorded extreme heat, which was comparatively rare (approximately 2%) during the period of the second industrial revolution. Significant increases in the extent of extreme marine events over the past century resulted in many local climates to have shifted out of their historical SST bounds across many economically and ecologically important marine regions. For the global ocean, 2014 was the first year to exceed the 50% threshold of extreme heat thereby becoming “normal”….

Read the complete article….

The bottom line: It is almost certainly too late to save the Great Barrier Reef we know from ecological collapse, but we might be able to save keystone species able to rebuild it if we can stop and reverse global warming

Given that we have probably already crossed several tipping points such as permafrost thawing on the road to runaway global warming where natural positive feedbacks will continue working to drive global temperatures ever higher, the Great Barrier Reef as we know it seems to be unavoidably doomed. However, as long as a majority of the keystone architect coral species survive somewhere, they may be able to recolonize their previous ranges and begin building new reefs over subsequent centuries.

Unfortunately, when we should be working all-out to stop anthropogenic greenhouse gas emissions, our present Australian Government lead by Capt. Humbug (AKA Scotty from Marketing) and his deputy Blarny Barney (the Man with the Hat) is working hard to grow and maintain the healthy capacity of the fossil fuel industry to produce and burn carbon for energy. Also, not only are they doing nothing practical to stop and reverse global warming, but they just promised to spend a billion dollars on the Reef (over 9 years) to cloak the fact that they are doing nothing that counts to save the Reef (or for that matter our own human species).

The rapidly approaching Federal Election gives us the opportunity to remove Capt. Humbug and his wooden headed puppets from office and replace them with trustworthy, thinking people who have committed themselves to put work to solve the climate crisis as their first order of business if elected to Parliament. Vote Climate One’s Traffic Light Voting System is designed to help you do this.

Views expressed in this post are those of its author(s), not necessarily all Vote Climate One members.

We shouldn’t forget – Antarctic ice is also melting

Zach Labe is always a good source of graphics summarizing collections of data on our changing climate Here he shows the melting of sea ice around Antarctica. The horizontal line shows the average extent of sea ice over the era of satellite measurements (beginning in 1978). The red line shows how much smaller extent of sea ice this January so far.

Views expressed in this post are those of its author(s), not necessarily all Vote Climate One members.