A warming ocean will take its revenge on us

Around 90% of the extra heat trapped by the greenhouse layer warms our Ocean to slow rising temperatures. We’ll pay the price.
The climate scientist, Bill McKibben reminded me of this fact in his regular newsletter, The Crucial Years, in his 18 May post, Maybe we should have called this planet ‘Ocean’. His post on ocean warming begins with an earlier version of the graphic here from ClimateReanalizer. These are updated daily, so the record here is only a day or two behind the current reality:

Something very troubling is happening on and under the 70 percent of the planet’s surface covered by salt water. We pay far more attention to the air temperature, because we can feel it (and there’s lots to pay attention to, with record temps across Asia, Canada and the Pacific Northwest) but the truly scary numbers from this spring are showing up in the ocean.
If you look at the top chart above , you can see “anomaly” defined. [His chart was for 11 May. Mine, here, is the temperature on 19 May.]That’s the averaged surface temperature of the earth’s oceans, and beginning in mid-March it was suddenly very much hotter than we’ve measured before. In big datasets for big phenomena, change should be small—that’s how statistics work, and that’s why the rest of the graph looks like a plate of spaghetti. That big wide open gap up there between 2023 and the next hottest year (2016) is the kind of thing that freaks scientists out because they’re not quite sure what it means. Except trouble. [My emphasis]
… A little-noticed [but quite important] recent study headed by Katrina von Schuckmann found that “over the past 15 years, the Earth has accumulated almost as much heat as it did in the previous 45 years,” and that 89 percent of that heat has ended up in the seas. That would be terrifying on its own, but coming right now it’s even scarier. That’s because, after six years dipping in and out of La Nina cooling cycles, the earth seems about to enter a strong El Nino phase, with hot water in the Pacific. El Nino heat on top of already record warm oceans will equal—well, havoc, but of exactly what variety can’t be predicted.
Read the complete article….
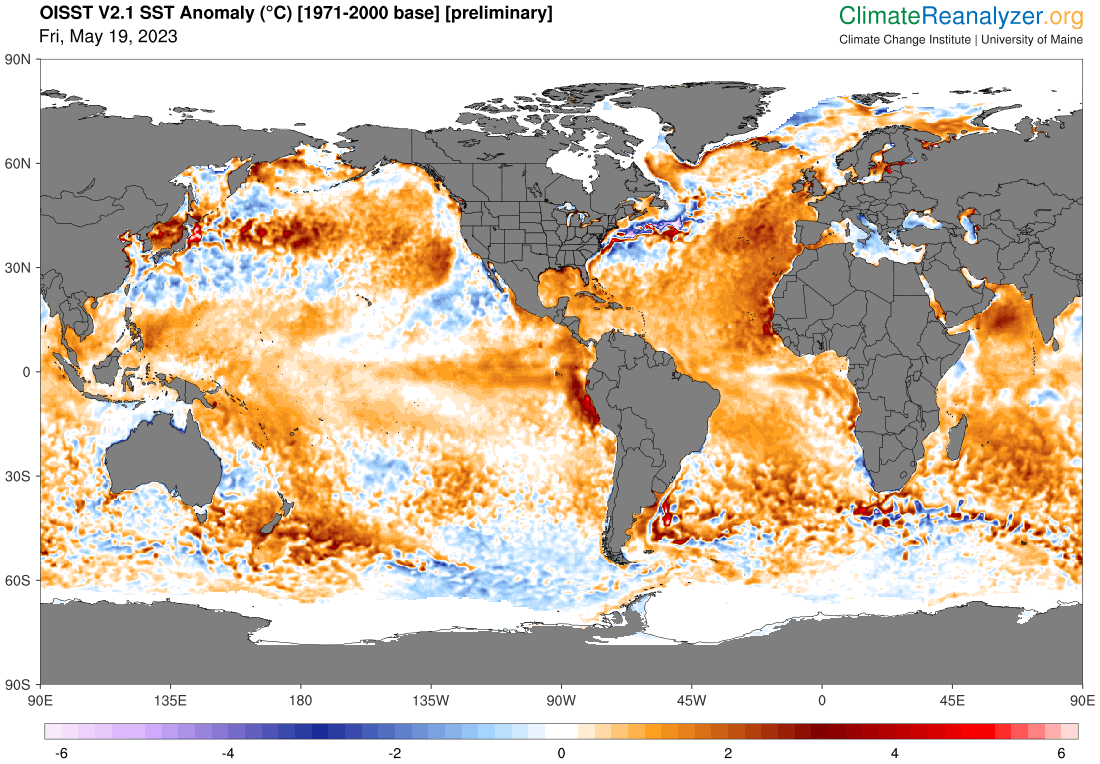
McKibben’s second graphic (the up to date version is my “Featured Image”) shows a global plot of temperature anomalies (also compared to the same 1971-1980 baseline) for every ¼° – ¼° square of ocean surface. “Area weighting” is applied because ¼° of latitude (the width of the ‘square) becomes much narrower as either pole is approached, reducing the physical surface area encompassed by the lines on the globe.
Earth’s oceans cover around 70% of the globe’s surface. Despite the 2nd or 3rd week of record breaking heat, wildfires and drought in western North America extending from California through the western 2/5ths of North America into the Arctic Ocean and a second belt in northern Eurasia extending from Scandinavia and Finland to western Siberia, the ocean temperatures are relatively even more extreme. And, in fact, the crazy heat in the warming oceans may be the driving force behind the record land temperatures — and may well be triggering what is likely to be the most extreme El Niño event yet in the climate change record.
In any event, this data doesn’t just freak me out. It suggests that the door to Earth’s Hothouse Hell is beginning to open to suck us in.
Is this data reliable enough to support action?
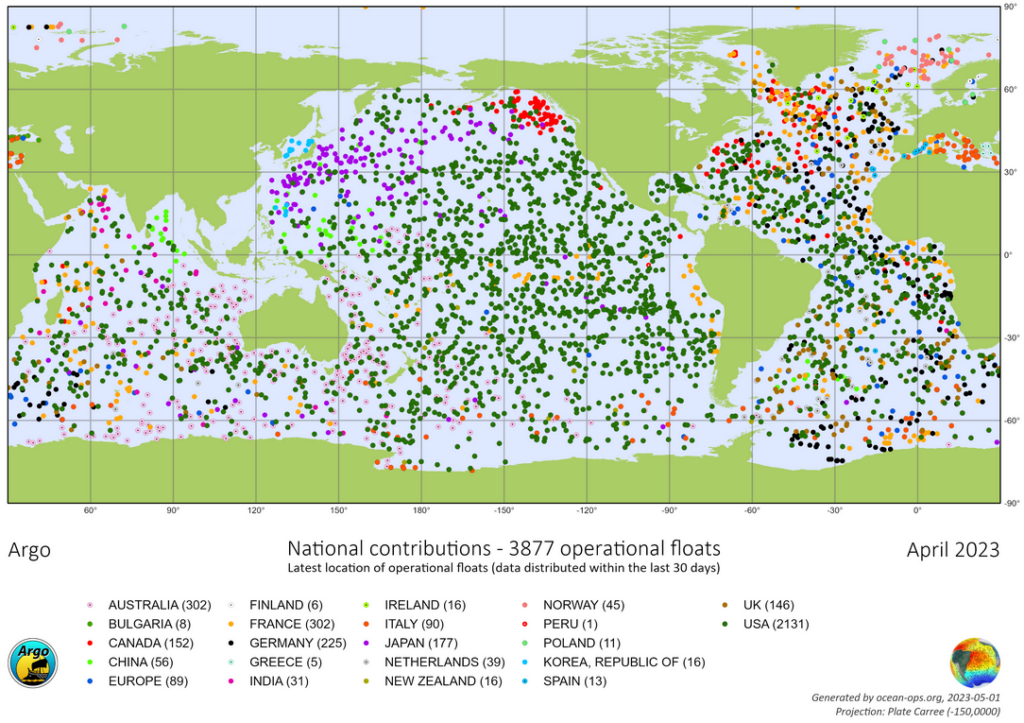
Where the climate record is concerned, From the beginning of the satellite era, our oceanic temperature record is very good indeed, and not just because satellite remote sensing measures virtually every square degree of most of the globe every day, but the satellites’ measurements are calibrated every day against the ‘ground truth’ measurements from many hundreds of Argo floats surfacing each day from their 9-10 days probing the ocean depths. The graphic below shows the physical locations sampled by Argo floats over the previous month. Added to these are more detailed measurements collected by fleets of oceanographic ships and a few special moored buoys that continuously record measurements from the ocean surface to the abyssal ocean bottom.

Supercomputers amalgamate the raw input data and assemble the kinds of human readable outputs that you and I can understand at a glance. Thanks to the exponential growth of measuring technologies and data processing power the accuracy and detail of our scientific understanding of climate and weather extends far beyond anything we could know in past decades.
How is all the additional heat in the warming ocean likely to affect the planet we live on?
Melting ice
As the atmosphere and oceans absorb more solar energy, some of this excess energy will inevitably be absorbed melting ice in the cooler regions of the planet where ice has existed more-or-less in an equilibrium state, e.g., in the form of glaciers, ice sheets, and sea ice. The energy drives the equilibrium states towards more water and less ice.
One very obvious measure of ice melting is the rapidly shrinking area of the Earth’s surface covered by sea ice around the N and S Poles. Since the beginning of the satellite era this has been able to be measured accurately. The Australian Antarctic Program Partnership and the ARC Australian Centre for Excellence in Antarctic Science’s 2023 Science Briefing: On Thin Ice explains what is happening around our local polar ocean
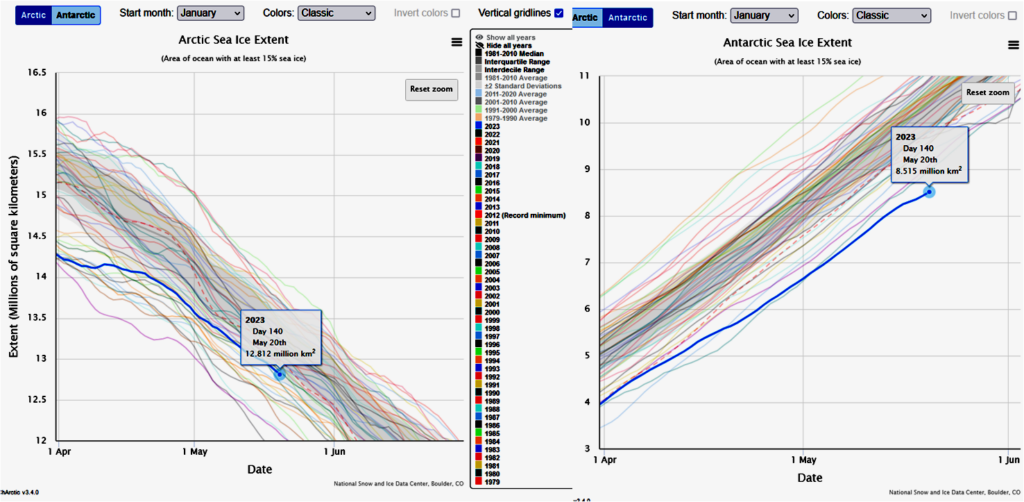
The graphics below show the daily extents of sea ice over both polar oceans since the beginning of the satellite era in 1979 as plotted by the US National Snow and Ice Data Center‘s interactive Charctic application.

View additional years by clicking the dates in the legend.
Roll your cursor over the line to see daily sea ice extent values.
Zoom in to any area on the chart by clicking and dragging your mouse.
To see a corresponding daily sea ice concentration image, click on a line in the chart. Sea ice extent is derived from sea ice concentration. Images are not available for the average or standard deviation.
When reusing Charctic images or data, please credit “National Snow and Ice Data Center.”
Currently, some functions do not work in Internet Explorer. We recommend using a different browser.
For more information about the data, see About Charctic data.
If you have questions or problems, please contact NSIDC User Services at [email protected].
What is currently happening in the Antarctic Ocean is also freakish and worrisome!
Rising sea levels
Of course, all the melt water released by melting ice has to go somewhere — i.e., adding to the volume of the World Ocean. As this wasn’t enough, as water warms it also expands to raise the sea levels even more. The graph below from the EU’s Copernicus Climate Change Service, plots the rising tide of the swelling ocean since 1993 through June 2022. The US National Oceanic and Atmospheric Administration’s Climate.Gov site’s Climate Change: Global Sea Level also plots the rise, and considers its implications in more detail.
The Conversation’s May 17 article, Global warming to bring record hot year by 2028 – probably our first above 1.5°C limit, looks at these facts and warns us that the time to act is NOW! CSIRO’s State of the Climate/Oceans covers most of the trends I have discussed here and more…

https://climate.copernicus.eu/climate-indicators/sea-level
Help! We’re sliding down the slope to Earth’s Hothouse Hell! Sound the sirens and mobilize for WW III against global warming and the existential climate crisis!
As is usual for the UN’s climate pronouncements driven by the UN’s IPCC findings that absolutely establish the dangers we face from global warming/heating, even this klaxon warning understates and downplays the magnitude of the crisis we face.
If we fail to mobilize genuinely effective action over the next decade to stop and reverse the warming crisis, our families will have their lives shortened due to increasing climate catastrophes and we will have condemned our entire species to death in Earth’s 6th global mass extinction within a century or two. We don’t have time to take more election cycles to elect new governments. Our existing governments must wake up, smell the smoke, and immediately begin acting to put out the fire before it destroys us all. If you are in government, read Guterres’ message in mind. YOU must act now!
Press Release
16 May 2023
Planet Hurtling towards Hell of Global Heating, Secretary-General Warns Austrian World Summit, Urging Immediate Emissions Cuts, Fair Climate Funding
Following is the text of UN Secretary-General António Guterres’ video message to the seventh Austrian World Summit, in Vienna today:
I thank the Austrian Government and Arnold Schwarzenegger for this opportunity. The climate crisis can feel overwhelming. Disasters and dangers are already mounting, with the poor and marginalized suffering the most, as we hurtle towards the hell of 2.8°C of global heating by the end of the century.
But, amidst all this, I urge you to remember one vital fact: limiting the rise in global temperature to 1.5°C remains possible. That is the clear message from the Intergovernmental Panel on Climate Change (IPCC). But, it requires a quantum leap in climate action around the world.
To achieve this, I have proposed an Acceleration Agenda. This urges all Governments to hit fast-forward on their net-zero deadlines, in line with the principle of common but differentiated responsibilities and respective capabilities in the light of national circumstances. It asks leaders of developed countries to commit to reaching net zero as close as possible to 2040 — as Austria has done. And leaders in emerging economies to do so as close as possible to 2050.
The Acceleration Agenda also urges all countries to step up their climate action, now. The road map is clear: phasing out of coal by 2030 in OECD [Organisation for Economic Co-operation and Development] countries and 2040 in all others; net-zero electricity generation by 2035 in developed countries, and 2040 elsewhere; no more licensing or funding of new fossil-fuel projects; no more subsidizing fossil fuels; and no more fake offsets, which do nothing to cut greenhouse-gas emissions, but which are still being used to justify fossil-fuel expansion today.
We can only reach net zero if we make real and immediate emissions cuts. If we embrace transparency and accountability. Relying on carbon credits, shadow markets, or murky accounting means one thing: failure. That is why I have asked CEOs to present clear net-zero transition plans, in line with the credibility standard presented by my high-level expert group on net-zero pledges.
And the Acceleration Agenda urges business and Governments to work together to decarbonize vital sectors — from shipping, aviation and steel, to cement, aluminium and agriculture. This should include interim targets for each sector to pave the way to net zero by 2050.
The Acceleration Agenda also calls for climate justice, including overhauling the priorities and business models of multilateral development banks, so that trillions of dollars in private finance flow to the green economy.
Developed countries must also make good on their financial commitments to developing countries. And they must operationalize the loss and damage fund, and replenish the Green Climate Fund. I commend Austria for increasing its pledge to the Green Climate Fund by 23 per cent and urge others to deliver their fair share.
On climate, we have all the tools we need to get the job done. But, if we waste time, we will be out of time. Let’s accelerate action, now. Thank you.
Featured Image
Note that about half the surface of Earth’s Ocean is a good 2 °C hotter than the baseline average temperature for this day of the year