David Wallace-Wells, 6 May 2026. We’re about to find out how prepared we are for climate change. New York Times.
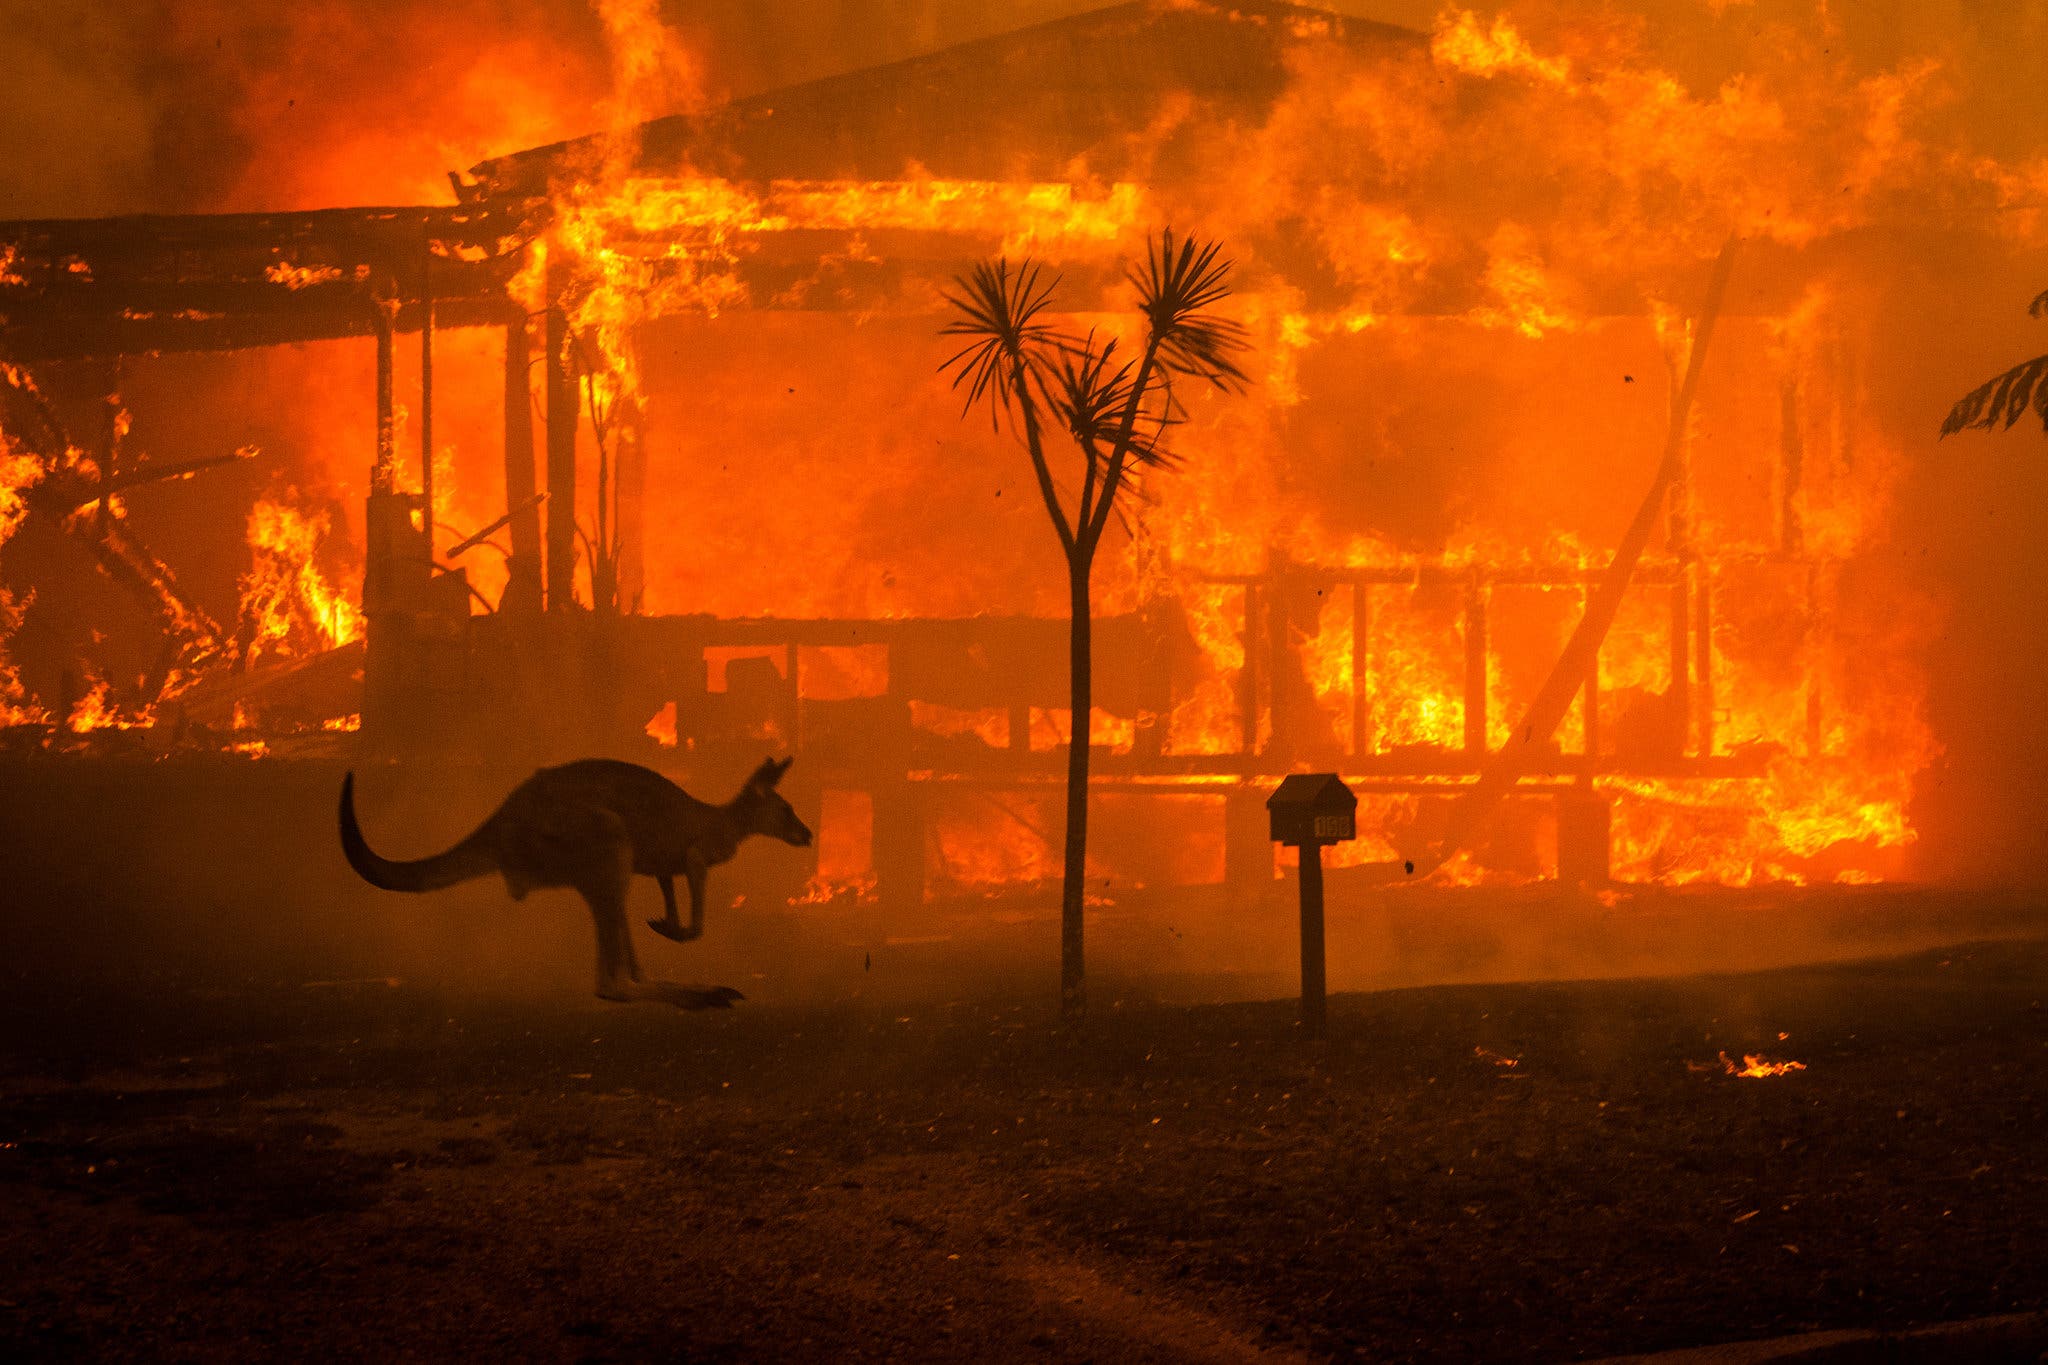
This image of a burning home in Lake Conjola in New South Wales, Australia, was taken in the middle of the day on New Year’s Eve 2009 in the Black Summer. Credit…Matthew Abbott for The New York Times
A climate monster is growing right now in the Pacific Ocean, perhaps the most fearsome El Niño since before scientists even began modeling them. They now know the pattern quite well: A marine heat-wave in the Pacific Ocean scrambles global weather and produces in some places more intense droughts and in others more intense rainfall and flooding; disruptions to hurricane patterns and monsoon seasons, which can cause widespread crop failures; and much more punishing heat.
The El Niño building right now, and expected to crest around the end of next year, arrives on top of all our global warming. And it appears stupendously intense — almost certainly stronger than the “Super” El Niño of 2015-16, and perhaps the most intense since the epochal El Niño of 1877. The global consequences of that climatic event were so devastating that the environmental historian Mike Davis called them “Late Victorian Holocausts.”
…
How much will burn in the 18 months to come? It is still too early to say with confidence, since though the models are flashing red, we are still early enough in the season that scientists tend to be cautious in their projections. But some are already calling it a “Super Duper El Niño,” and others a “Godzilla El Niño,” and underlying warming has been accelerating in recent years, disconcertingly, raising the possibility that even a brief spike will push the planet into genuinely uncharted territory temperature-wise. In fact, it’s almost certain that this El Niño will make 2027 the hottest year on record by some margin, and there is a chance, the climate scientist James Hansen has suggested, that global average temperatures would jump to 1.7 degrees above the preindustrial average next year.
Scientists tend to talk about warming thresholds in terms of long-term averages rather than single-year bursts, but a monster El Niño will give us at least a brief preview of a hotter and more chaotic world — a 2027 like we might’ve expected to see in 2035, and which not that long ago didn’t seem likely before 2050. “Prepare for bedlam,” the environmental writer Bill McKibben wrote earlier this year in anticipation.
… Follow the link below to read the complete article shared from:
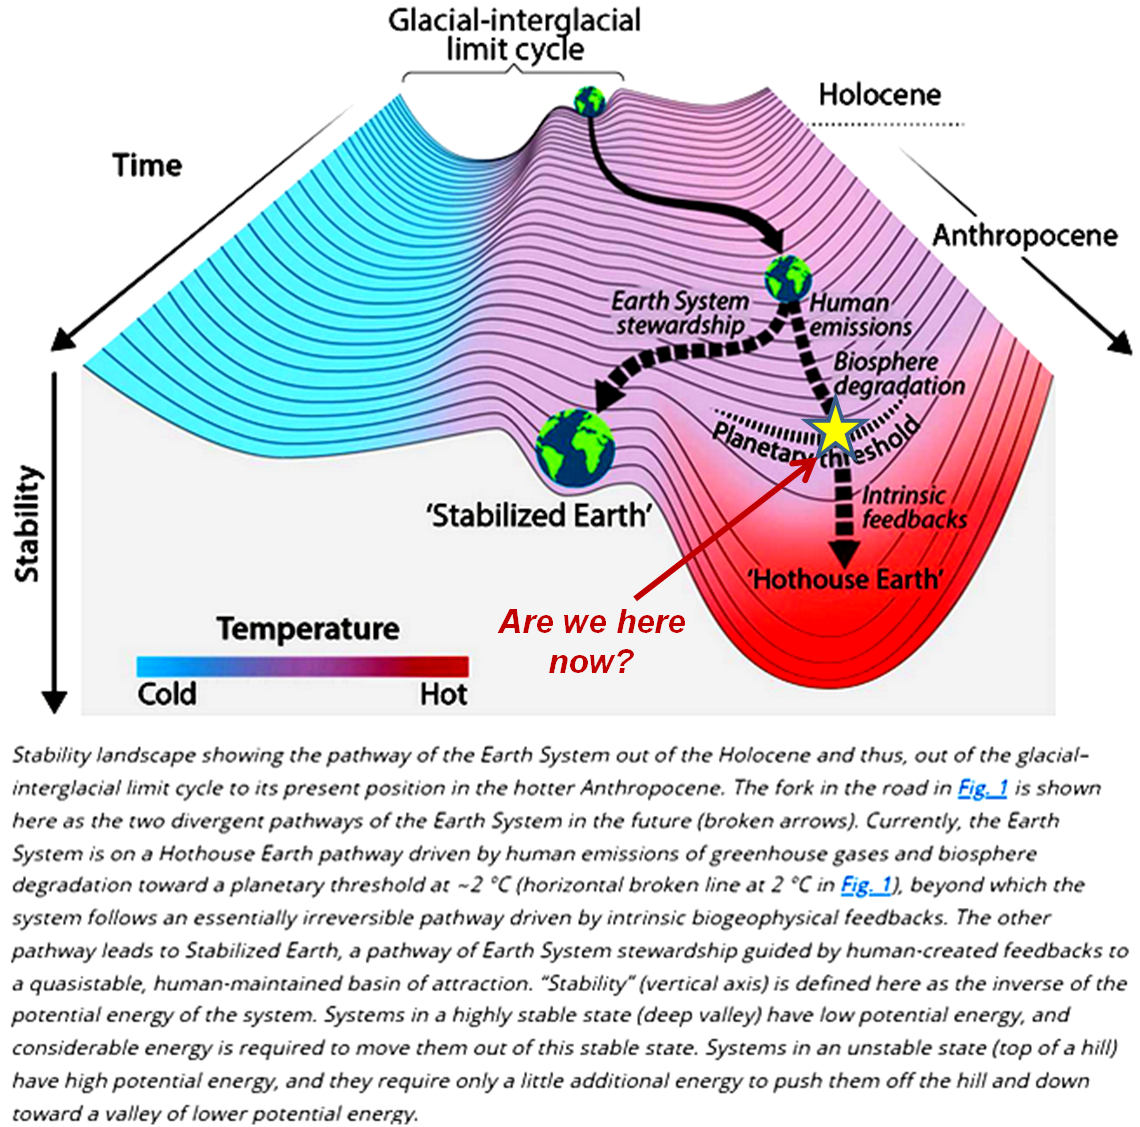
Columnists and almost all of the institutional and academic scientists don’t dare think about or tell you that Earth’s Climate System is one of the first models for a particularly nasty class of complex dynamical systems where feedbacks are nonlinear and sometimes chaotic. These systems exhibit semi-stable cyclical patterns as long as the variations don’t cross any invisible thresholds that cause the system to ‘flip’ to quite different patterns of variation. In our climate system, modeling has identified several temperature-related variables with thresholds that significantly increase the amount of heat entering the system (and therefore the system’s temperature).
Given that the impending “Godzilla” El Niño is likely to raise global temperatures to values that haven’t been seen for centuries, when baseline temperatures were a degree or more cooler than today’s baseline. I would not be surprised if this takes us over the edge of the cliff to fall into what will be the steaming cauldron of Earth’s Hothouse Hell, which humans and most other complex life on Earth won’t be able to survive.
My only hope for our long-term survival is that our already explosively evolving AI technology will evolve fast enough to reengineer the Climate System so it can cool to the point where it flips back to the comfortable regime that we evolved in.
Our present Federal and State Governments have amply demonstrated that they are working hard to make fossil fuel special interests even wealthier than they already are.
If we are to have any hope of long-term survival, we must replace the existing party hacks and special interest puppets with people who understand and care more for their children and their communities than filling their pockets with oily tokens of appreciation from their super-wealthy masters.
VoteClimateOne explains how you, your family, and your friends can help. If we can change our governments, they may be able to deploy enough action to at least slow our fall into the cauldron for long enough for superintelligence to ramp up enough knowledge and power to actually stop the fall and give us wings to get back to a habitable Earth.
Views expressed in this post are those of its author(s), not necessarily all Vote Climate One members.
Labor incumbent likely to be challenged by an progressive independent candidate.
Solomon Bean Canberra
Priority Two Red Light Electorates
Labor incumbent likely to be challenged by a Greens or progressive micro-party candidate candidate.
Priority Three Red Light Electorates
Labor incumbent likely to be challenged by a Coalition candidate candidate.
In our pursuit of Minority Government and democratic renewal, the Team at Vote Climate One is in the process of identifying Red Light Federal electorates. This may take some time as we prioritise and develop each electorate’s profile.
Labor has 94 seats in the current parliament. We need to drag them back to 70 seats to change Australia’s political landscape so a progressive crossbench holds the balance of power. Minority government can put a brake on the vested interests controlling our two major parties.
As an example of how effective this can be the ACT Labor/Greens coalition has delivered excellent outcomes for people living in the Capital Territory over the last two decades. Canberra has been running on 100% renewable electricity since 2019, and on track to reach Net Zero by 2035.
WHY DO WE NEED MINORITY GOVERNMENT Australian democracy is not fit for purpose. The major parties have turned their backs on a fair future for us all. WHAT IS MINORITY GOVERNMENT? This happens when neither major party gains 76 seats in the House of Reps. election. They have to negotiate the support of enough cross bencher members to reach 76. CAN MINORITY GOVT. BE A GOOD DEMOCRATIC OUTCOME? The answer is a resounding YES! An example is the significant legislative reforms achieved by the Gillard government which struck an arrangement with three progressive cross-bench independents. Major policy initiatives of the Gillard government included, the Clean Energy Bill 2011, asylum seeker policy, Mineral Resource Rent Tax, National Broadband Network, schools funding following the Gonski Review and the National Disability Insurance Scheme. A more recent example is the significant long term achievements in relation to climate action by the ACT Labor/Greens
Views expressed in this post are those of its author(s), not necessarily all Vote Climate One members.
I am sorry about the long gap in my tracking of the still acceleration gamut of extreme weather worldwide. Every week, if not every day, brings yet more grim news of death and destruction from billion-dollar climate catastrophes. (From Watersheds, flooding, and pollution – Look around you, right now — you are in a watershed
Views expressed in this post are those of its author(s), not necessarily all Vote Climate One members.
America’s upcoming presidential election may be a crucial event in human history
Joe Biden’s withdrawal from the race for president and recommendation of Kamala Harris for the job is epochal. Biden was OK for the environment but couldn’t defeat Trump. Harris has what it takes to demolish Trump and lead the battle against runaway warming.
Views expressed in this post are those of its author(s), not necessarily all Vote Climate One members.
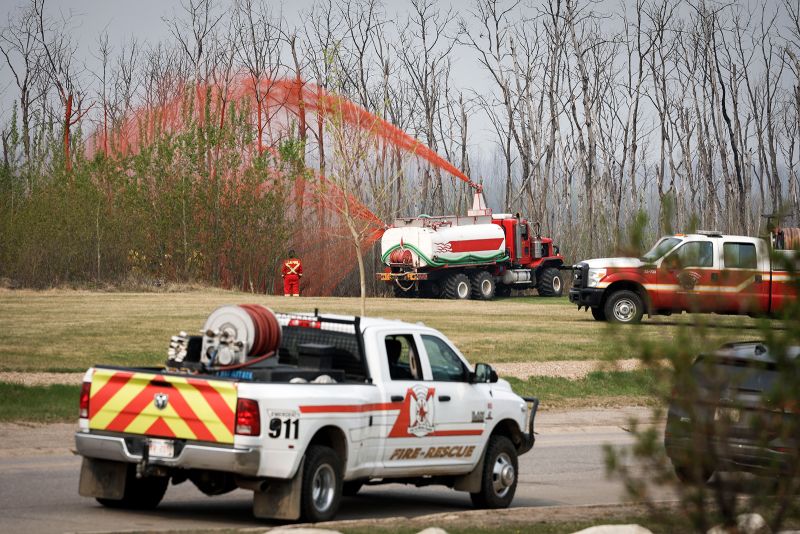
CNN’s featured image shows a pumper truck spraying fire retardant on trees around the evacuated neighborhood of Beacon Hill in Fort McMurray, Alberta, Canada, on Wednesday.Jeff McIntosh/The Canadian Press/AP, 16 May, 2024
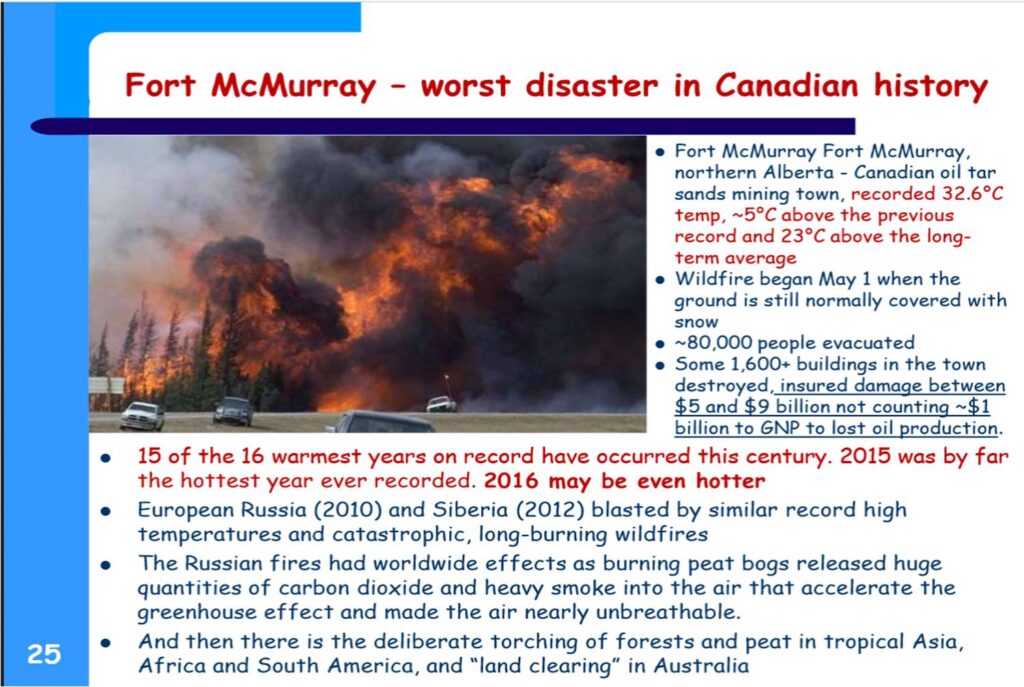
Some of the fires are resurging from overwintering remnants of last year’s unprecedented holocaust in the boreal forests. This is assisted by continuing droughts, increasing temperatures, and minimal snowfallls. Ft McMurray, that was partially cremated in 2018 with $ billions in damage costs and the commercial and residential center of the tar sands (dirty!) oil producing district, is again being evacuated under threat from a repeat by another monster blaze. Other population centers are also under threat.
Clouds of smoke, toxic aerosols, and greenhouse gases are already spreading into the higher Arctic and over the northern United States.
It’s likely that the Russian taiga (boreal) forests and tundra are also beginning to burn as they did in 2019 – 2021 (see Portents for the Future – 2020 Wildfires on the Siberian Permafrost). This alone will keep temperatures rising unless we can reduce the constant input of solar energy enough so Earth can again radiate (mostly long wavelengths of IR) more energy than it receives. If we don’t do this soon, Earths ecosystems will be collapsing at a steeply accelerating rate over a few more decades until no accessible carbon is left in the geosphere – i.e., after most life save a few preadapted extremophiles – are left.
To stop the warming we will have to join in total global mobilization to geoengineer zero new emissions, draw down a substantial fraction of the presently existing GHGs to open the atmospheric windows for more IR emissions to escape Earth, and to increase Earth’s reflectivity enough to significantly reduce the absorption of solar energy. Led by America, the West was able to achieve this kind of mobilization to win WWII in little more than 4 years from the start of America’s joining the fray at the end of 1941. Such mobilizations need to be managed and led by governments, however, most current governments of the world (including Australia) are controlled by puppet-masters in the fossil fuel and related industries who are actively blocking any attempts to initiate effective action.
For our species to have any chance in any kind of sustaining biosphere, our mobilization must begin with replacing fossil fuel puppets in our ‘majority’ controlled governments with climate aware and progressive Greens and community independents who understand the issues and work for their constituents rather than their (often non-citizen) puppet masters.
@VoteClimateOne and Climate Rescue Accord can show you how to do this legally and ethically in the next available elections. See https://voteclimateone.org.au.
Views expressed in this post are those of its author(s), not necessarily all Vote Climate One members.
“Climate change is a highway, not a cliff, and we can still take the exit ramp. (Michael E. Mann | September 14, 2023)”: something I have written many times. The trouble is, humanity doesn’t seem to be making any effort to slow down enough to make the turn onto what is likely to be a narrow and difficult road back up the hill…..
It is also important to recognize that climate change isn’t a cliff that we go off at certain thresholds of planetary warming such as the oft-discussed 1.5°C (2.7°F) warming level, though it is often framed that way. Climate action isn’t a binary case of “success” or “failure.”
A better analogy is that it’s a dangerous highway we’re going down. We need to take the earliest exit ramp possible. Dangerous climate change impacts, as we have seen, are already being felt — in the form of devastating droughts, heatwaves, wildfires, floods, and superstorms. Supply chains have been disrupted through a combination of a pandemic — which is likely at least in part a result of ecological destruction — and more extreme weather, sometimes with disastrous consequences, such as shortages of baby formula. Extreme heat is leading to substantial decreases in worker productivity, costing the US economy alone nearly 100 billion dollars a year. Dangerous climate change cannot be avoided. It’s already here.
So, it’s a matter of how bad we’re willing to let it get. Worse impacts can be avoided if we limit the warming below 1.5°C (2.7°F). But if we miss that exit off the carbon emissions highway, 2°C (3.6°F) is certainly preferable to 2.5°C (4.5°F). And if we miss that exit, 2.5°C (4.5°F) is certainly preferable to 3°C (5.4°F). Consider, for example, the matter of species extinction. The IPCC estimates as much as fourteen percent of species could be lost at 1.5°C (2.7°F) warming and eighteen percent at 2°C (3.6°F). Tragic for sure, but greater rates of extinction are expected from other unchecked human activities, including habitat destruction and human exploitation of animals.
However, the number climbs to twenty-nine percent at 3°C (5.4°F), thirty-nine percent at 4°C (7.2°F), and forty-eight percent at 5°C (9°F). Half of all species would, by any reasonable standard, constitute a sixth extinction event rivaling the great extinctions of Earth’s geological past. But that is avoidable in a scenario of meaningful climate action.
Despite the breathless claims of climate-driven mass extinction that one sees all too often in today’s headlines, we are not yet remotely committed to such a future. We can avoid catastrophic climate impacts if we take meaningful actions to address the climate crisis. Yes, that’s an important “if.” But the science actually tells us it’s doable. …
My only complaint here, is that Mann is not a biologist with much knowledge of species extinctions and ecosystem collapses accompanied by all kinds of chaos intertwined with the breakdown of complex dynamical systems. The side roads he lists are not smooth easy roads like the superhighway.
1 October – we’re off to a fast start on the downhill run to oblivion
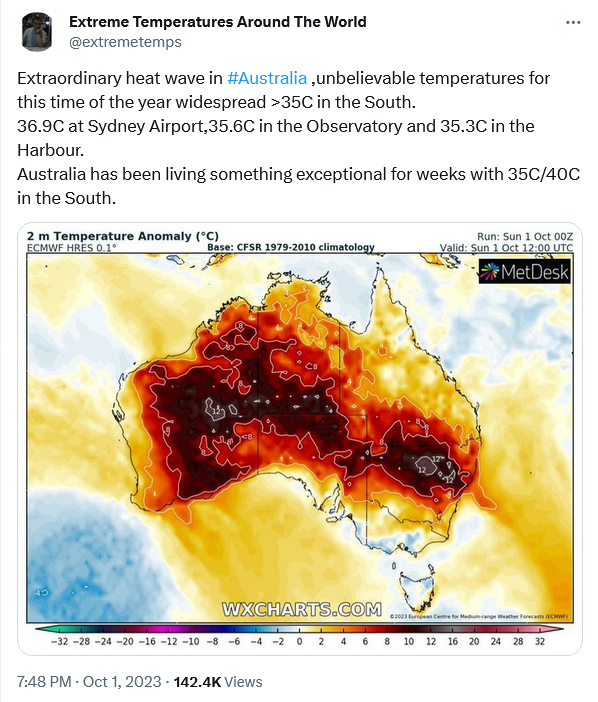
https://twitter.com/extremetemps/status/1708403503670980738. In case you can’t read the fine print the grey anomaly areas are 12 °C above the baseline average for the location — hence the wildfires. Today, on 4 October they’re more normal; but at least in Victoria, we’re seeing major flooding.
Burning of the North American boreal forests
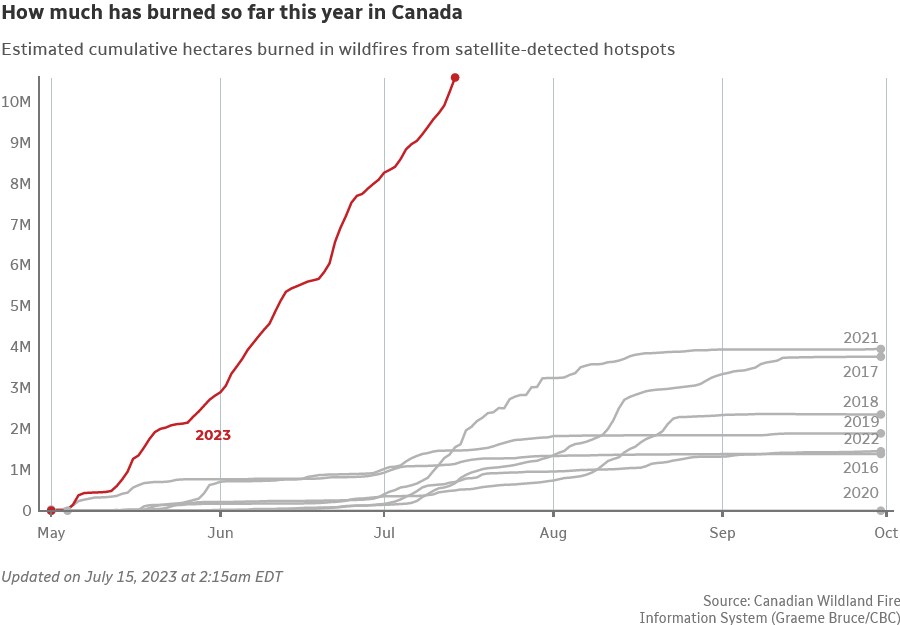
CBC NEWS: Five charts to help understand Canada’s record-breaking wildfire season
Taking a look back at the impacts of the country’s unprecedented fire season
Lethal humidity driving more extreme extremes: Mexico’s major Pacific Coast resort city of Acapulco, comprehensively trashed by Otis!
The result of a 30 hour rapid intensification of a tropical storm into a category 5 killer hurricane is the near destruction of this famous resort city followed by total social breakdown of its million inhabitants leading to mass looting of the necessities of life not directly destroyed by the storm. Some 80% of the luxury highrise hotels and condominiums have been damaged – many to the extent that their innards have literally been blown out the windows. Cut off by avalanches and washed out roads and broken communications systems, the Mexican government has reported 39 deaths, while numerous social media videos show highrises with their innards literally blown out through their walls. Having visited Acapulco a couple of times in the course of fieldwork for my PhD thesis, like the situation in Derna, I find the extent of the recent damage difficult to comprehend.
Almost completely lost in the news is the fact that Cabo San Lucas (the tip of the Baja California Peninsula) was also being trashed by Cat 1 hurricane Norma almost simultaneously with the destruction of Acapulco
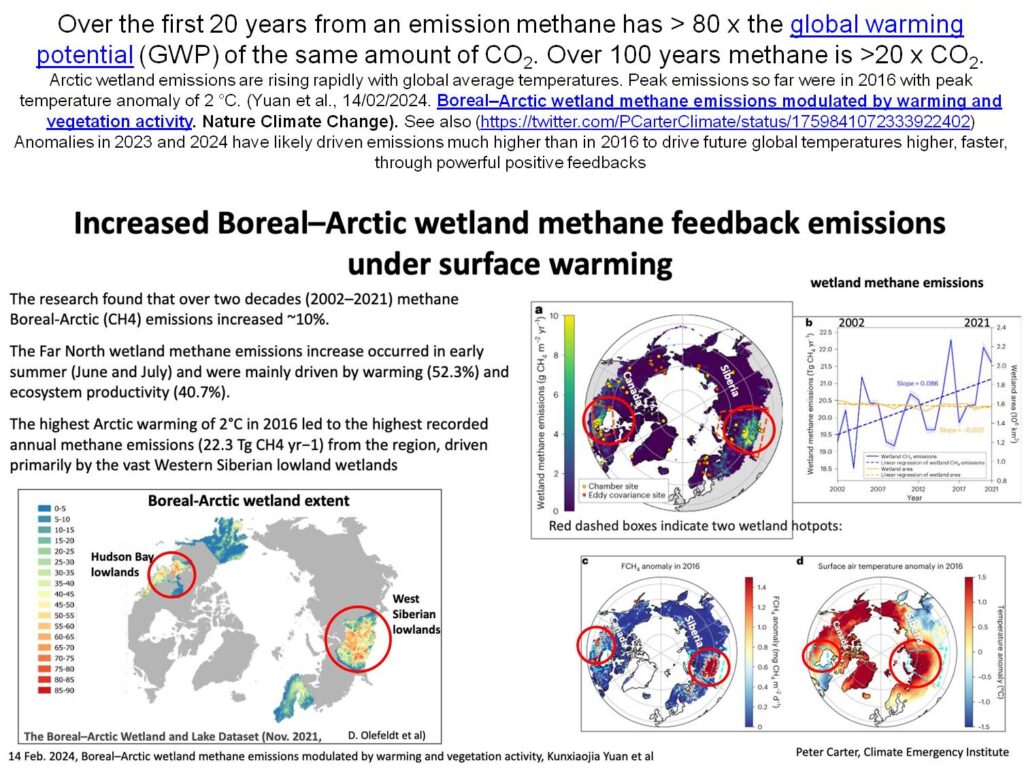
The permafrost zone is expected to be a substantial carbon source to the atmosphere, yet large-scale models currently only simulate gradual changes in seasonally thawed soil. Abrupt thaw will probably occur in <20% of the permafrost zone but could affect half of permafrost carbon through collapsing ground, rapid erosion and landslides. Here, we synthesize the best available information and develop inventory models to simulate abrupt thaw impacts on permafrost carbon balance. Emissions across 2.5 million km2 of abrupt thaw could provide a similar climate feedback as gradual thaw emissions from the entire 18 million km2 permafrost region under the warming projection of Representative Concentration Pathway 8.5. While models forecast that gradual thaw may lead to net ecosystem carbon uptake under projections of Representative Concentration Pathway 4.5, abrupt thaw emissions are likely to offset this potential carbon sink. Active hillslope erosional features will occupy 3% of abrupt thaw terrain by 2300 but emit one-third of abrupt thaw carbon losses. Thaw lakes and wetlands are methane hot spots but their carbon release is partially offset by slowly regrowing vegetation. After considering abrupt thaw stabilization, lake drainage and soil carbon uptake by vegetation regrowth, we conclude that models considering only gradual permafrost thaw are substantially underestimating carbon emissions from thawing permafrost.
Good coverage by the Financial Times on the new study on the risk of Atlantic Ocean circulation instability, citing a number of experts. #AMOC
It’s a secret Cabinet document that has @CSIRO urging #ClimateActionNow to prevent catastrophic weather events and other serious adverse environmental effects from occurring. The only reason I have access to it is because it’s 34 years old. #auspolpic.twitter.com/Qu0dc6moB9
📈According to the #ERA5dataset, the 7 days from 3rd to 9th July 2023 were the 7 hottest days on record globally, making the first week of July 2023 the hottest week on record.
Thanks again for the detailed assessment @RARohde!
"An analysis suggests that removing the sulfate aerosols may have added ~0.2 °C (~0.4 °F) to the North Atlantic region. This would not explain all of the present North Atlantic spike, but may have added to its severity." https://t.co/vkZAaTzuDZpic.twitter.com/QkJTBtL5Bi
In Norway they tax the fossil fuel industry & give free university education to young people. In Australia we subsidise the fossil fuels & charge people a fortune to go to uni…decisions about taxing & spending are much more important than droning on about budget deficits #auspolpic.twitter.com/mkof2xFc4n
As reported by @WeatherProf, Manatee Bay, FL, recorded an astonishing sea surface temperature (SST) of 101.1°F (38.4°C) at a depth of 5' today, and also hit 100.2°F (37.9°C) yesterday — common hot tub temperatures! An SST of 101.1°F could be a world record. A 🧵 1/9 pic.twitter.com/r4uupDCsv7
The very hot sea surface temperatures (SST) in the North Atlantic roughly coincide with exceptionally weak winds in June, see https://t.co/5Cr6SsXHTJ. A contributing mechanism could be rather shallow wind-mixed surface layers of a few tens of meters, which heat up more quickly… pic.twitter.com/DMOvFVr0h2
— Prof. Stefan Rahmstorf 🌏 🦣 (@rahmstorf) July 13, 2023
What’s this article about, and why is the date in the title important?
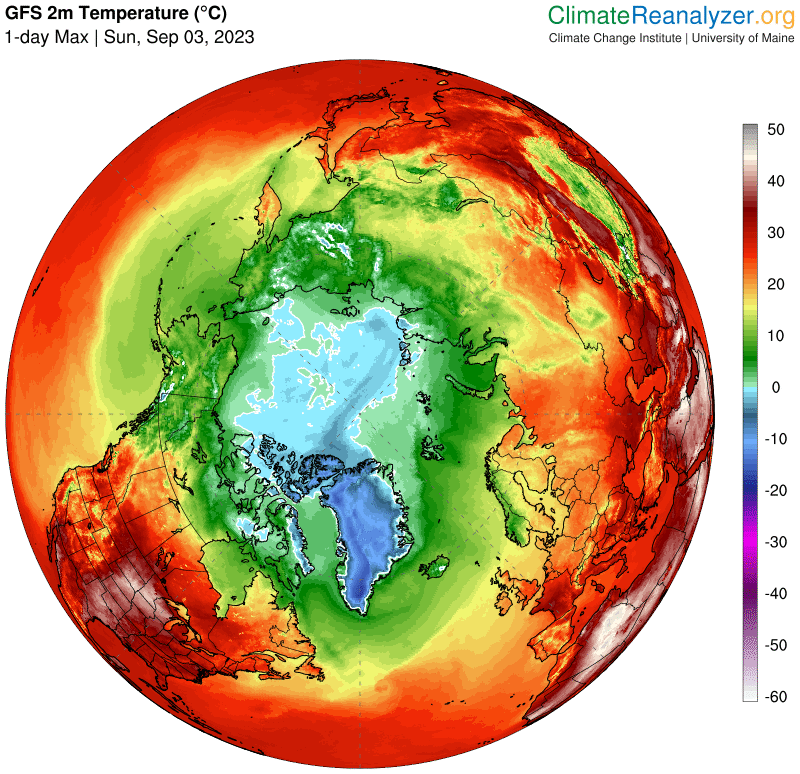
As I write this, the average climate for our WHOLE PLANET is changing so freaking fast we can see visibly measurable changes in the averages from one day to the next! These changes affect the whole 8,000,000,000+ humans and alive today along with all other life on the planet. The charts and maps presented here graphically illustrate measurements of important climate variables up to the last 1 to 4 days. The time gap between the instants of measurement depicted in these plots and when they are printed are due to time delas between:
automatically recording millions of readings from hundreds of thousands of networked physical sensors and more millions of readings from remote sensors on a plethora of artificial satellites whizzing around our revolving planet several times a day (“Intensity of observation”, below, illustrates just how comprehensive the sensor network is);
accumulating and assembling the recorded data over the world-wide communications network;
proofing, processing and tabulating the received data on the world’s largest supercomputers; reanalyzing and plotting the observations in the form of charts and graphs comprehensible to humans;
publishing and publishing these outputs onto the public web, where they are accessible to anyone with a computer and the knowledge to find and understand the representations.
Most of the ongoing climate changes are accelerating in directions and speeds that will inevitably be lethal to the human and many other species within another century, more or less, if the changes are not stopped and reversed. These changes are a direct consequence of an unplanned experiment that humans began around 1½ centuries ago to burn geologically significant quantities of fossil carbon (e.g., coal, oil, ‘natural’ gas) into usable energy and greenhouse gases trapping a significantly increasingly more of the total solar energy received by Planet Earth.
However, some of the combustion energy released by burning fossil carbon has also fueled an exponential growth of knowledge and technology able to produce the plots below. These plots provide the evidence our experiment is changing our global climate system to a state that will have existentially catastrophic consequences for Earth’s complex forms of life. This Hellish state is known as “Hothouse Earth“.
This fact that we can actually see the evidence of our impending doom gives me some hope that our still exponentially improving technology may provide us with the ability to stop further damage caused by our rogue experiment and repair enough of the damage already caused, to allow our species to continue evolving into the foreseeable future.
This raises the unavoidable and fraught question: Do we humans have the political will and capability to marshal and mobilize our technologies to engineer solutions that will allow us to avoid the abyss? This is the single most important issue facing the world today. If we don’t solve it, no other issue matters because — before long — no one will be left to worry about it.
Currently the world’s governments are dominated by puppets of the fossil fuel industry and related interests. They are doing as much as they can to PREVENT, DELAY, or MINIMIZE any actions that might hamper fossil fuel’s greed and short term interests for the world to burn yet more fuel. Hoping that we humans can solve this single, most important issue, VoteClimateOne is working to revolutionize our governments by replacing or changing parliamentary puppets to prioritize actions to solve the climate crisis first. Also, I am writing articles such as this to demonstrate and explain why this revolution is so urgent and necessary.
To demonstrate just how rapidly we are currently moving down the road to doom in what will be Earth’s Hothouse Hell, this article will be updated at least once a week until there is evidence of a downward trend to safer readings.
Measuring progress towards existential catastrophe on Hothouse Earth
First, some definitions
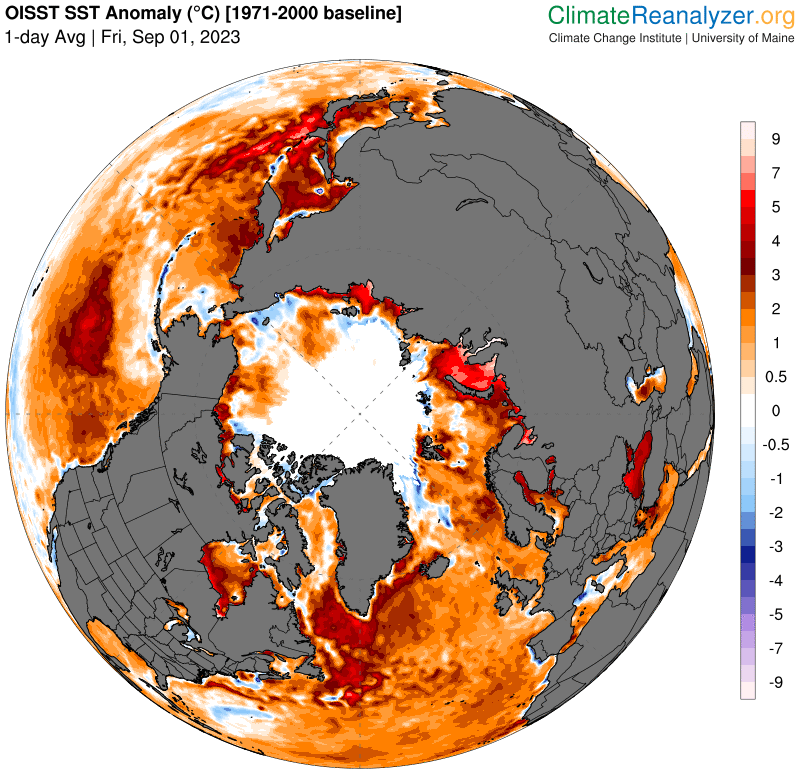
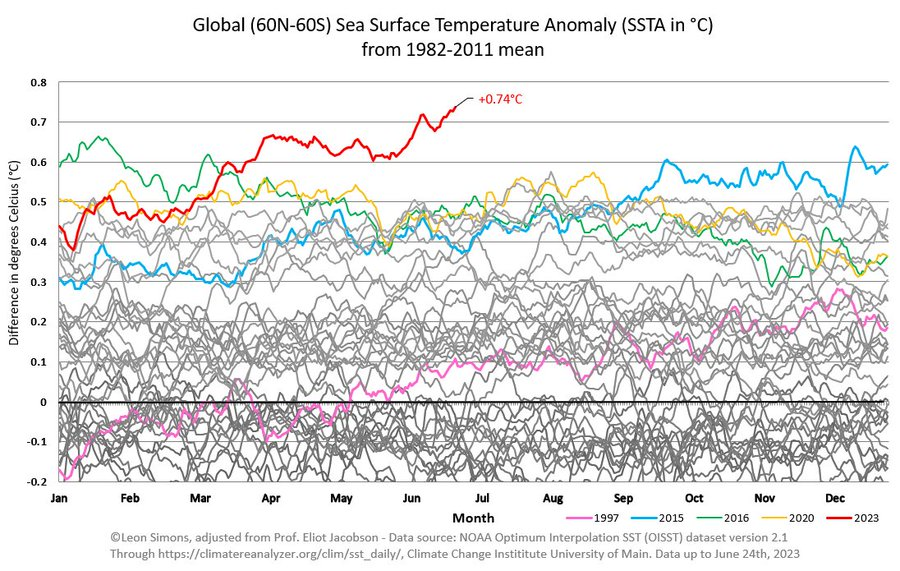
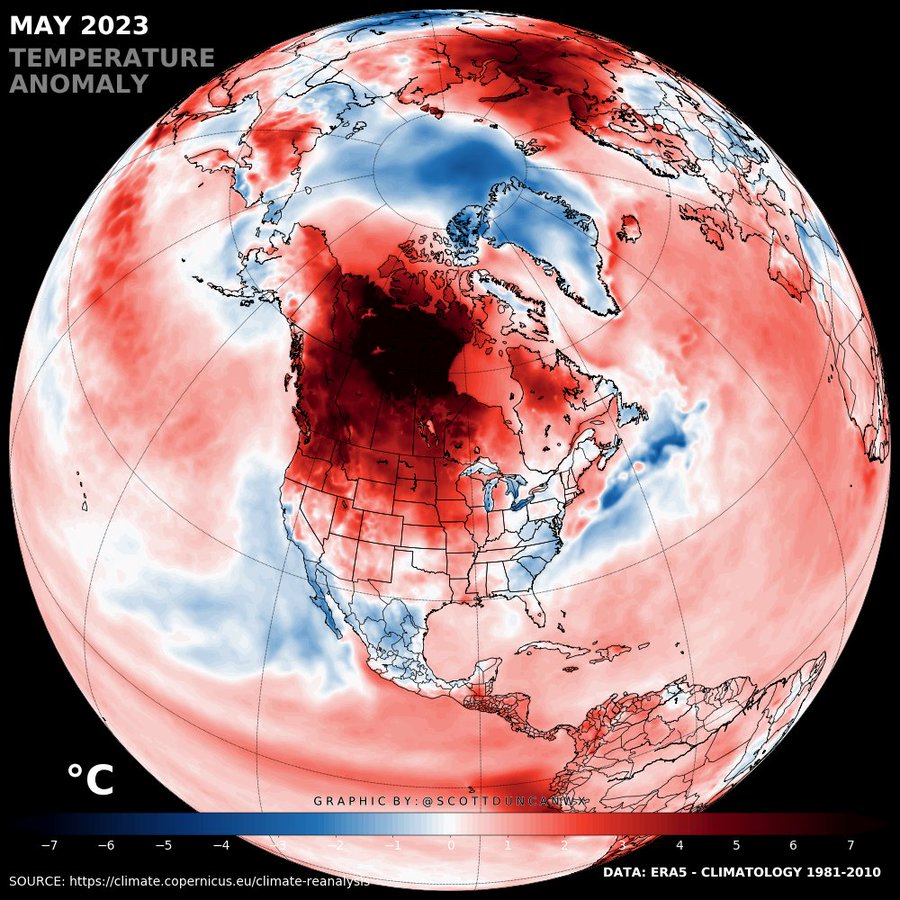
Many of the charts represent values of particular variables averaged over the surface of the whole Earth (or some specified region) at a specified point or interval of time. Most maps use colors to indicate the value of a specified variable at a specified point or averaged over an interval of time. In most such cases these measures are presented in the form of “anomalies”. An anomaly is the difference between the particular measurement and the long-term ‘baseline’ average for that measure on that day or interval of the year. For example, the graph immediately below uses a 30 year average (from 1982-2011) for its baseline average. Anomaly plots are particularly useful to highlight changes taking place over time.
Major heat engine domains of the Earth System
Dynamic changes in the Universe through time are driven by spontaneous flows and transformations of energy from ‘sources’ at high potential to entropy and ‘sinks’ at lower potentials (e.g., water flowing down a hill). This flux can be used to drive other processes through a system of coupled interactions forming a thermodynamic system or heat engine. As governed by the universal physical Laws of Thermodynamics (especially the Second Law), as long as there is a potential difference between source and sink, the flux of energy between them will continue to spontaneously flow through the system/heat engine as long as long as the system’s net entropy production remains positive.
The ‘Earth System’ includes all the shell-like layered components of the planet from the edge of outer space to its center. The three main ones concerning us here from inside out are the geosphere, hydrosphere, and atmosphere. The biosphere formed in the interface between atmosphere and geosphere (on the planetary scale) is a microscopically thin turbulent layer of carbonaceous macromolecules and water combined with other elements and molecules exhibiting the properties of life. We humans form part of that biosphere.
The heat engines described here circulate masses of matter that transport heat energy from place to place within the Earth System.
Geosphere
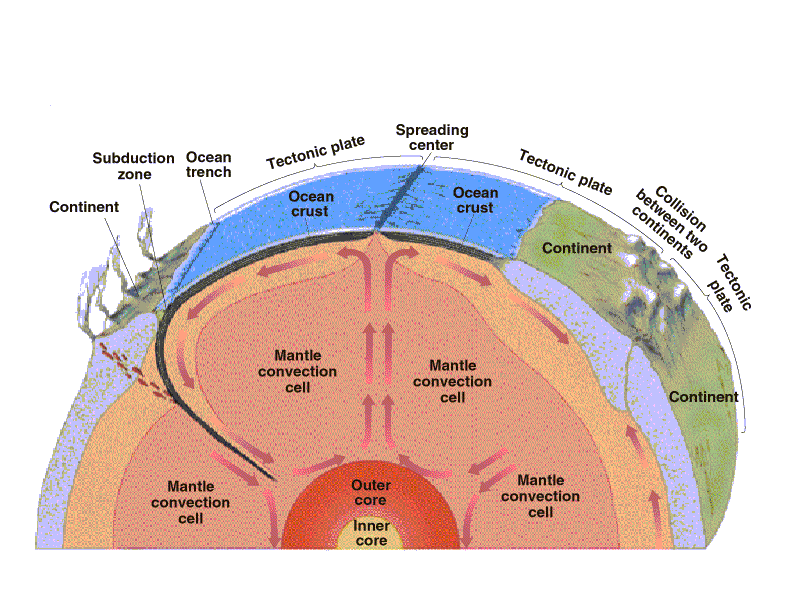
The geosphere comprises Planet Earth’s, solid (‘rocky’) components. The geosphere’s heat engine is based on the geologically slow process of plate tectonics that drives continental drift.
Geological heat engine at work.
The engine is driven by the slow radioactive decay of unstable isotopes of elements such as potassium, uranium and thorium remaining from the formation of Earth some 4.5 billion years ago. Enough heat has and is being generated by this decay to melt the planet’s core and heat and expand the overlying mantle rocks enough to make them less dense and plastic enough for them to form convection cells like you see in a pan of nearly boiling water. Hotter and less dense rocks float up towards Earth’s harder crust and spread out (carrying surface crust and even lighter continental rocks, i.e., ‘plates’) to become cool enough for gravitational force to pull the solidified plates back towards the molten core in subduction zones that also form oceanic trenches.
Heat transported from radioactive decay is released into the hydrosphere and atmosphere from conduction through the crust + hot springs and geysers; by molten basalt lava coming to the surface in oceanic and terrestrial spreading (‘rift zones’); and volcanoes associated with localized ‘hot spots of rising magma or with the rift zones. Lavas associated with the latter type of volcanoes are formed of lighter, lower melting point rocks forming a scum on top of the denser crustal rocks of the drifting plates.
Hydrosphere
Earth’s hydrosphere is the thin film of water between the geosphere and atmosphere forming the salty Ocean covering around 70% of the planetary surface along with lakes and streams of generally nearly salt-free water serving as feeding tendrils draining water condensed from the land. The hydrosphere also includes a solid component of ice and a gaseous component of vapor. These components have very different properties compared to water and each other.
The liquid component of the hydrospheric heat engine absorbs solar energy in the form of heat warming volumes of water, in the form of latent heat of fusion (i.e., melting of ice) absorbing about 80 cal/gm of ice melted, and latent of vaporization (i.e., turning liquid water into an atmospheric gas) absorbing about 540 cal/gm of water vaporized (6.75 times as much energy as required to melt the gm of ice). The heat absorbed becomes ‘latent’ in that the energy transforms the state from liquid to solid or from liquid to gas without changing the measurable or feel-able (i.e., ‘sensible’) temperature of the mass. When the water vapor condenses or the water freezes, of course the latent energies are released in the form of sensible heat.
Basically, the hydrospheric heat engine is driven by the absorption of excess amounts solar radiation (the source) in equatorial, tropical, and subtropical regions of the planet that is mainly carried by ocean currents towards the polar and sub-polar regions where the an excess of heat energy released from water and freezing ice is carried away from the planet in the form of long-wave infrared radiation to the cold sink of outer space. Many different local, regional, and global ocean currents are involved in moving energy around the planetary sphere. Proportionately, a small amount of geothermal heat energy is absorbed from the geospheric heat engine by water, and larger amounts of heat are exchanged with the atmospheric heat engine(s) in a variety of ways.
Water has some very peculiar properties that play very important roles in the climate system and biospheric systems, especially around the freezing point. Most materials contract and become denser as they cool. This is also true for pure water, down to a temperature of 4 °C when it begins to expand and become less dense until it begins to freeze. Ice at 0°C is even lighter such that it easily floats. This is because water molecules are shaped like boomerangs with the oxygen atom at the apex and the two hydrogen atoms sticking out at angles. When they are warmer they jitter around in a relatively random way, such that warming makes the molecules jitter faster and further, while as they cool the jitter slows and they come closer such that a given number of molecules take up less space. As the jitter slows further at and below 4 °C, molecules tend to spread out some to form a quasi crystalline structure approaching that of ice where they are more or less locked into that structure, where the solid water is significantly lighter than the liquid. The presence of dissolved salts and minerals depresses the freezing temperature. As as ice freezes, crystallization of the water also tends to concentrate and expel dissolved minerals and gases in extra-cold plumes of particularly dense and very cold salty water (i.e., brine) — cold enough that tubes of ice may form from the less salty water around the brine.
Water is also a god solvent, able to carry substantial amounts of gases, (e.g., oxygen, CO2, methane – CH4), salts, carbonates, nitrates, sulfates, metal ions, etc). The ocean carries a lot of salt – enough to play an important role in the ocean circulation system. Oxygen and CO2 play essential roles in living systems, CO2 and carbonates play important roles in interactions between water, the Geosphere and the atmosphere. CO2 and methane in the atmosphere, along with water vapor, are the most important greenhouse gases, etc…..
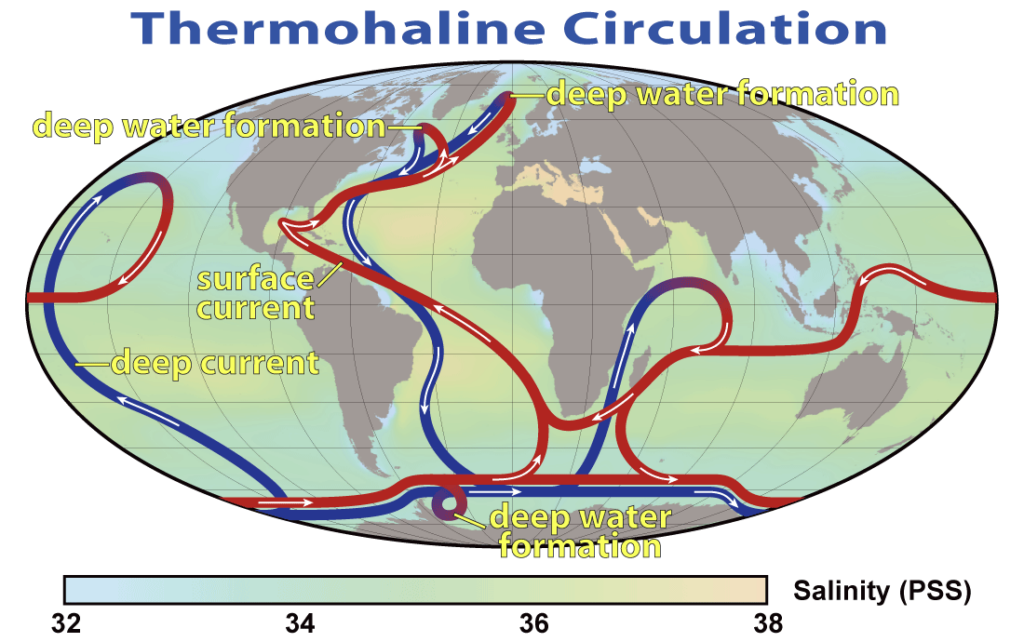
The principal current system driving ocean heat transport is known as the ‘thermohaline circulation‘. Basically, seawater is warmed in the equatorial, tropical and subtropical regions of the world. It also increases in density due to the evaporation of water vapor into the atmosphere. However, parcels of water are kept hot enough that thermal expansion more than compensates for the densification from becoming saltier. However, as currents carry the hot, salty surface water further towards the poles, the water begins to cool until the warm salty water carrying a full load of oxygen becomes dense enough around 4 °C to sink through layers of still warmish but less salty water, carrying a full load of oxygen down to the bottom of the ocean. The salt in this descending water is diluted by mixing with relatively fresh ice water from terrestrial runoffs, melting glacial and sea ice, etc sourced from zones even closer to the poles than where the dense salty water normally sinks.
The main source of power that drives the thermohaline circulation heat engine is the conversion gravitational potential energy in the sinking masses of water as they sink to the ocean floor this sinking helps to pull surface waters into the ‘sinkhole’. Further assists to the circulation are provided by prevailing atmospheric winds pushing surface waters away from continental shores, pulling up cold, deoxygenated, CO2 and mineral rich deep waters to the surface where they fertilize the blooms of micro-algae that add more oxygen and feed the whole food chains of larger organisms in the oceans.
Atmosphere
Biosphere
The global sea surface temperature anomaly broke into all-time record for the day of the year around 15 March, suggesting that the average rate of warming may be shifting into a new regime where the rate of ocean-surface warming is skyrocketing.
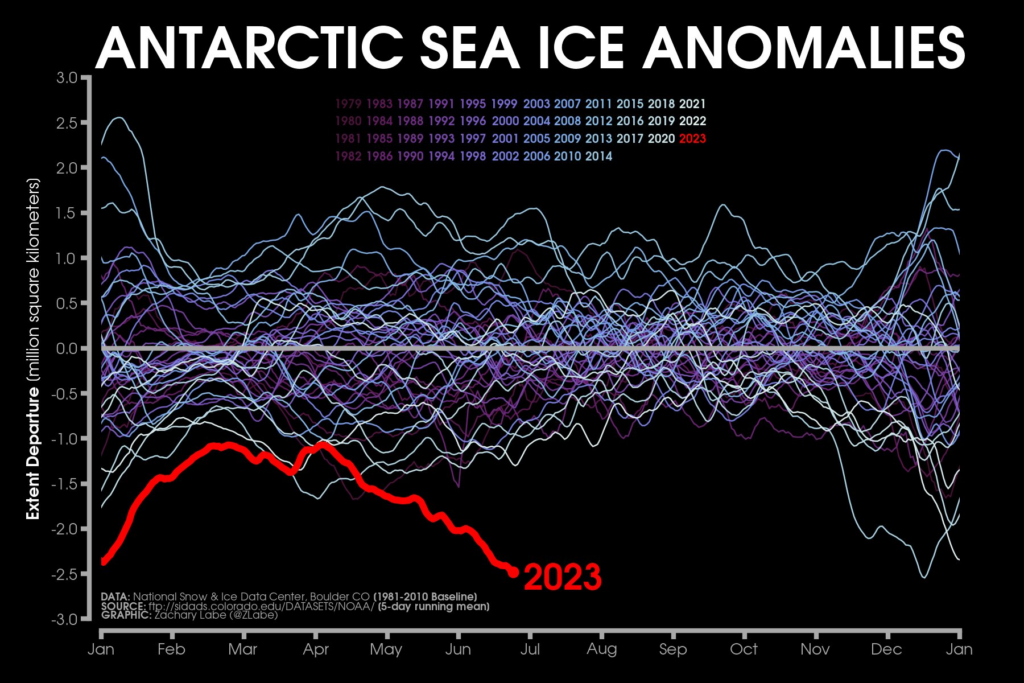
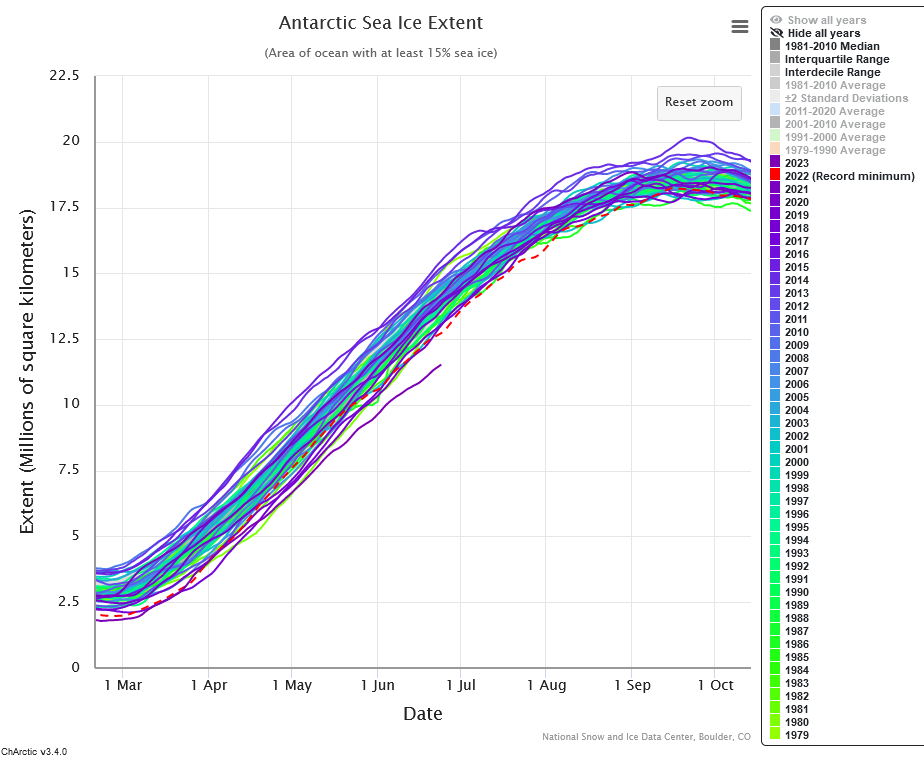
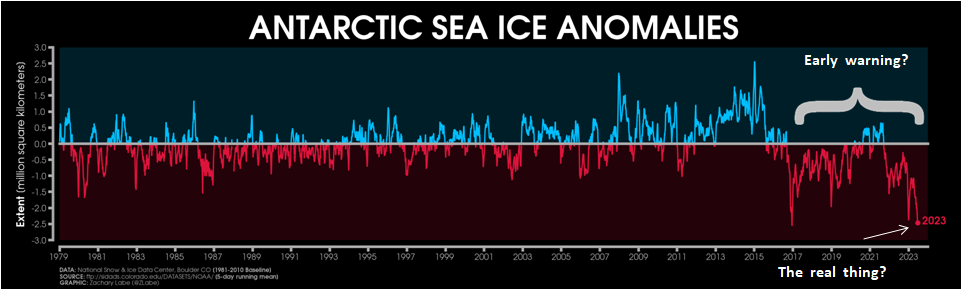
Around the same time the global average sea-surface temperature began to skyrocket, the rate of sea-ice formation around Antarctica slowed — as would be expected if the surrounding ocean was becoming progressively warmer than has ever before been the case for this time of the year.
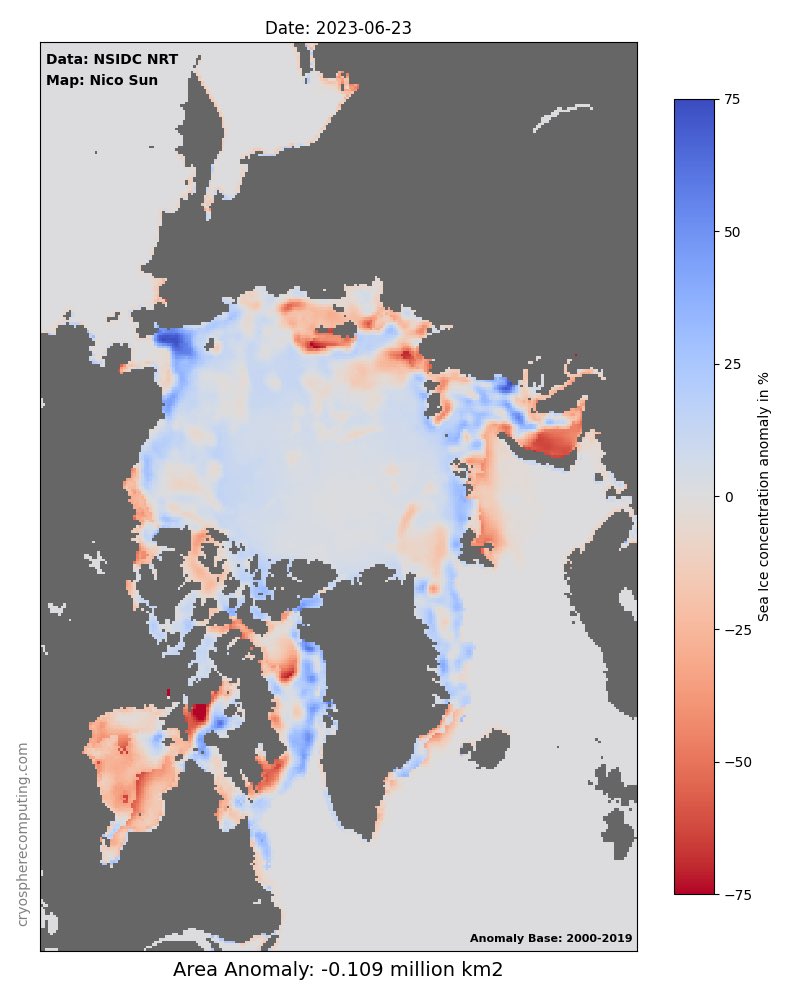
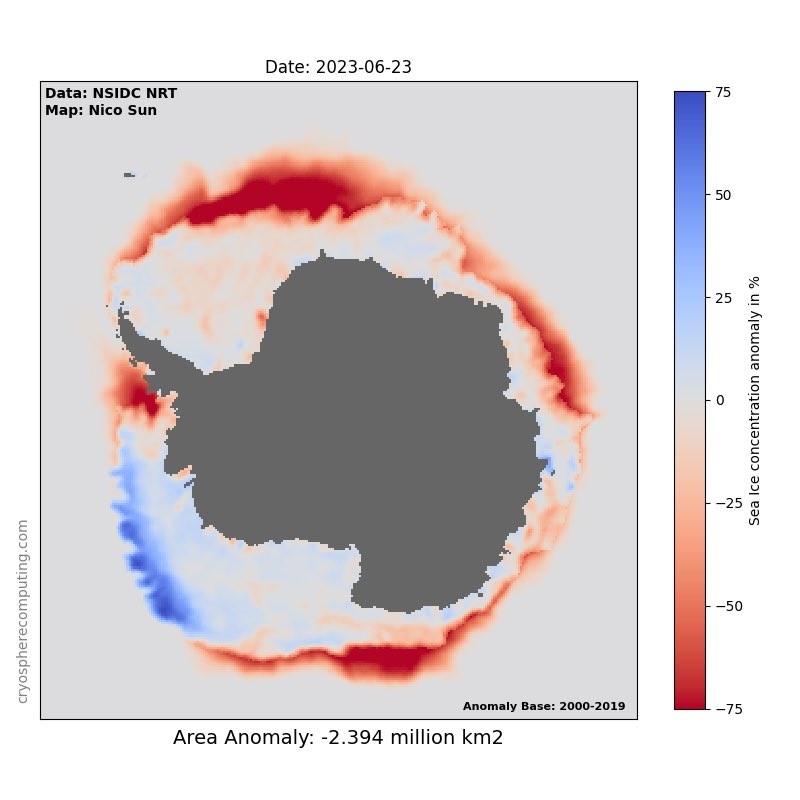
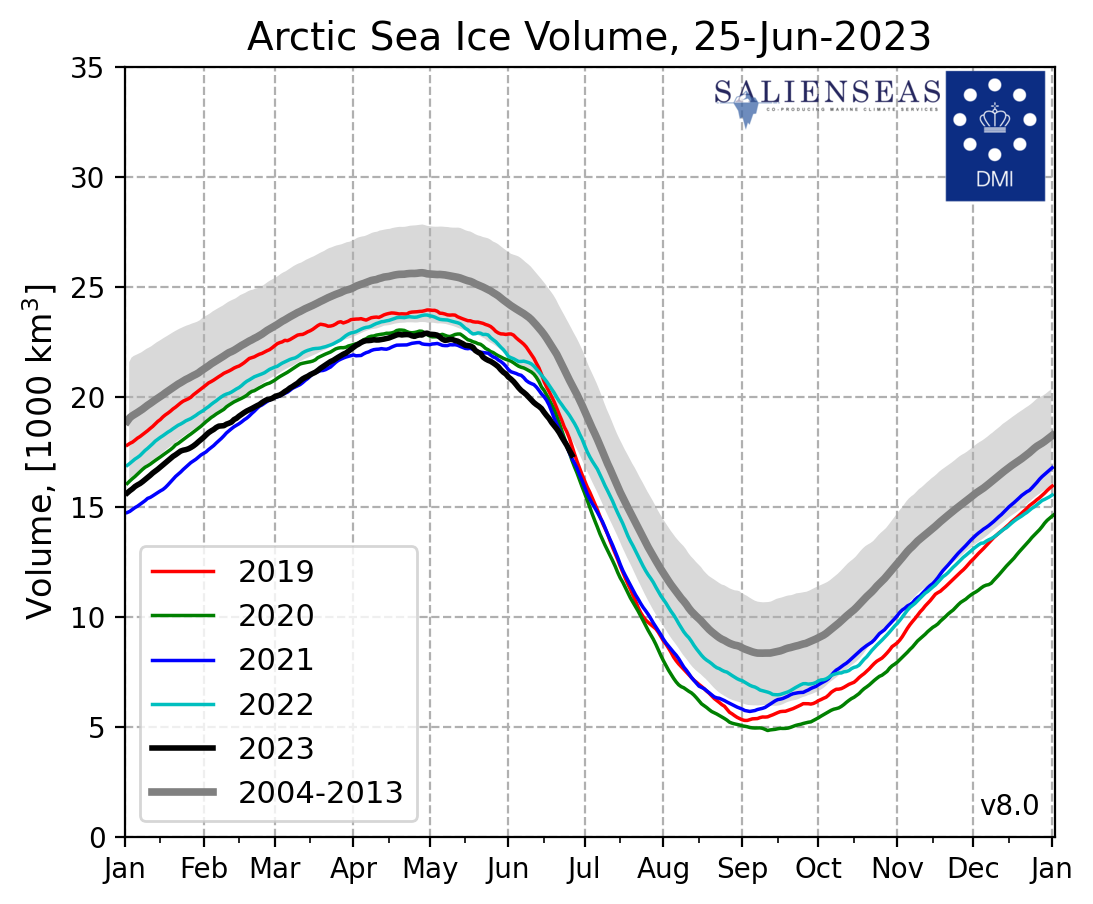
Anomalies in the areas covered by polar sea ice on 23 June. Note
Sea ice extent anomaly is strongest in the Weddell Sea region
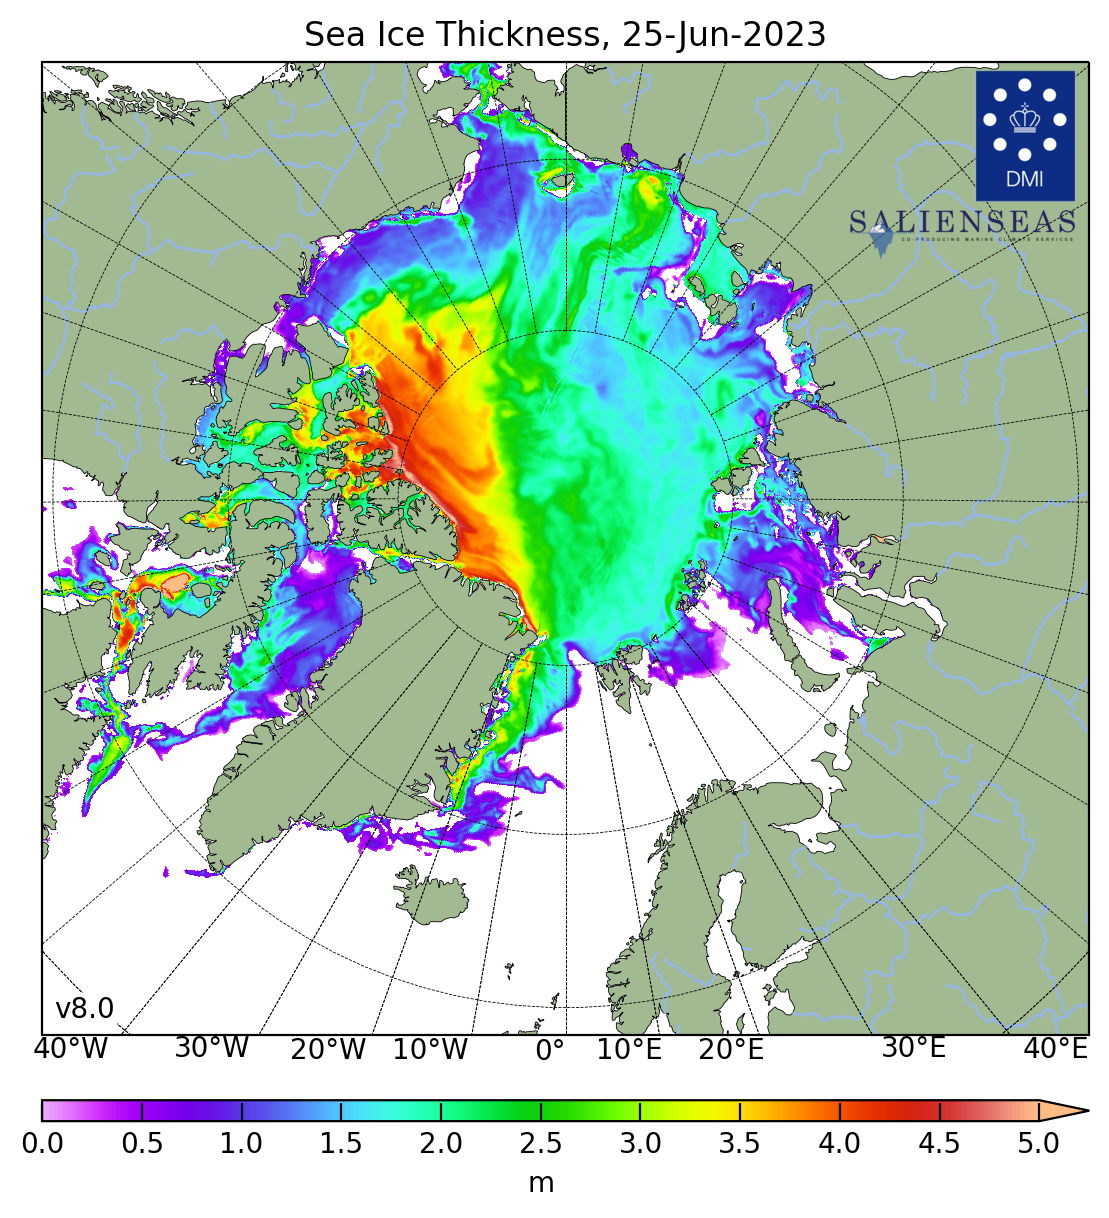
So far, melting of the Arctic sea ice has not been particularly exceptional. With regard to sea-ice at both poles, it is also important to consider thickness and volume. Ice that is only a meter or two thick is accumulated in the winter when there is no solar heating (sun largely or completely below the horizon) normally only a year old. Solid ice reflects most of the solar energy heating it. However, the thinner the ice is, the faster it can melt as it begins to heat under the summer sun and possibly even rain(!), to say nothing of warm currents from the tropics. Around the North Pole, all of the bluish and purple ice shown in the map below can disappear fairly quickly as summer continues to leave open ocean to absorb most of the solar energy striking it that will delay freezing in the following winter. (Danish Arctic Research Institutions Polar Portal).
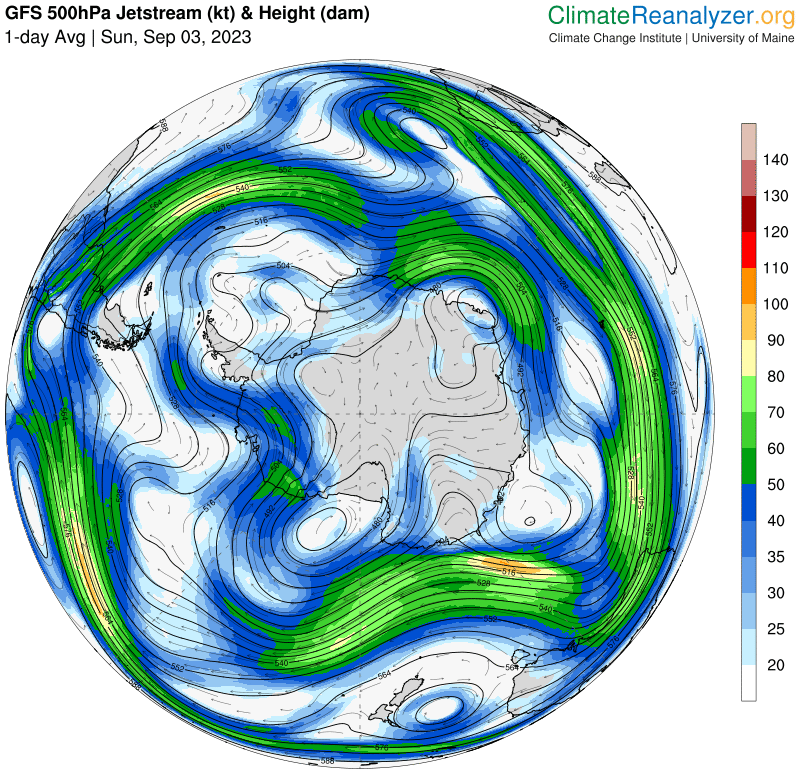
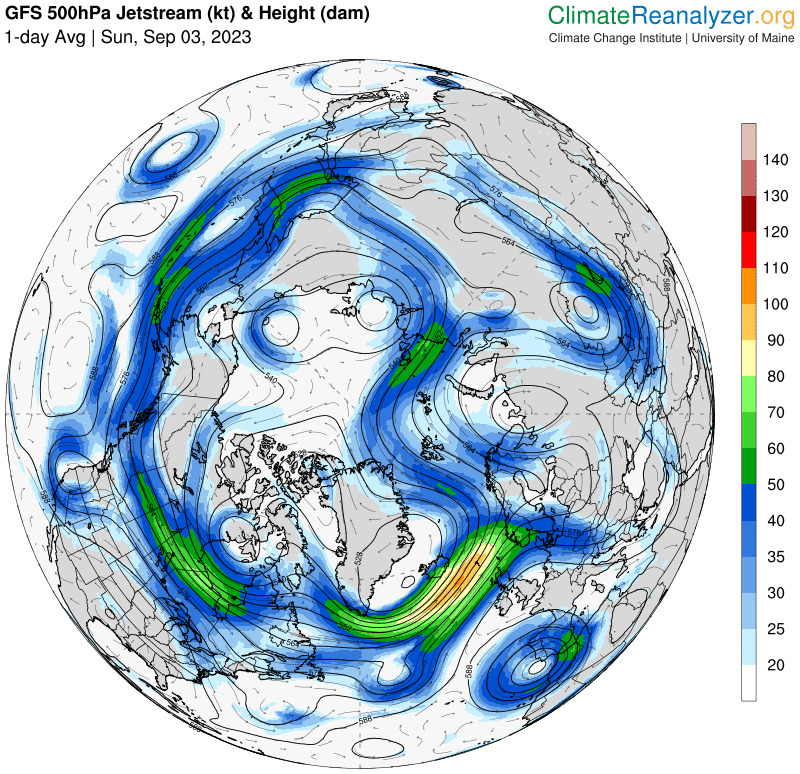
Jetstreams
Continental effects
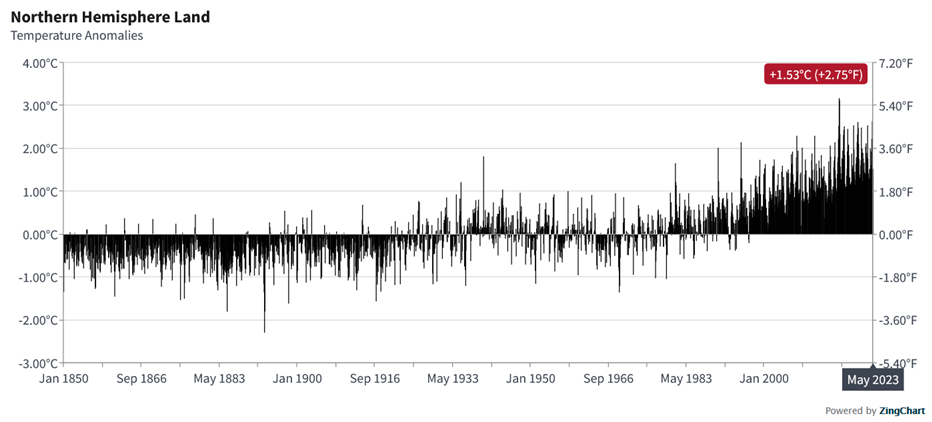
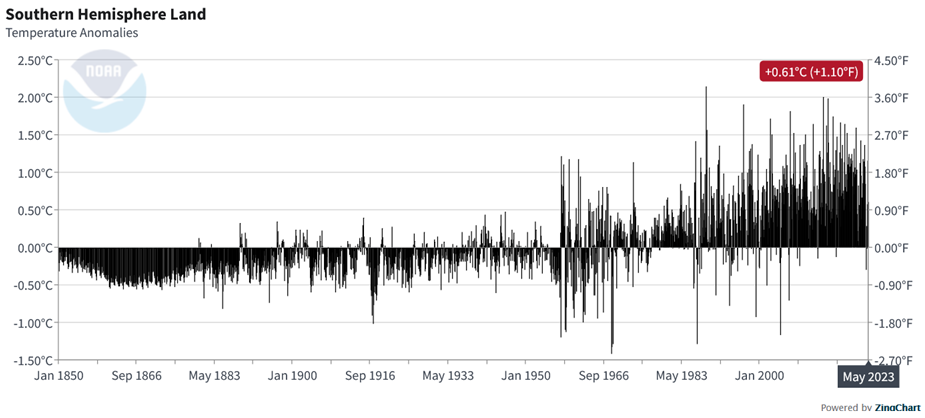
Northern Hemisphere
Plots are from https://www.ncei.noaa.gov/access/monitoring/climate-at-a-glance/global/time-series/nhem/land/all/1/1850-2023
Is all this part of an early warning that a tipping point is being approached…. Or is it the real thing?
A hint to how much you can trust claims of reality denying trolls, puppets, and the like, is provided by the number monitoring points that physically monitor the atmosphere at those locations around the surface of the planet we live on used PER DAY.
Atmospheric monitoring
The European Centre for Medium-Range Weather Forecasts (ECMWF) for the charts plotted on 25 June 2023 as shown below are based on measurements from 173,296 locations. Note 1: this map does not NOT include ocean monitoring points. Note 2: The DATA COLLECTED EVERY DAY by this web of sensors is available to, used, and interpreted by several different national and institutional climate monitoring centers. In other words, the conclusions are cross checked between different centers many times over. The charts above depict scientific facts, not hunches and personal opinions.
Oceanographic monitoring
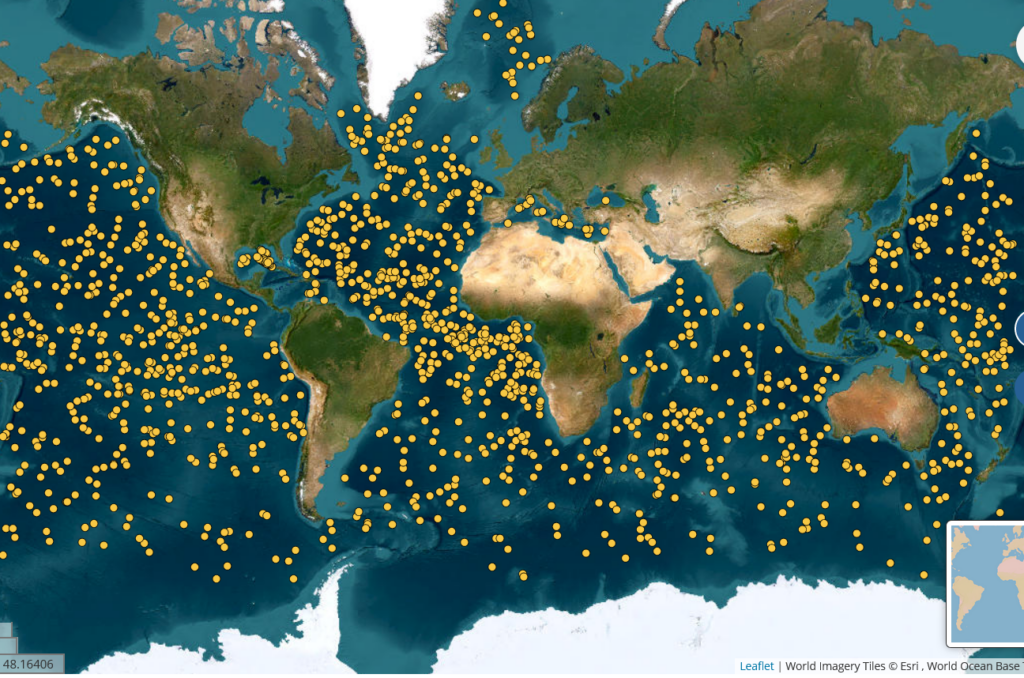
Argo
Argo floats profiles physical properties of the surrounding water, minimally ocean temperature, salinity, pressure (i.e., depth). Each float operates on a 10 day cycle, spending most of the cycle ‘resting’ at an intermediate depth. On the 10th day it sinks to a specified depth and begins recording inputs from its sensors as it floats up to the surface. The standard float sinks to a depth of 2 km (2,000 m) and records all the way up to the surface, where it then determines its GPS position to within a few meters and messages a passing relay satellite with its location and profile data before sinking to its resting depth waiting for the next profile position. As shown on the world map here, printed 26 June 2023, shows the locations of profiles received over the last 10 days (i.e., only the last cycle of currently operational floats): 3,625 profiles. Of these 1,481 recorded the profile from 2 km deep in the ocean to the surface. Some floats are designed to sink to the bottom and thus record a profile for the full depth of the ocean. A few include several additional sensors to levels for things like acidity, oxygen, nitrate, light level, and some more I don’t recognize. The Argo system is really quite amazing.
Some even have ice sensors allowing them to operate even in ice-covered waters by warning if they might be fatally damaged by striking ice overhead. For these, if they sense ice, they’ll record the profile in memory, and drop back and rest until the next cycle (which may again prevent surfacing). These interrupted cycles will keep repeating until the float can safely surface — in which case all of the aborted profiles will be messaged to the satellite relay along with the current one (better late than never!)
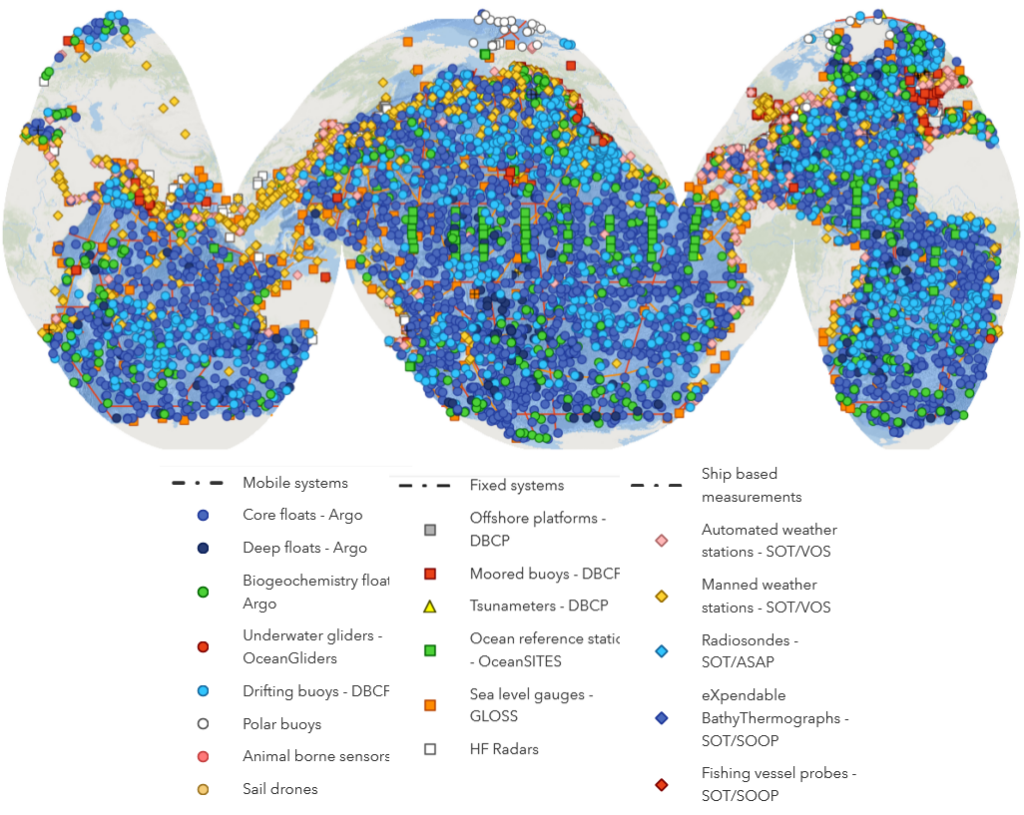
And then there is a plethora of other ocean sensor systems. The full gamut of them shown next. The various different types are named in the legend. Collectively, on 26 June 2023, the ocean sensing system measuring in-situ variables includes 7973 ‘platforms’ (including the different kinds of Argo Floats) and results from 104 ‘cruises’ of ships ranging from specialized oceanographic vessels to fishing boats. Some of these non-Argo systems also record partial or complete (i.e., to the bottom) profiles.
And then there are the numerous remote sensing satellite systems………. whose data fill gaps between physical sensors and whose measurements are cross calibrated between physical and remote sensors.
Almost all of the data collected from the range of sensors is freely accessible via the public World Wide Web.
Views expressed in this post are those of its author(s), not necessarily all Vote Climate One members.
As if a planetary system is going to pay an iota of attention to what Iowa thinks. New law says state regulations must ignore climate change!
The only people who will suffer will be those harmed by and dying from increasingly extreme weather events as a consequence of global warming from the fossil fuel industry’s continued contributions to Earth’s greenhouse layer.
Blind stupidity driven by boundless greed! You have to read the article to understand just how stupid and greedy some American legislators can be…