Global Climate Change 26/06/2023
What’s this article about, and why is the date in the title important?
As I write this, the average climate for our WHOLE PLANET is changing so freaking fast we can see visibly measurable changes in the averages from one day to the next! These changes affect the whole 8,000,000,000+ humans and alive today along with all other life on the planet. The charts and maps presented here graphically illustrate measurements of important climate variables up to the last 1 to 4 days. The time gap between the instants of measurement depicted in these plots and when they are printed are due to time delas between:
- automatically recording millions of readings from hundreds of thousands of networked physical sensors and more millions of readings from remote sensors on a plethora of artificial satellites whizzing around our revolving planet several times a day (“Intensity of observation”, below, illustrates just how comprehensive the sensor network is);
- accumulating and assembling the recorded data over the world-wide communications network;
- proofing, processing and tabulating the received data on the world’s largest supercomputers; reanalyzing and plotting the observations in the form of charts and graphs comprehensible to humans;
- publishing and publishing these outputs onto the public web, where they are accessible to anyone with a computer and the knowledge to find and understand the representations.
Most of the ongoing climate changes are accelerating in directions and speeds that will inevitably be lethal to the human and many other species within another century, more or less, if the changes are not stopped and reversed. These changes are a direct consequence of an unplanned experiment that humans began around 1½ centuries ago to burn geologically significant quantities of fossil carbon (e.g., coal, oil, ‘natural’ gas) into usable energy and greenhouse gases trapping a significantly increasingly more of the total solar energy received by Planet Earth.
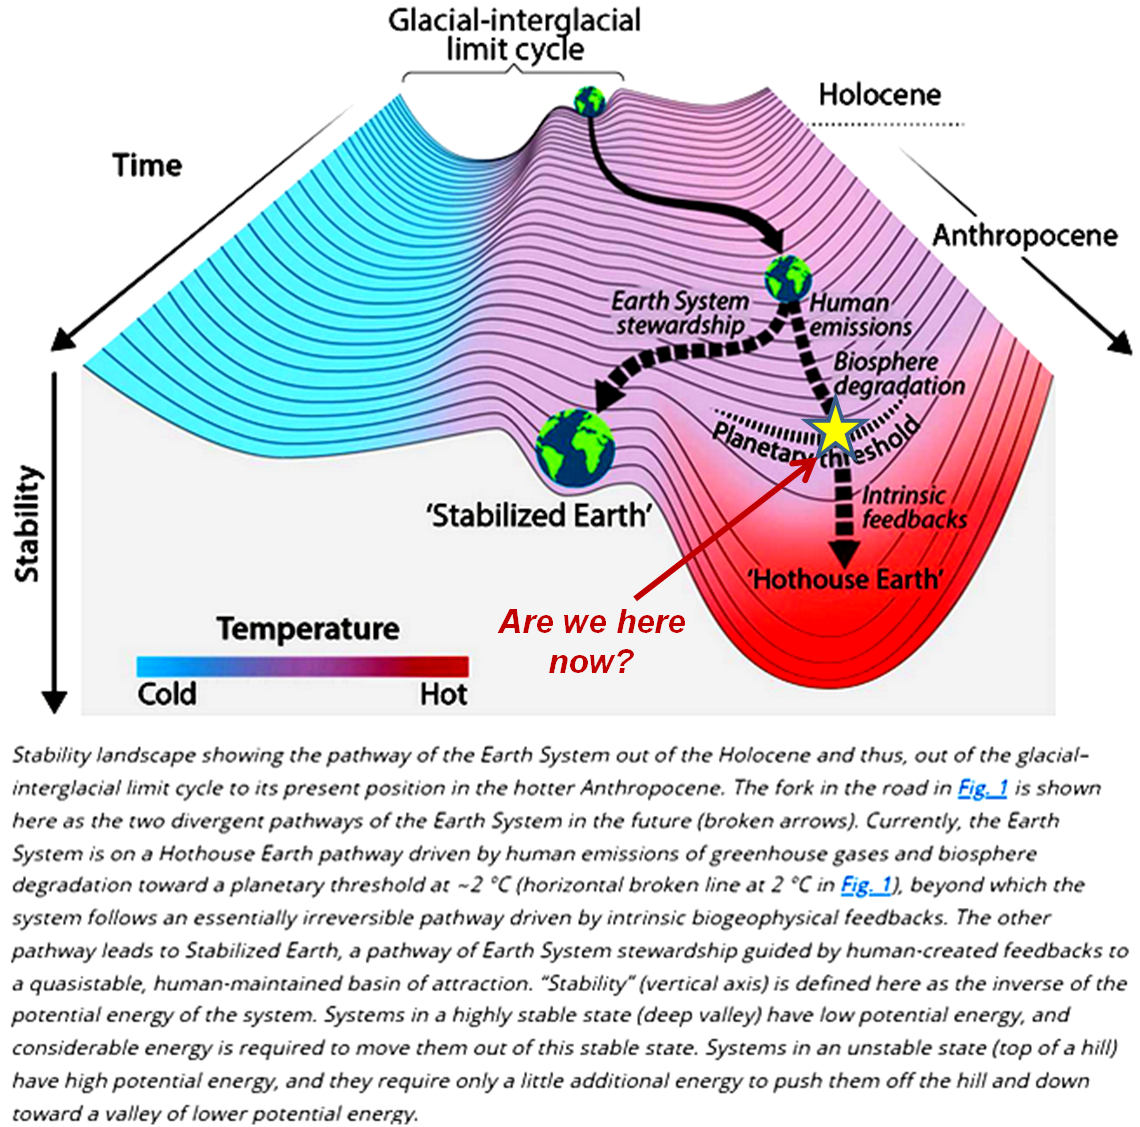
However, some of the combustion energy released by burning fossil carbon has also fueled an exponential growth of knowledge and technology able to produce the plots below. These plots provide the evidence our experiment is changing our global climate system to a state that will have existentially catastrophic consequences for Earth’s complex forms of life. This Hellish state is known as “Hothouse Earth“.
This fact that we can actually see the evidence of our impending doom gives me some hope that our still exponentially improving technology may provide us with the ability to stop further damage caused by our rogue experiment and repair enough of the damage already caused, to allow our species to continue evolving into the foreseeable future.
This raises the unavoidable and fraught question: Do we humans have the political will and capability to marshal and mobilize our technologies to engineer solutions that will allow us to avoid the abyss? This is the single most important issue facing the world today. If we don’t solve it, no other issue matters because — before long — no one will be left to worry about it.
Currently the world’s governments are dominated by puppets of the fossil fuel industry and related interests. They are doing as much as they can to PREVENT, DELAY, or MINIMIZE any actions that might hamper fossil fuel’s greed and short term interests for the world to burn yet more fuel. Hoping that we humans can solve this single, most important issue, VoteClimateOne is working to revolutionize our governments by replacing or changing parliamentary puppets to prioritize actions to solve the climate crisis first. Also, I am writing articles such as this to demonstrate and explain why this revolution is so urgent and necessary.
To demonstrate just how rapidly we are currently moving down the road to doom in what will be Earth’s Hothouse Hell, this article will be updated at least once a week until there is evidence of a downward trend to safer readings.
Measuring progress towards existential catastrophe on Hothouse Earth
First, some definitions
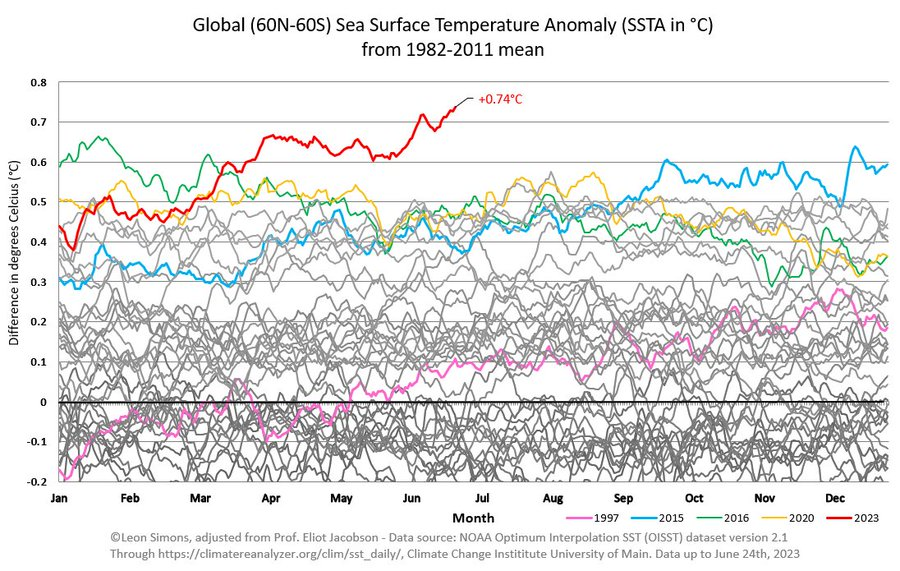
Many of the charts represent values of particular variables averaged over the surface of the whole Earth (or some specified region) at a specified point or interval of time. Most maps use colors to indicate the value of a specified variable at a specified point or averaged over an interval of time. In most such cases these measures are presented in the form of “anomalies”. An anomaly is the difference between the particular measurement and the long-term ‘baseline’ average for that measure on that day or interval of the year. For example, the graph immediately below uses a 30 year average (from 1982-2011) for its baseline average. Anomaly plots are particularly useful to highlight changes taking place over time.
Major heat engine domains of the Earth System
Dynamic changes in the Universe through time are driven by spontaneous flows and transformations of energy from ‘sources’ at high potential to entropy and ‘sinks’ at lower potentials (e.g., water flowing down a hill). This flux can be used to drive other processes through a system of coupled interactions forming a thermodynamic system or heat engine. As governed by the universal physical Laws of Thermodynamics (especially the Second Law), as long as there is a potential difference between source and sink, the flux of energy between them will continue to spontaneously flow through the system/heat engine as long as long as the system’s net entropy production remains positive.
The ‘Earth System’ includes all the shell-like layered components of the planet from the edge of outer space to its center. The three main ones concerning us here from inside out are the geosphere, hydrosphere, and atmosphere. The biosphere formed in the interface between atmosphere and geosphere (on the planetary scale) is a microscopically thin turbulent layer of carbonaceous macromolecules and water combined with other elements and molecules exhibiting the properties of life. We humans form part of that biosphere.
The heat engines described here circulate masses of matter that transport heat energy from place to place within the Earth System.
Geosphere
The geosphere comprises Planet Earth’s, solid (‘rocky’) components. The geosphere’s heat engine is based on the geologically slow process of plate tectonics that drives continental drift.
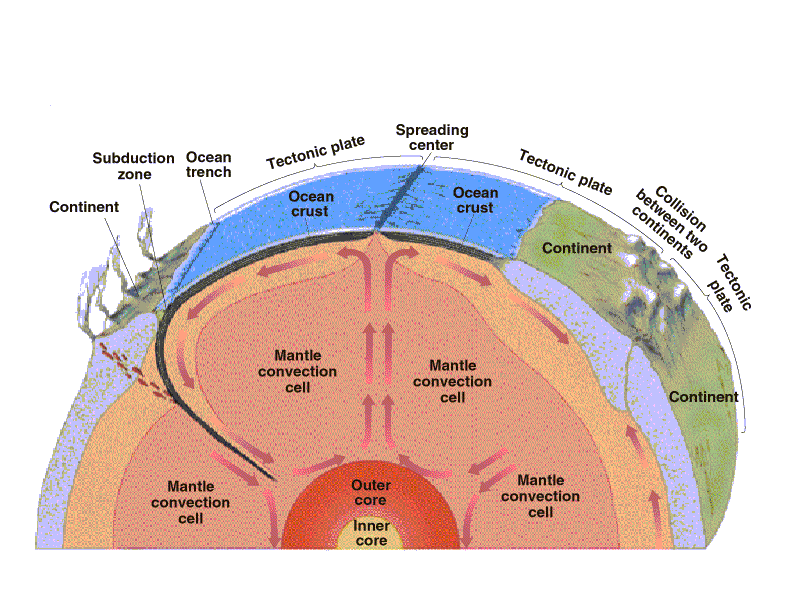
The engine is driven by the slow radioactive decay of unstable isotopes of elements such as potassium, uranium and thorium remaining from the formation of Earth some 4.5 billion years ago. Enough heat has and is being generated by this decay to melt the planet’s core and heat and expand the overlying mantle rocks enough to make them less dense and plastic enough for them to form convection cells like you see in a pan of nearly boiling water. Hotter and less dense rocks float up towards Earth’s harder crust and spread out (carrying surface crust and even lighter continental rocks, i.e., ‘plates’) to become cool enough for gravitational force to pull the solidified plates back towards the molten core in subduction zones that also form oceanic trenches.
Heat transported from radioactive decay is released into the hydrosphere and atmosphere from conduction through the crust + hot springs and geysers; by molten basalt lava coming to the surface in oceanic and terrestrial spreading (‘rift zones’); and volcanoes associated with localized ‘hot spots of rising magma or with the rift zones. Lavas associated with the latter type of volcanoes are formed of lighter, lower melting point rocks forming a scum on top of the denser crustal rocks of the drifting plates.
Hydrosphere

Earth’s hydrosphere is the thin film of water between the geosphere and atmosphere forming the salty Ocean covering around 70% of the planetary surface along with lakes and streams of generally nearly salt-free water serving as feeding tendrils draining water condensed from the land. The hydrosphere also includes a solid component of ice and a gaseous component of vapor. These components have very different properties compared to water and each other.
The liquid component of the hydrospheric heat engine absorbs solar energy in the form of heat warming volumes of water, in the form of latent heat of fusion (i.e., melting of ice) absorbing about 80 cal/gm of ice melted, and latent of vaporization (i.e., turning liquid water into an atmospheric gas) absorbing about 540 cal/gm of water vaporized (6.75 times as much energy as required to melt the gm of ice). The heat absorbed becomes ‘latent’ in that the energy transforms the state from liquid to solid or from liquid to gas without changing the measurable or feel-able (i.e., ‘sensible’) temperature of the mass. When the water vapor condenses or the water freezes, of course the latent energies are released in the form of sensible heat.
Basically, the hydrospheric heat engine is driven by the absorption of excess amounts solar radiation (the source) in equatorial, tropical, and subtropical regions of the planet that is mainly carried by ocean currents towards the polar and sub-polar regions where the an excess of heat energy released from water and freezing ice is carried away from the planet in the form of long-wave infrared radiation to the cold sink of outer space. Many different local, regional, and global ocean currents are involved in moving energy around the planetary sphere. Proportionately, a small amount of geothermal heat energy is absorbed from the geospheric heat engine by water, and larger amounts of heat are exchanged with the atmospheric heat engine(s) in a variety of ways.
Water has some very peculiar properties that play very important roles in the climate system and biospheric systems, especially around the freezing point. Most materials contract and become denser as they cool. This is also true for pure water, down to a temperature of 4 °C when it begins to expand and become less dense until it begins to freeze. Ice at 0°C is even lighter such that it easily floats. This is because water molecules are shaped like boomerangs with the oxygen atom at the apex and the two hydrogen atoms sticking out at angles. When they are warmer they jitter around in a relatively random way, such that warming makes the molecules jitter faster and further, while as they cool the jitter slows and they come closer such that a given number of molecules take up less space. As the jitter slows further at and below 4 °C, molecules tend to spread out some to form a quasi crystalline structure approaching that of ice where they are more or less locked into that structure, where the solid water is significantly lighter than the liquid. The presence of dissolved salts and minerals depresses the freezing temperature. As as ice freezes, crystallization of the water also tends to concentrate and expel dissolved minerals and gases in extra-cold plumes of particularly dense and very cold salty water (i.e., brine) — cold enough that tubes of ice may form from the less salty water around the brine.
Water is also a god solvent, able to carry substantial amounts of gases, (e.g., oxygen, CO2, methane – CH4), salts, carbonates, nitrates, sulfates, metal ions, etc). The ocean carries a lot of salt – enough to play an important role in the ocean circulation system. Oxygen and CO2 play essential roles in living systems, CO2 and carbonates play important roles in interactions between water, the Geosphere and the atmosphere. CO2 and methane in the atmosphere, along with water vapor, are the most important greenhouse gases, etc…..
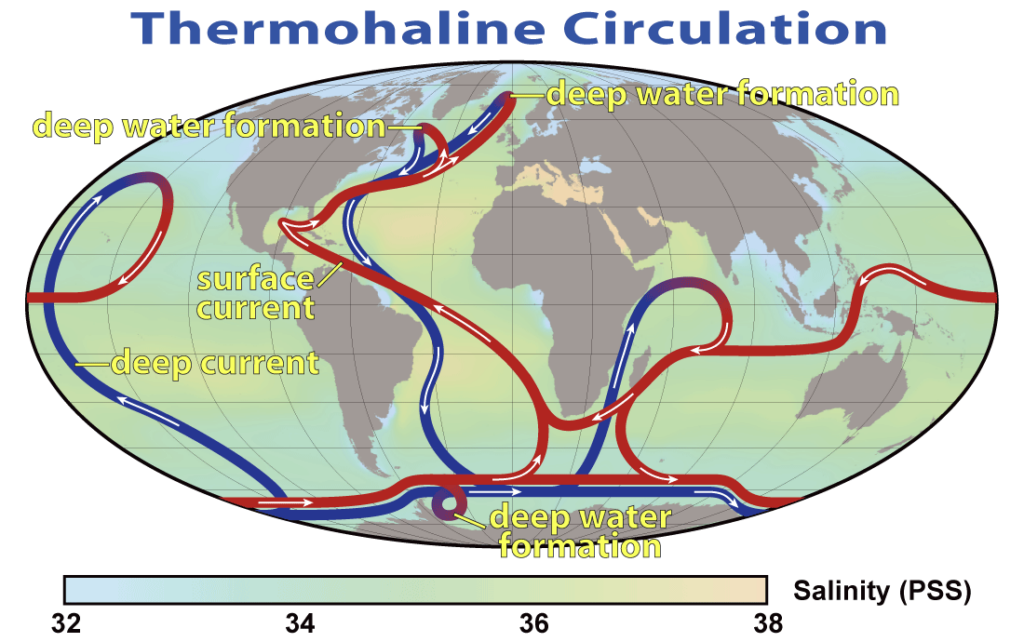
The principal current system driving ocean heat transport is known as the ‘thermohaline circulation‘. Basically, seawater is warmed in the equatorial, tropical and subtropical regions of the world. It also increases in density due to the evaporation of water vapor into the atmosphere. However, parcels of water are kept hot enough that thermal expansion more than compensates for the densification from becoming saltier. However, as currents carry the hot, salty surface water further towards the poles, the water begins to cool until the warm salty water carrying a full load of oxygen becomes dense enough around 4 °C to sink through layers of still warmish but less salty water, carrying a full load of oxygen down to the bottom of the ocean. The salt in this descending water is diluted by mixing with relatively fresh ice water from terrestrial runoffs, melting glacial and sea ice, etc sourced from zones even closer to the poles than where the dense salty water normally sinks.
The main source of power that drives the thermohaline circulation heat engine is the conversion gravitational potential energy in the sinking masses of water as they sink to the ocean floor this sinking helps to pull surface waters into the ‘sinkhole’. Further assists to the circulation are provided by prevailing atmospheric winds pushing surface waters away from continental shores, pulling up cold, deoxygenated, CO2 and mineral rich deep waters to the surface where they fertilize the blooms of micro-algae that add more oxygen and feed the whole food chains of larger organisms in the oceans.
Atmosphere
Biosphere
The global sea surface temperature anomaly broke into all-time record for the day of the year around 15 March, suggesting that the average rate of warming may be shifting into a new regime where the rate of ocean-surface warming is skyrocketing.
Sea ice
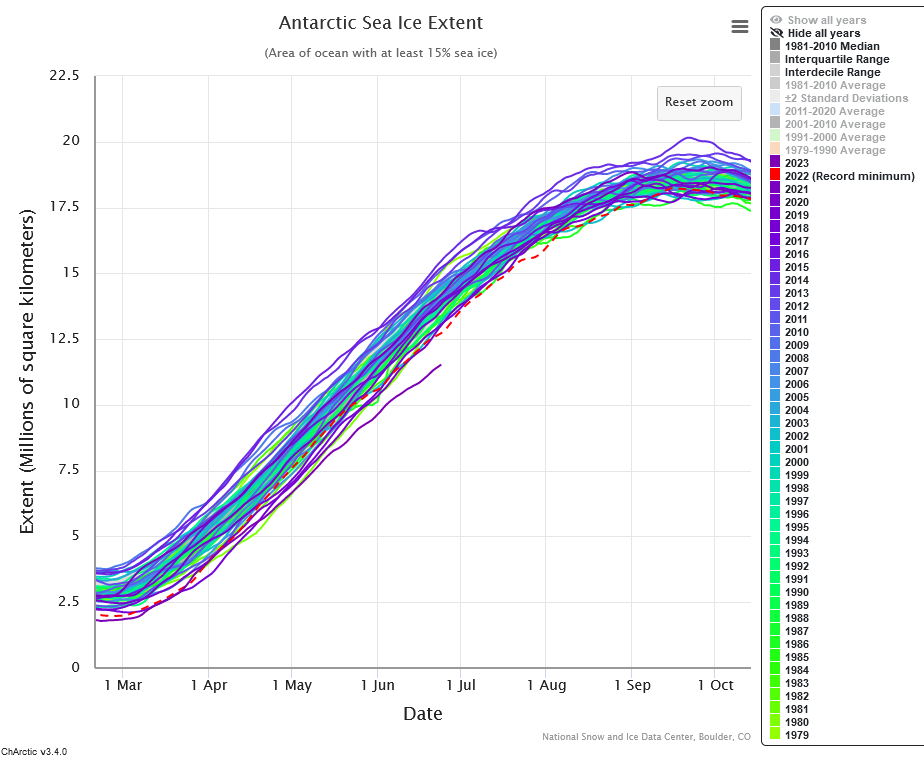
Around the same time the global average sea-surface temperature began to skyrocket, the rate of sea-ice formation around Antarctica slowed — as would be expected if the surrounding ocean was becoming progressively warmer than has ever before been the case for this time of the year.
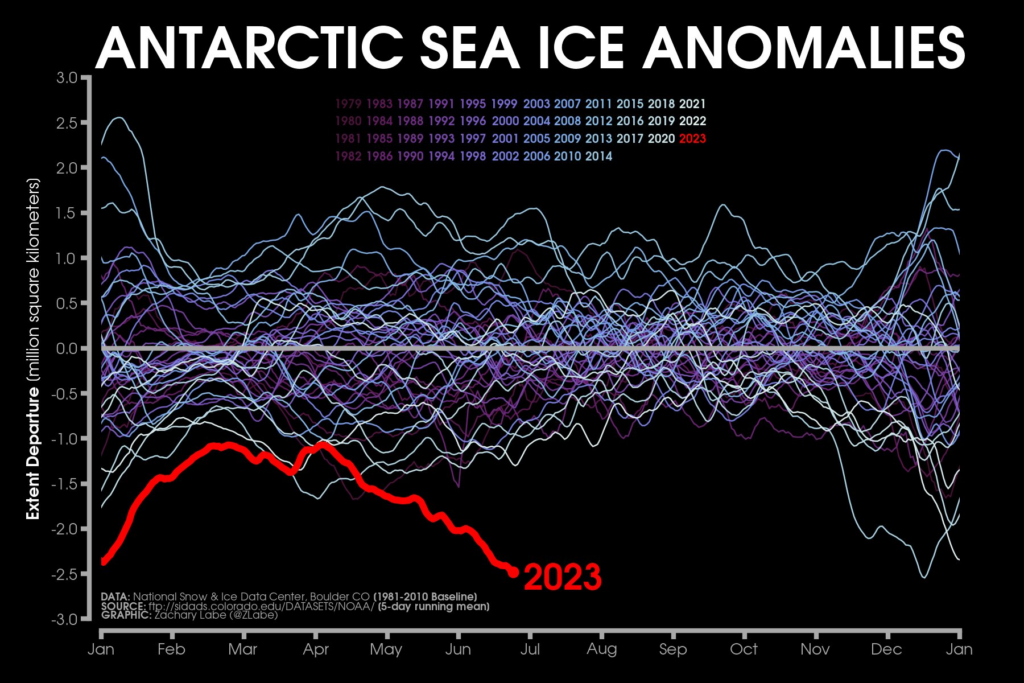
Anomalies in the areas covered by polar sea ice on 23 June. Note
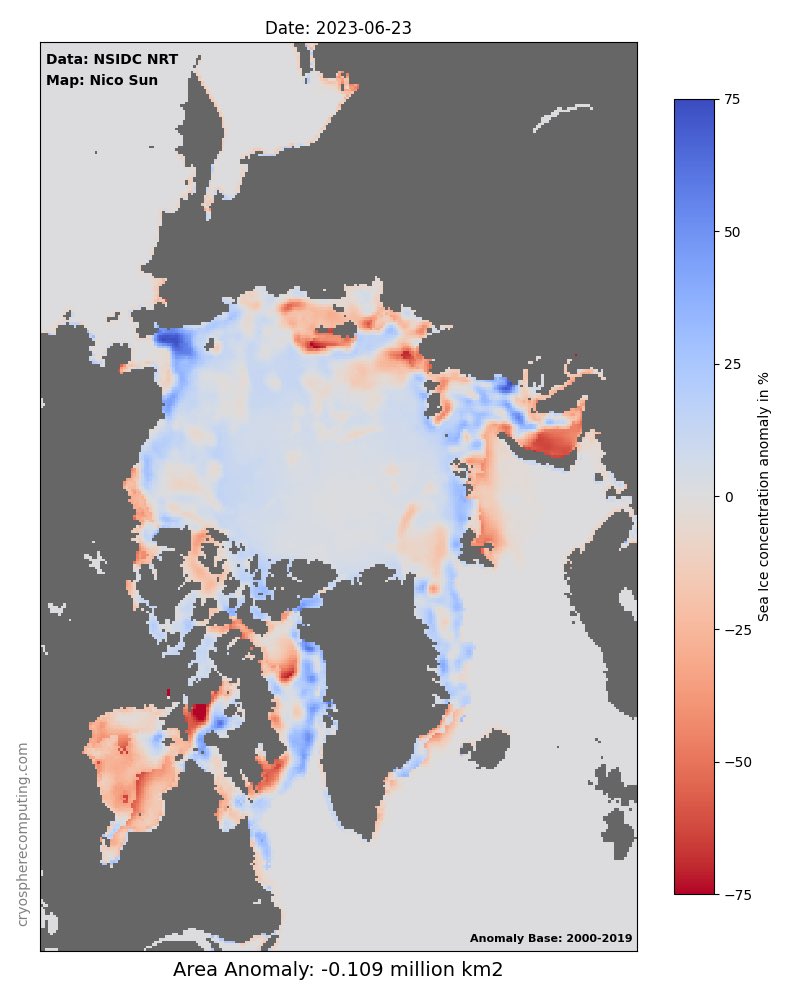
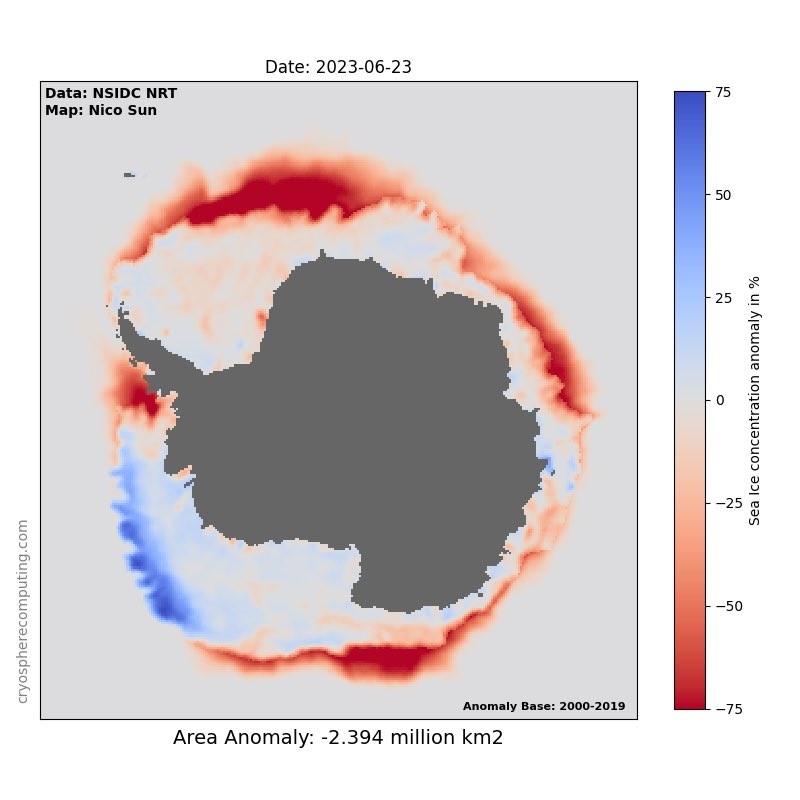
Sea ice extent anomaly is strongest in the Weddell Sea region

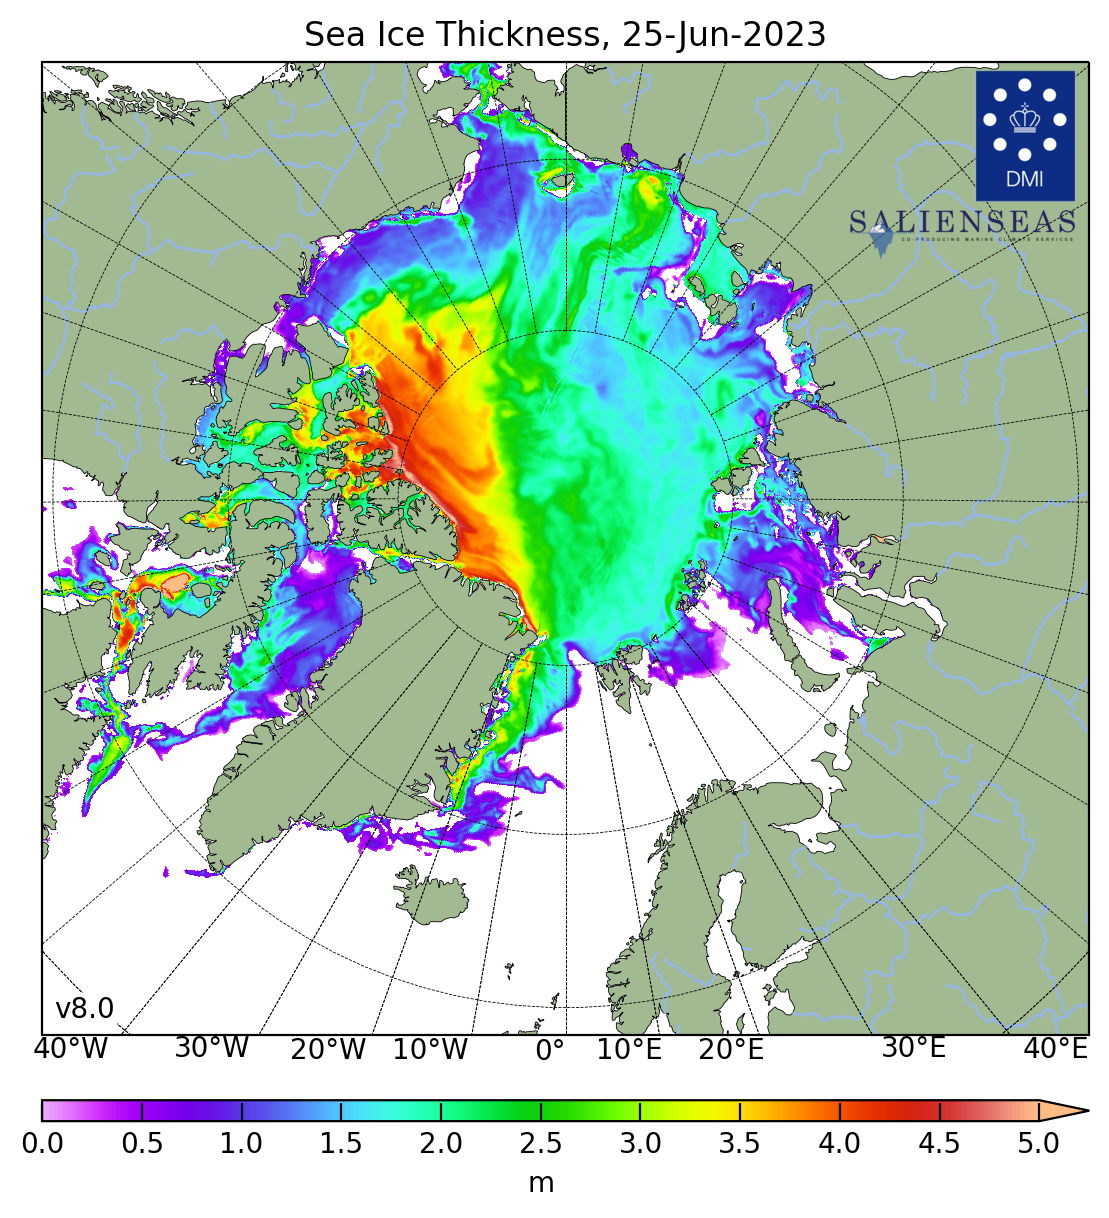
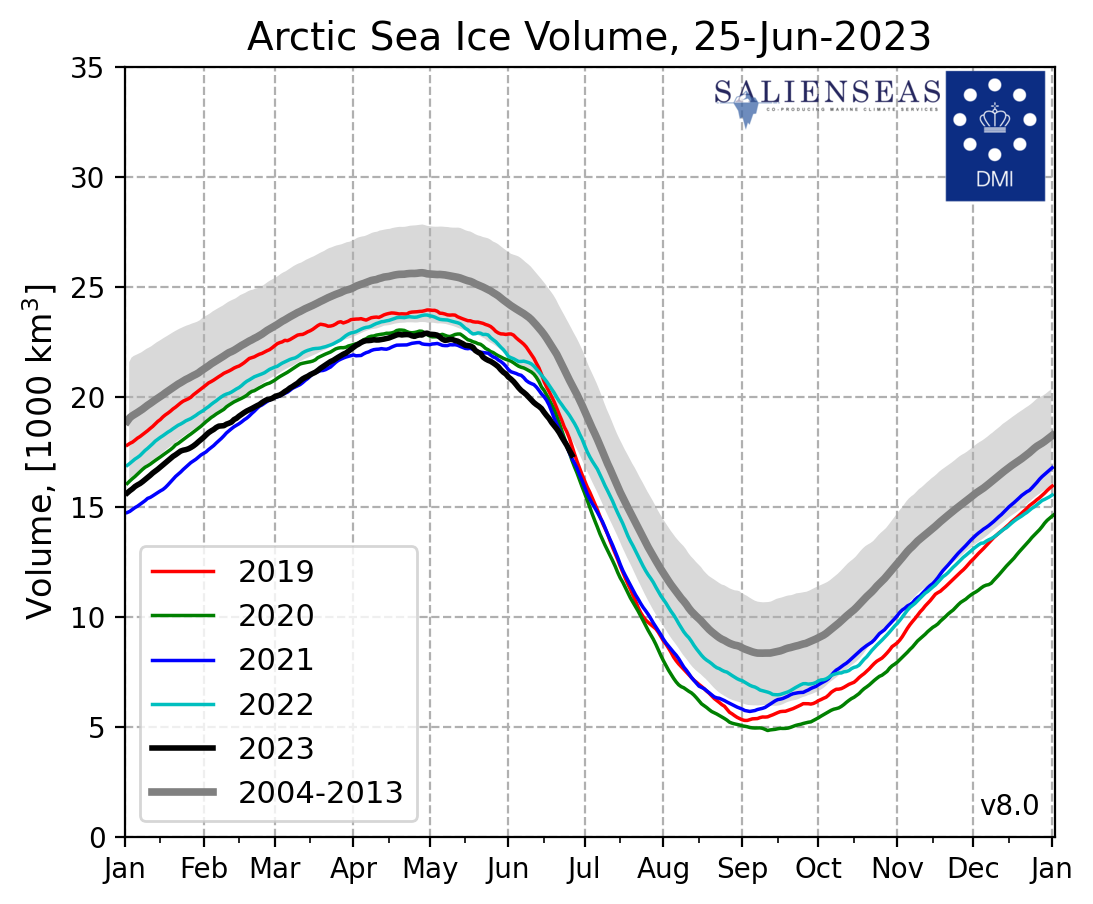
So far, melting of the Arctic sea ice has not been particularly exceptional. With regard to sea-ice at both poles, it is also important to consider thickness and volume. Ice that is only a meter or two thick is accumulated in the winter when there is no solar heating (sun largely or completely below the horizon) normally only a year old. Solid ice reflects most of the solar energy heating it. However, the thinner the ice is, the faster it can melt as it begins to heat under the summer sun and possibly even rain(!), to say nothing of warm currents from the tropics. Around the North Pole, all of the bluish and purple ice shown in the map below can disappear fairly quickly as summer continues to leave open ocean to absorb most of the solar energy striking it that will delay freezing in the following winter. (Danish Arctic Research Institutions Polar Portal).

Jetstreams
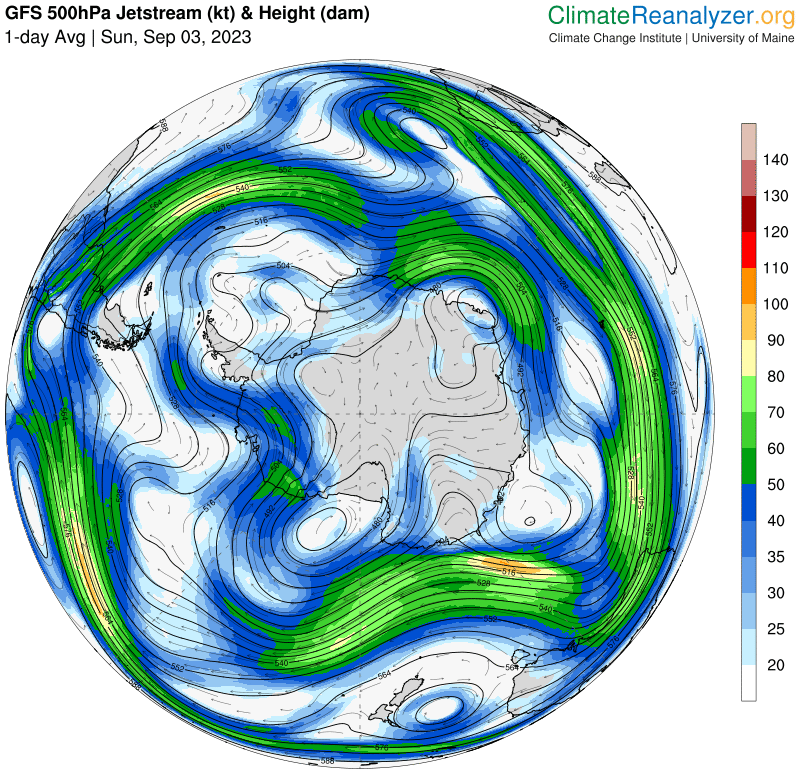
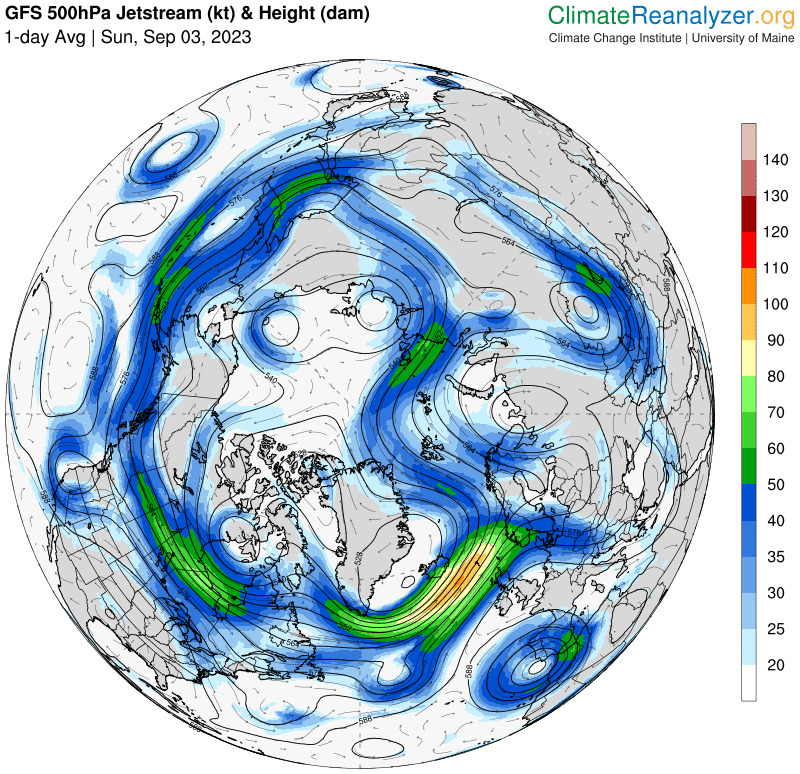
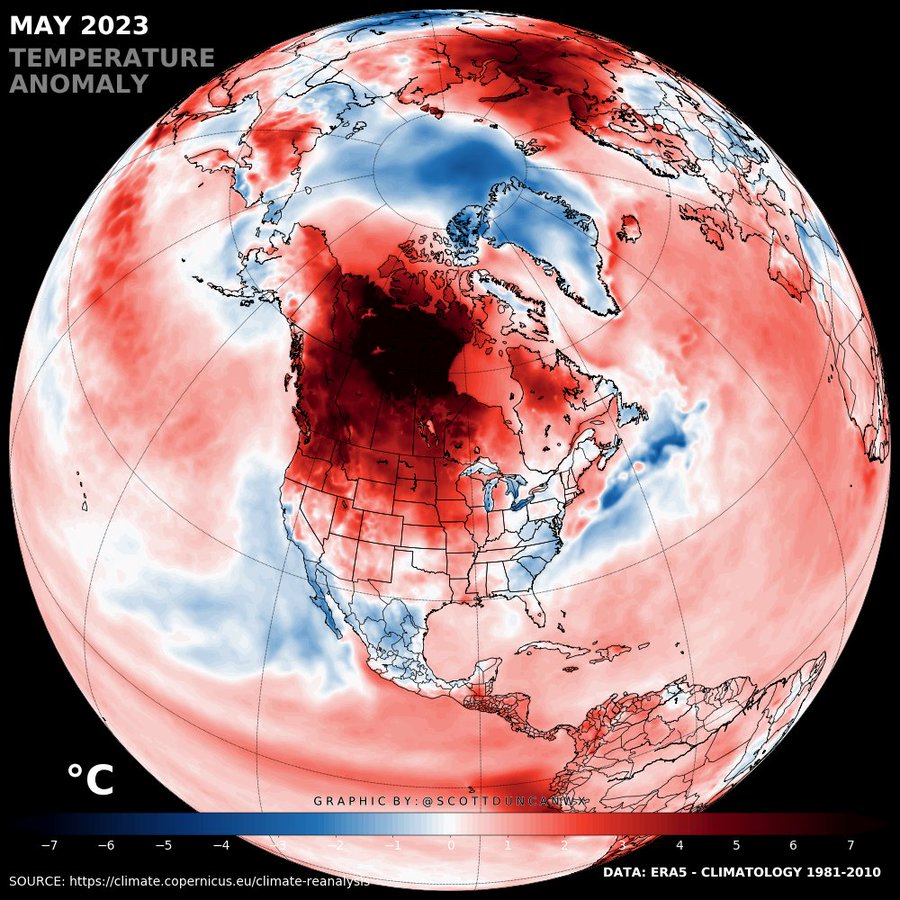
Continental effects
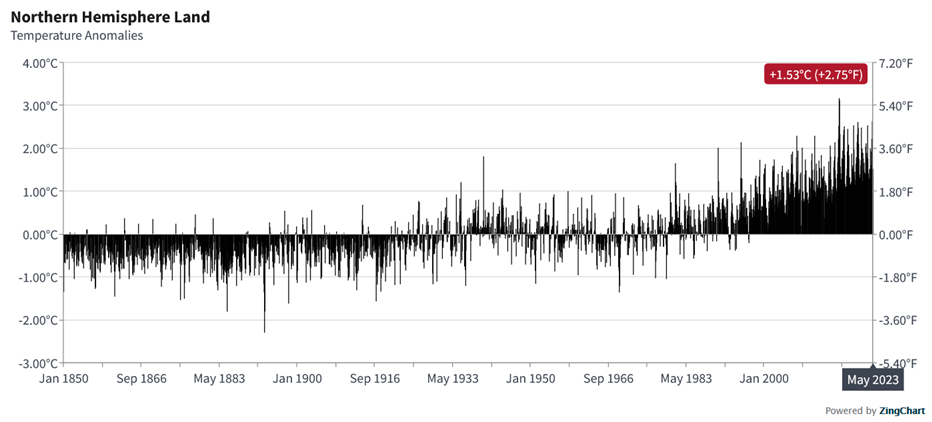
Northern Hemisphere
Plots are from https://www.ncei.noaa.gov/access/monitoring/climate-at-a-glance/global/time-series/nhem/land/all/1/1850-2023

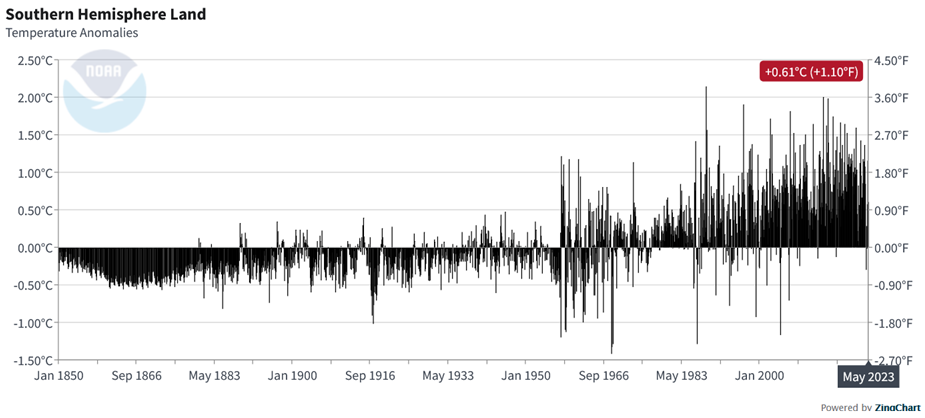
Is all this part of an early warning that a tipping point is being approached…. Or is it the real thing?
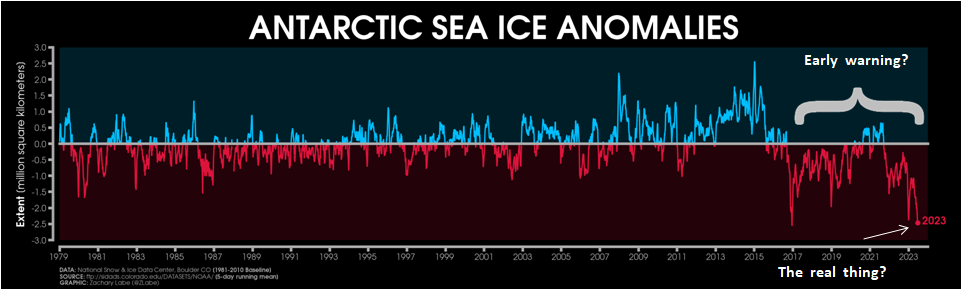
See: Lenton (2011) Early warning of climate tipping points
Intensity of observation
A hint to how much you can trust claims of reality denying trolls, puppets, and the like, is provided by the number monitoring points that physically monitor the atmosphere at those locations around the surface of the planet we live on used PER DAY.
Atmospheric monitoring
The European Centre for Medium-Range Weather Forecasts (ECMWF) for the charts plotted on 25 June 2023 as shown below are based on measurements from 173,296 locations. Note 1: this map does not NOT include ocean monitoring points. Note 2: The DATA COLLECTED EVERY DAY by this web of sensors is available to, used, and interpreted by several different national and institutional climate monitoring centers. In other words, the conclusions are cross checked between different centers many times over. The charts above depict scientific facts, not hunches and personal opinions.

Oceanographic monitoring
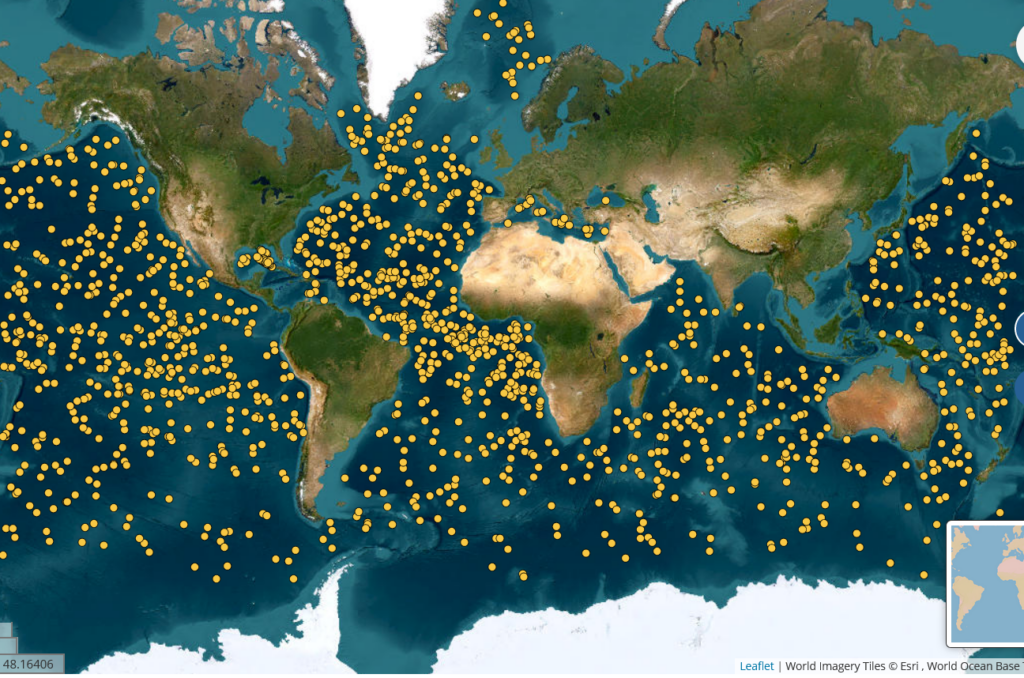
Argo
Argo floats profiles physical properties of the surrounding water, minimally ocean temperature, salinity, pressure (i.e., depth). Each float operates on a 10 day cycle, spending most of the cycle ‘resting’ at an intermediate depth. On the 10th day it sinks to a specified depth and begins recording inputs from its sensors as it floats up to the surface. The standard float sinks to a depth of 2 km (2,000 m) and records all the way up to the surface, where it then determines its GPS position to within a few meters and messages a passing relay satellite with its location and profile data before sinking to its resting depth waiting for the next profile position. As shown on the world map here, printed 26 June 2023, shows the locations of profiles received over the last 10 days (i.e., only the last cycle of currently operational floats): 3,625 profiles. Of these 1,481 recorded the profile from 2 km deep in the ocean to the surface. Some floats are designed to sink to the bottom and thus record a profile for the full depth of the ocean. A few include several additional sensors to levels for things like acidity, oxygen, nitrate, light level, and some more I don’t recognize. The Argo system is really quite amazing.
Some even have ice sensors allowing them to operate even in ice-covered waters by warning if they might be fatally damaged by striking ice overhead. For these, if they sense ice, they’ll record the profile in memory, and drop back and rest until the next cycle (which may again prevent surfacing). These interrupted cycles will keep repeating until the float can safely surface — in which case all of the aborted profiles will be messaged to the satellite relay along with the current one (better late than never!)
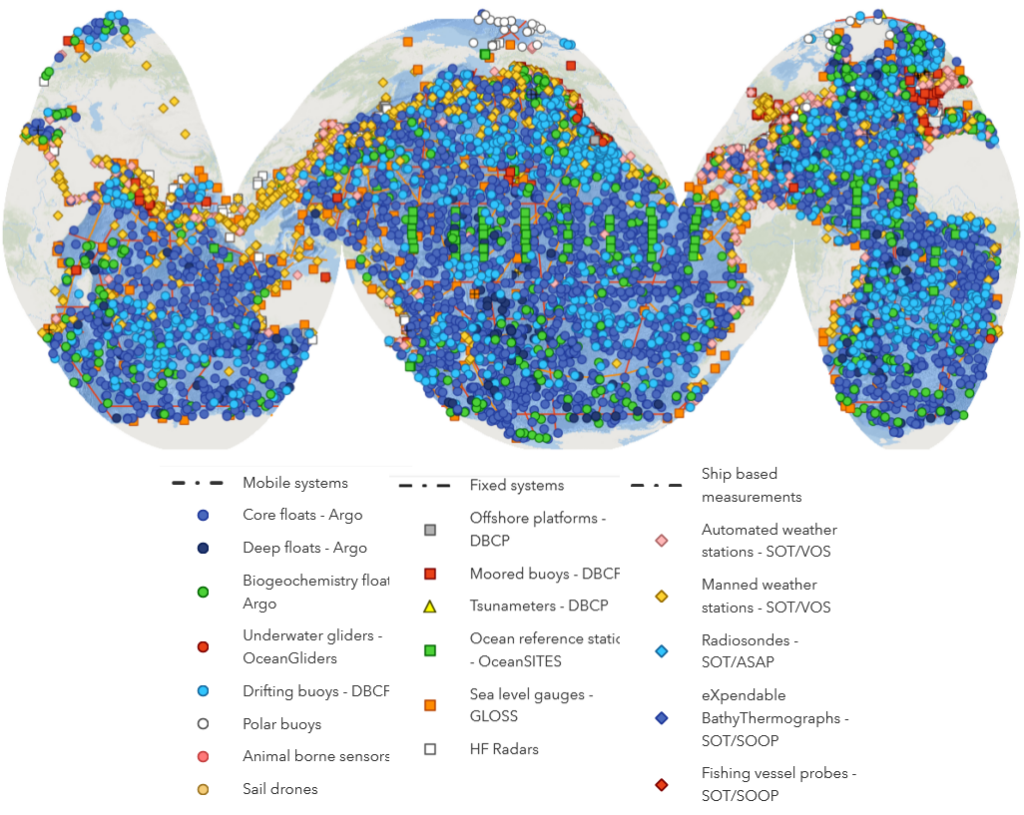
And then there is a plethora of other ocean sensor systems. The full gamut of them shown next. The various different types are named in the legend. Collectively, on 26 June 2023, the ocean sensing system measuring in-situ variables includes 7973 ‘platforms’ (including the different kinds of Argo Floats) and results from 104 ‘cruises’ of ships ranging from specialized oceanographic vessels to fishing boats. Some of these non-Argo systems also record partial or complete (i.e., to the bottom) profiles.
And then there are the numerous remote sensing satellite systems………. whose data fill gaps between physical sensors and whose measurements are cross calibrated between physical and remote sensors.
Almost all of the data collected from the range of sensors is freely accessible via the public World Wide Web.