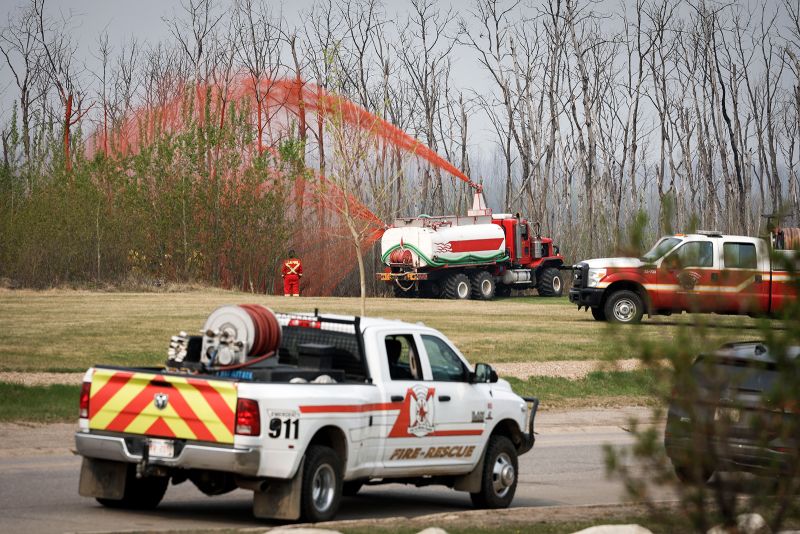
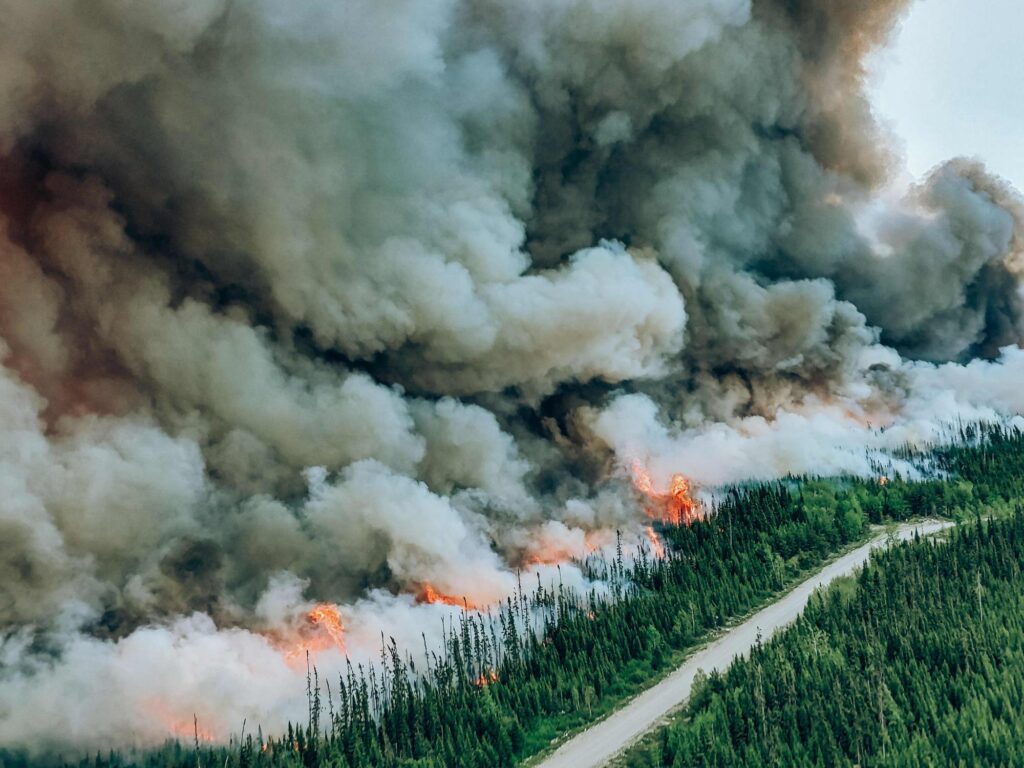
CNN’s featured image shows a pumper truck spraying fire retardant on trees around the evacuated neighborhood of Beacon Hill in Fort McMurray, Alberta, Canada, on Wednesday.Jeff McIntosh/The Canadian Press/AP, 16 May, 2024
Some of the fires are resurging from overwintering remnants of last year’s unprecedented holocaust in the boreal forests. This is assisted by continuing droughts, increasing temperatures, and minimal snowfallls. Ft McMurray, that was partially cremated in 2018 with $ billions in damage costs and the commercial and residential center of the tar sands (dirty!) oil producing district, is again being evacuated under threat from a repeat by another monster blaze. Other population centers are also under threat.
Clouds of smoke, toxic aerosols, and greenhouse gases are already spreading into the higher Arctic and over the northern United States.
It’s likely that the Russian taiga (boreal) forests and tundra are also beginning to burn as they did in 2019 – 2021 (see Portents for the Future – 2020 Wildfires on the Siberian Permafrost). This alone will keep temperatures rising unless we can reduce the constant input of solar energy enough so Earth can again radiate (mostly long wavelengths of IR) more energy than it receives. If we don’t do this soon, Earths ecosystems will be collapsing at a steeply accelerating rate over a few more decades until no accessible carbon is left in the geosphere – i.e., after most life save a few preadapted extremophiles – are left.
To stop the warming we will have to join in total global mobilization to geoengineer zero new emissions, draw down a substantial fraction of the presently existing GHGs to open the atmospheric windows for more IR emissions to escape Earth, and to increase Earth’s reflectivity enough to significantly reduce the absorption of solar energy. Led by America, the West was able to achieve this kind of mobilization to win WWII in little more than 4 years from the start of America’s joining the fray at the end of 1941. Such mobilizations need to be managed and led by governments, however, most current governments of the world (including Australia) are controlled by puppet-masters in the fossil fuel and related industries who are actively blocking any attempts to initiate effective action.
For our species to have any chance in any kind of sustaining biosphere, our mobilization must begin with replacing fossil fuel puppets in our ‘majority’ controlled governments with climate aware and progressive Greens and community independents who understand the issues and work for their constituents rather than their (often non-citizen) puppet masters.
@VoteClimateOne and Climate Rescue Accord can show you how to do this legally and ethically in the next available elections. See https://voteclimateone.org.au.
Views expressed in this post are those of its author(s), not necessarily all Vote Climate One members.
Notable observations and news items from the Web, with no processing and little in the way of comment. Make of them what you will.
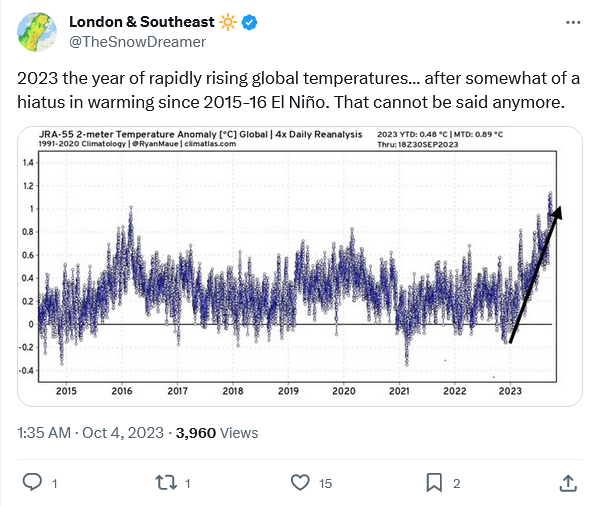
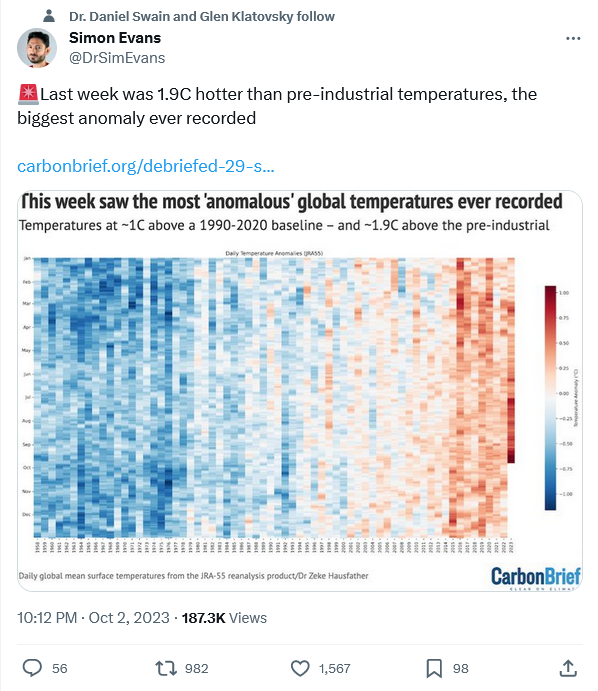
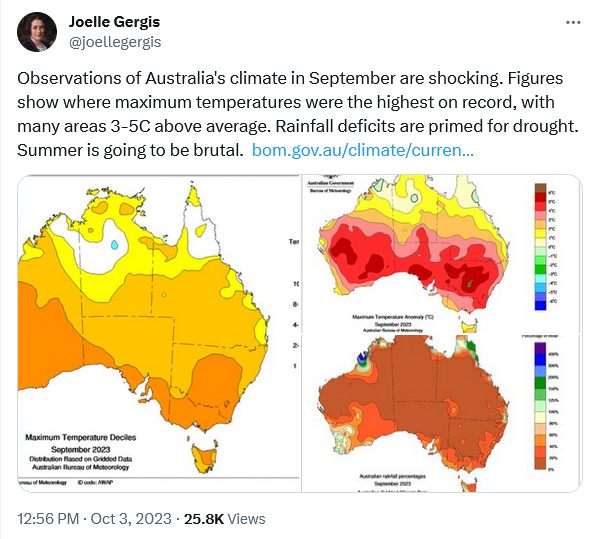
Leading up to this September’s extremes
Firefighters flying over a controlled burn to fight wildfires in Canada’s Quebec Province. Photograph: Genevieve Poirier/Societe De Protection Des Forets/AFP/Getty Images (from the article)
From June to August 2023, a series of extreme weather events exacerbated by climate breakdown caused death and destruction across the globe.
As the world sweltered through the hottest three month spell in human history this summer, extreme weather disasters took more than 18,000 lives, drove at least 150,000 people from their homes, affected hundreds of millions of others and caused billions of dollars of damage.
That is a conservative tally from the most widely covered disasters between early June and early September, which have been compiled in the timeline below as a reminder of how tough this period has been and what might lie ahead.
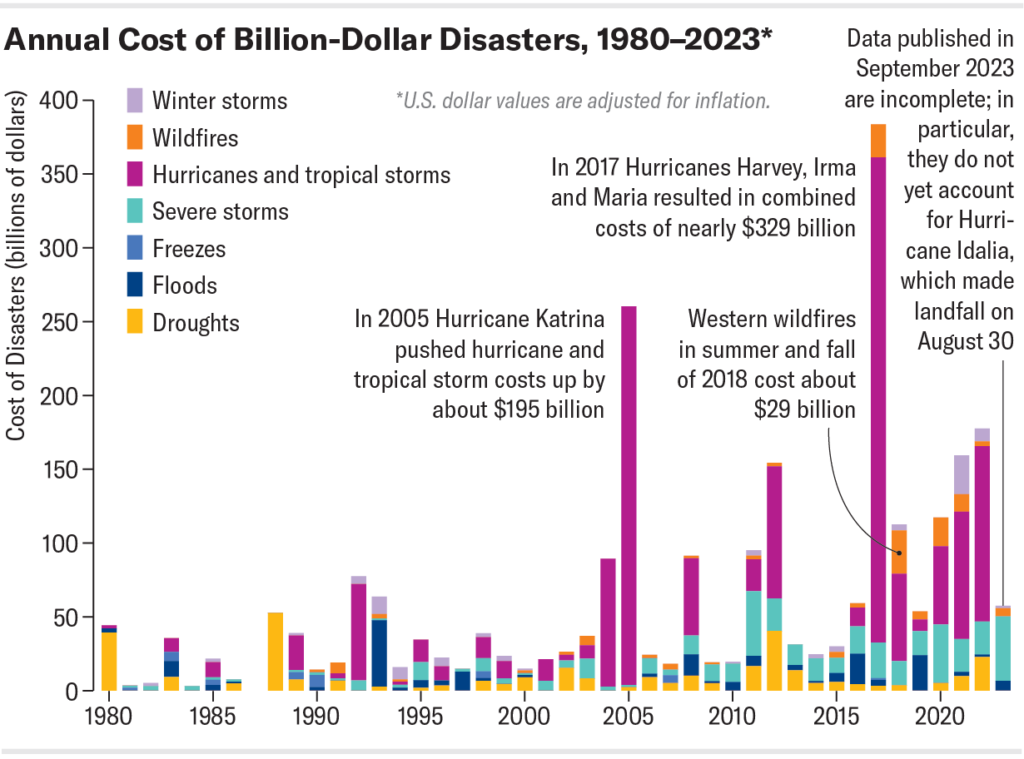
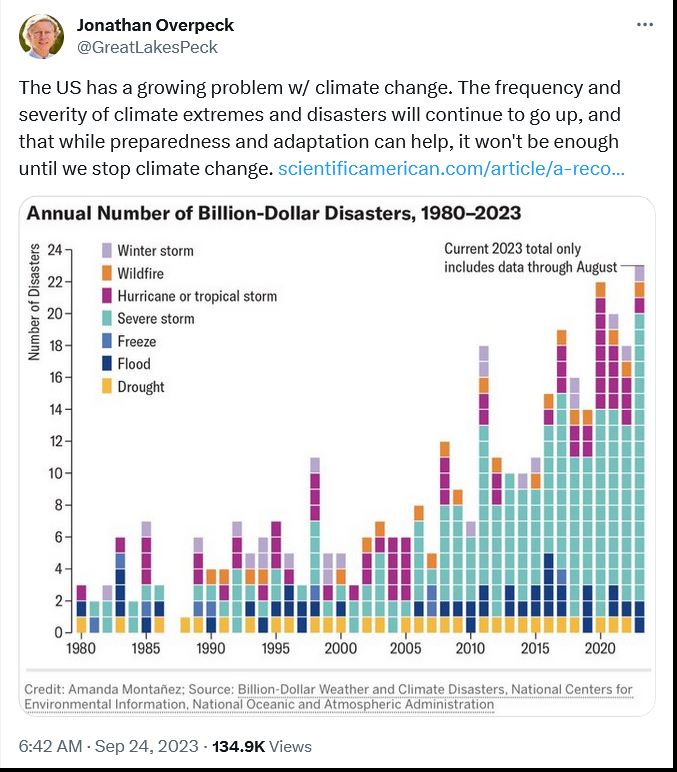
How much are these extremes costing society. For an idea see the following graphic from Scientific American’s blog. Note: this graphic applies only to the US,
https://www.theguardian.com/environment/2023/aug/28/crazy-off-the-charts-records-has-humanity-finally-broken-the-climate Warning: Data is provided for this article by climate scientists who suffer from the reticence causing academic and institutional scientists to downplay any overly ‘dramatic’ warnings in order to avoid alarming departmental colleagues, administrators, or governments influencing hiring, promotion, financial support for research, etc. Google “scientific reticence” and you will find lots of evidence on how it works.
The current extremely low sea ice will have a range of impacts. Changed ocean stratification and circulation will alter basal melting beneath ice shelves48. Greater coastal exposure will increase coastal erosion and reduce ice-shelf stability49. Changes in dense shelf water production will alter bottom water formation and deep ocean ventilation50. Sea ice changes will also have contrasting influences on Adélie and emperor penguin colonies51,52, and substantially alter human activities along the Antarctic coastline.
Anthropogenic greenhouse gas emissions have been attributed as the primary cause of Southern Ocean warming, and here we suggest a potential link to a regime shift in Antarctic sea ice. While for many years, Antarctic sea ice increased despite increasing global temperatures6, it appears that we may now be seeing the inevitable decline, long projected by climate models53. The far-reaching implications of Antarctic sea ice loss highlight the urgent need to reduce greenhouse gas emissions.
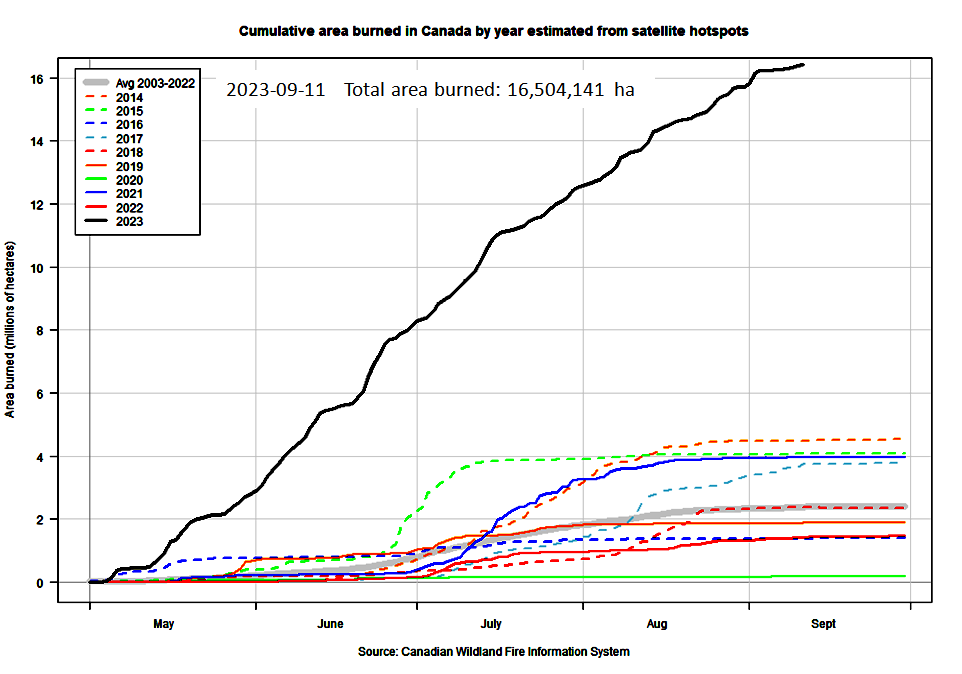
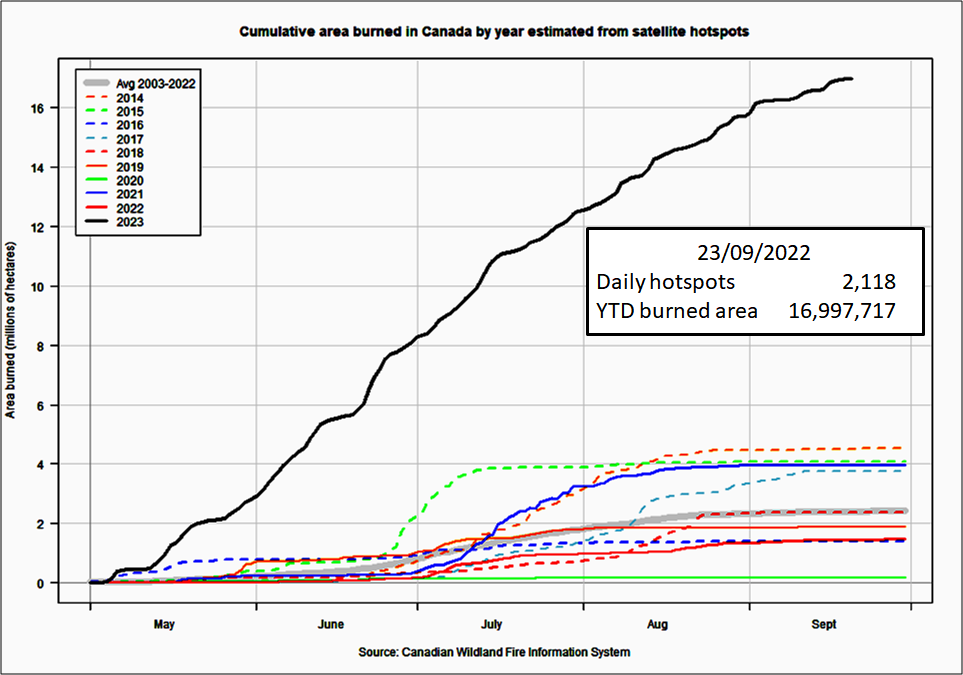
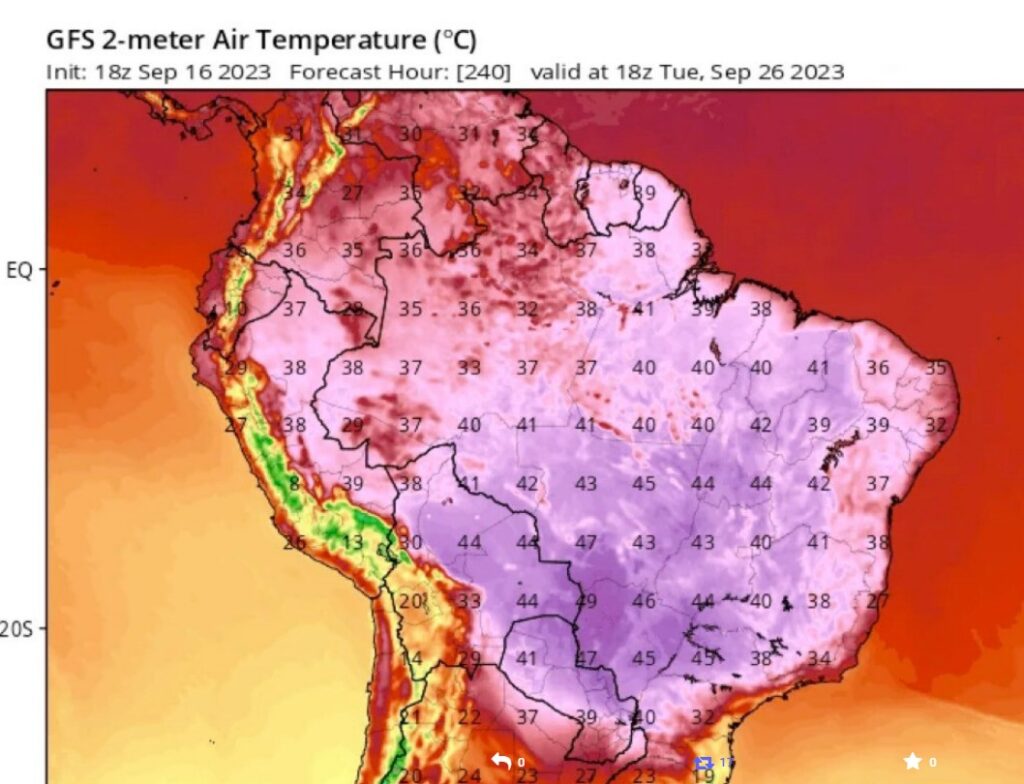
Off the previous chart, again…. In 12 days another ~500,000 hectares have burned! Will the burning stop for winter? What does this portend for Australia’s upcoming El Nino summer?
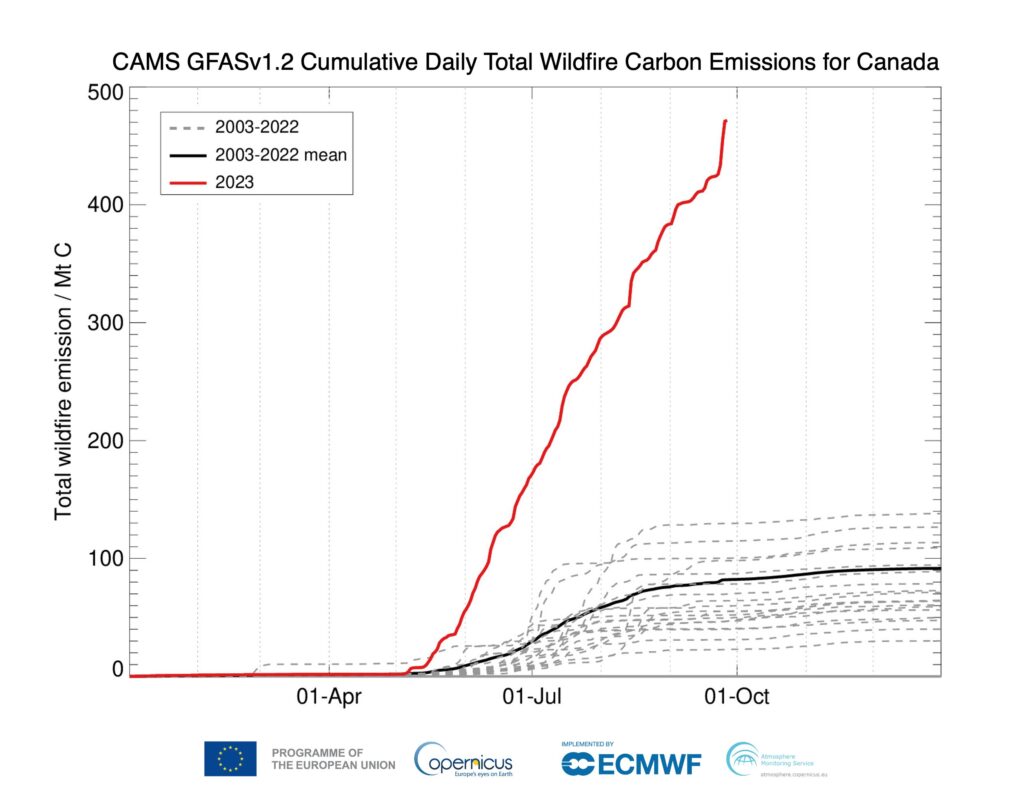
The record for the 23rd blew the Canadian system’s off the chart! The following chart from Copernicus, the EU’s equivalent of NASA, that operates the satellites, suggests the data from the 23d is probably a real record of what the satellites actually recorded. In most years the wildfires would have been more-or-less through for the year. Yet 23 Sept shows BY FAR the largest number of hotspots recorded for the year so far, previous highs being 9269 for June 22 and 9692 for July 13.
For the latest Natural Resources Canada tabulation, see https://cwfis.cfs.nrcan.gc.ca/maps/fm3?type=arpt. Note 1: the current version of the total burned area chart can be seen by scrolling down to the bottom of the table accessed by this link.
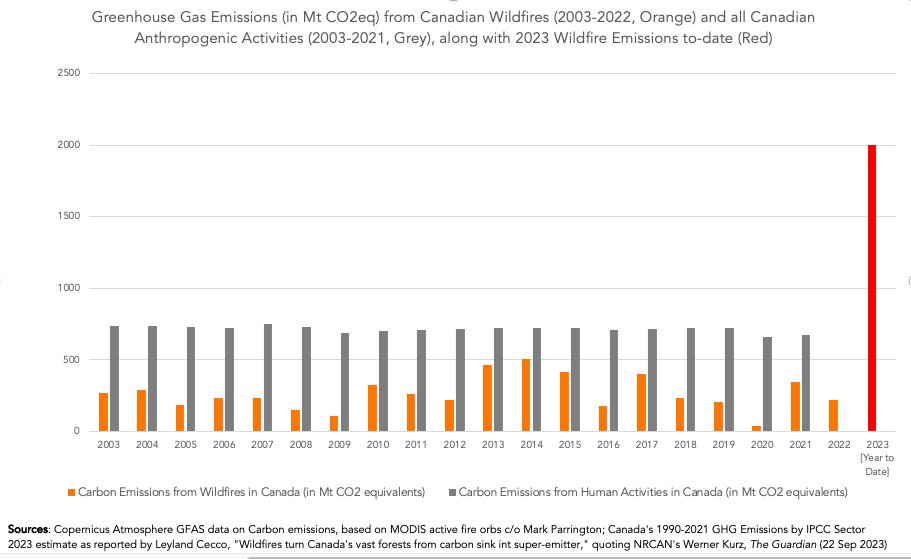
Note 2: the following Guardian chart was PUBLISHED on 22 Sept.
Note: warmer winter temperatures allowed mountain pine beetle populations to grow explosively through this region due to additional reproduction of adult beetles that were normally killed off by hard freezing winters. I did several Facebook posts in 2016 and 2018 on the increasing fire hazard this would create until the dead biomass was removed. This year’s extreme temperatures facilitated this!
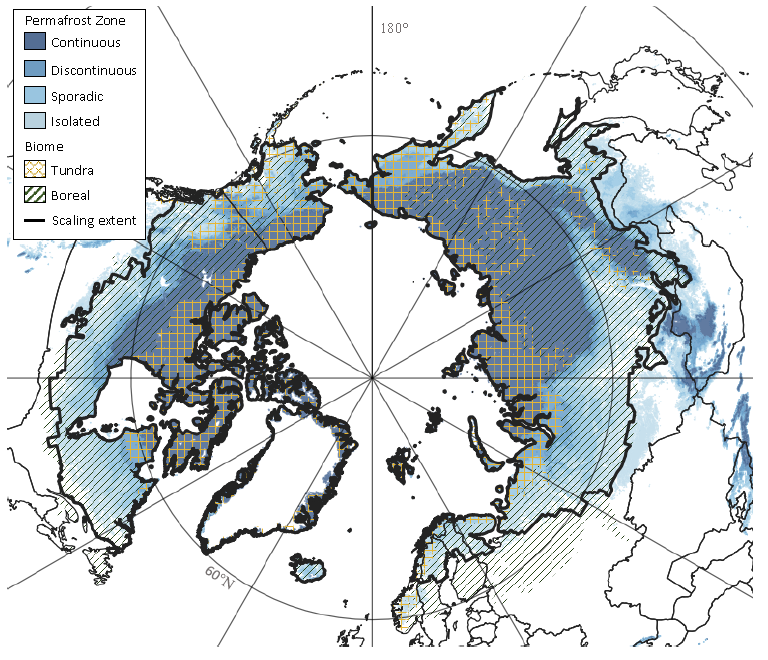
The Canadian 🔥 season is not yet done but I have a few URGENT questions we must address. 1. How many of these fires will burn underground overwinter and emerge as spring zombie fires? 2. How much extra permafrost will thaw because of this year’s severe burning? #ClimateCrisispic.twitter.com/Ih0ilRHQ6Q
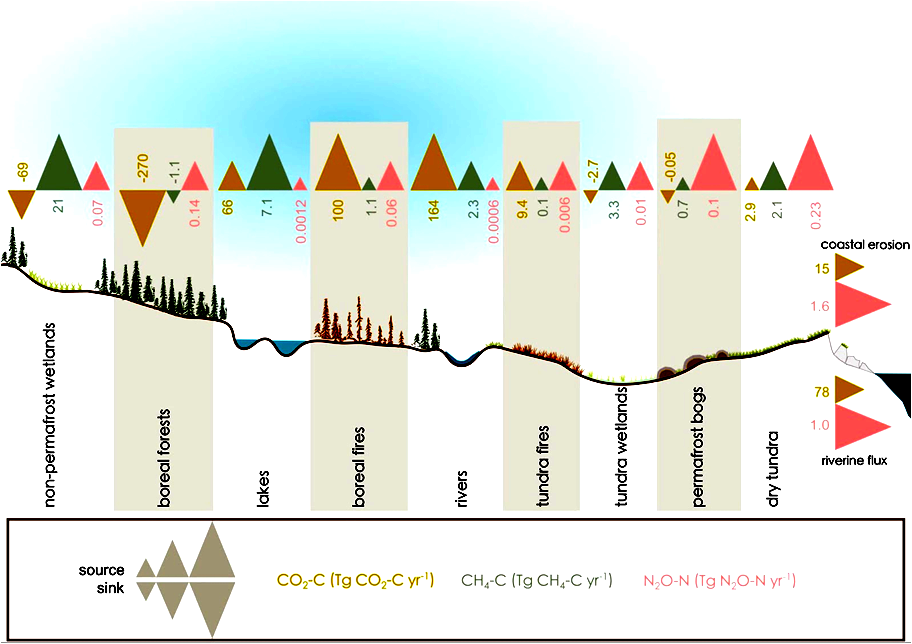
[Note that 2020- Siberian wildfires plus this years’ wildfires in the Canadian Arctic Zone probably produced massive increases in permafrost GHG emissions beyond what was happening during the years included in this survey.]
Map of northern permafrost extent (data from Obu et al. 2021) overlain with the spatial extent of the permafrost domain included (BAWLD-RECCAP2 regions). The spatial extent of the permafrost region de ned in this study as an overlap of permafrost extent and the Boreal Arctic Wetlands and Lakes Dataset (BAWLD, Olefeldt et al. 2021a,bScheme of annual atmospheric GHGs exchange (CO2, CH4, and N2O) for the ve terrestrial land cover classes (Boreal Forests, Non-permafrost Wetlands, Dry Tundra, Tundra Wetlands and Permafrost Bogs); inland water classes (Rivers and Lakes). Annual lateral fluxes from coastal erosion and riverine fluxes are also reported in Tg C yr-1 and Tg N yr-1. Symbols for fluxes indicate high (x>Q3), medium (Q1<x<Q3), and low (<Q1) fluxes, in comparison the quartile (Q). Note that the magnitudes across three di erent GHG fluxes within each land cover class cannot be compared with each other.
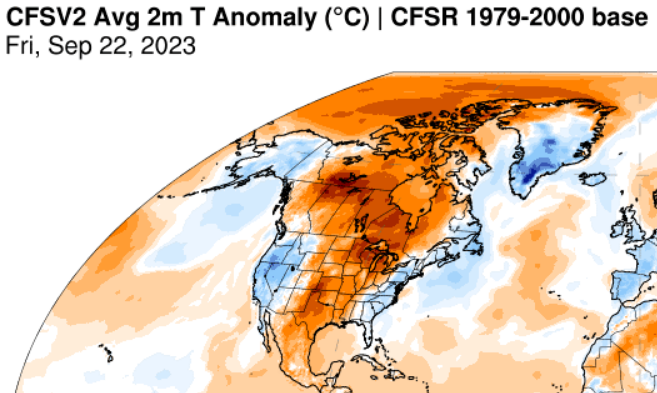
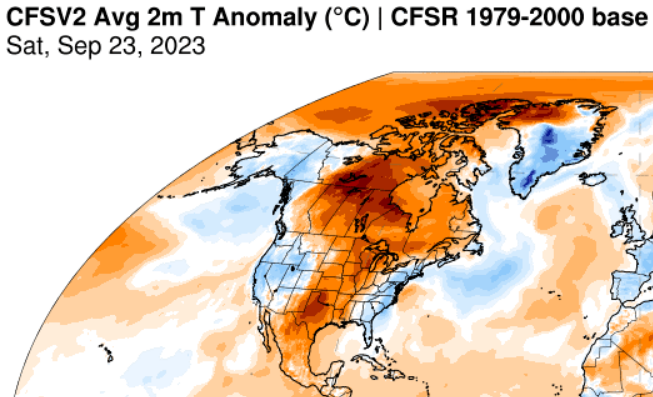
ClimateReanalyzer
Stationary anomaly, somewhat hotter on 23rd than 22nd
https://www.theguardian.com/environment/2023/sep/11/us-record-billion-dollar-climate-disastersNote, as the frequency, extent, and ferocity of climate disasters continue to increase with accelerating global warming, newer disasters will overlap and add to destruction from previous disasters where there has not been enough time to complete repair and remediation leading to the accelerating accumulated climate damage — until society no longer has the resources to continue repairing and replacing what has already been repaired and replaced. At this point social collapse is inevitable…… We must stop and reverse the process of global warming that is causing this or face near-term extinction.
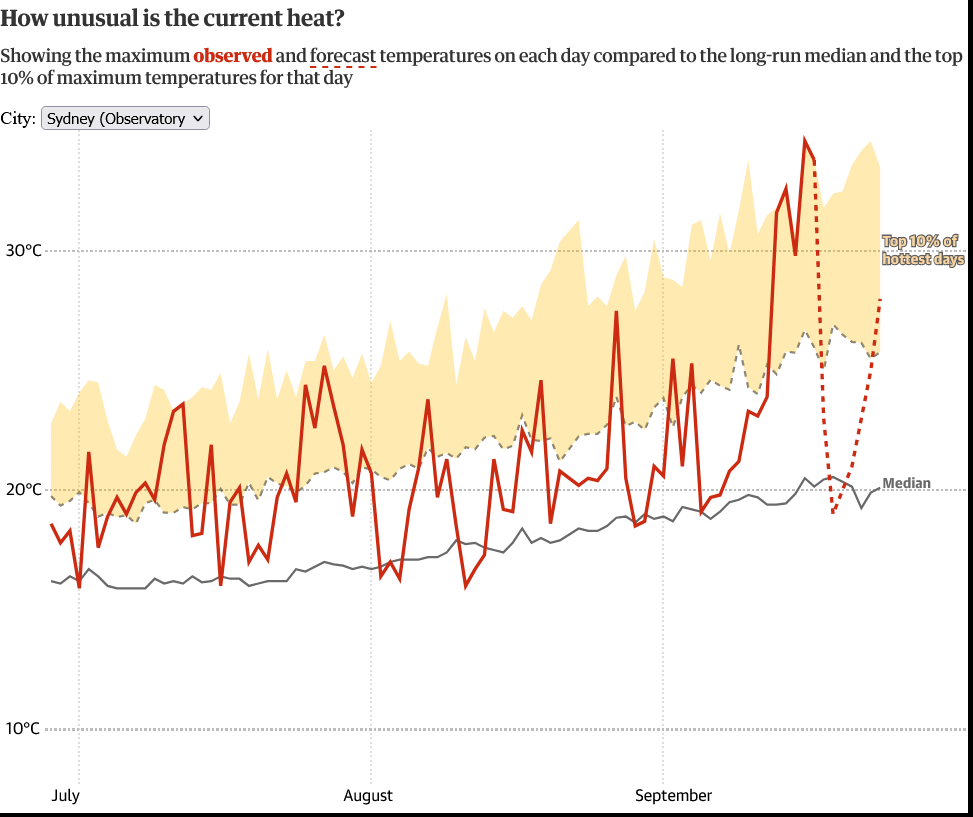
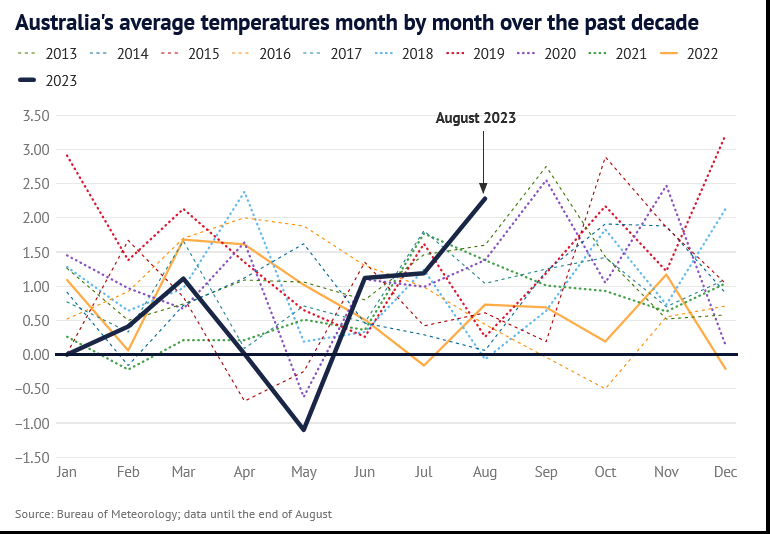
11 September 2023 – Coming out of winter — not a good look for the rest of the year in Australia!
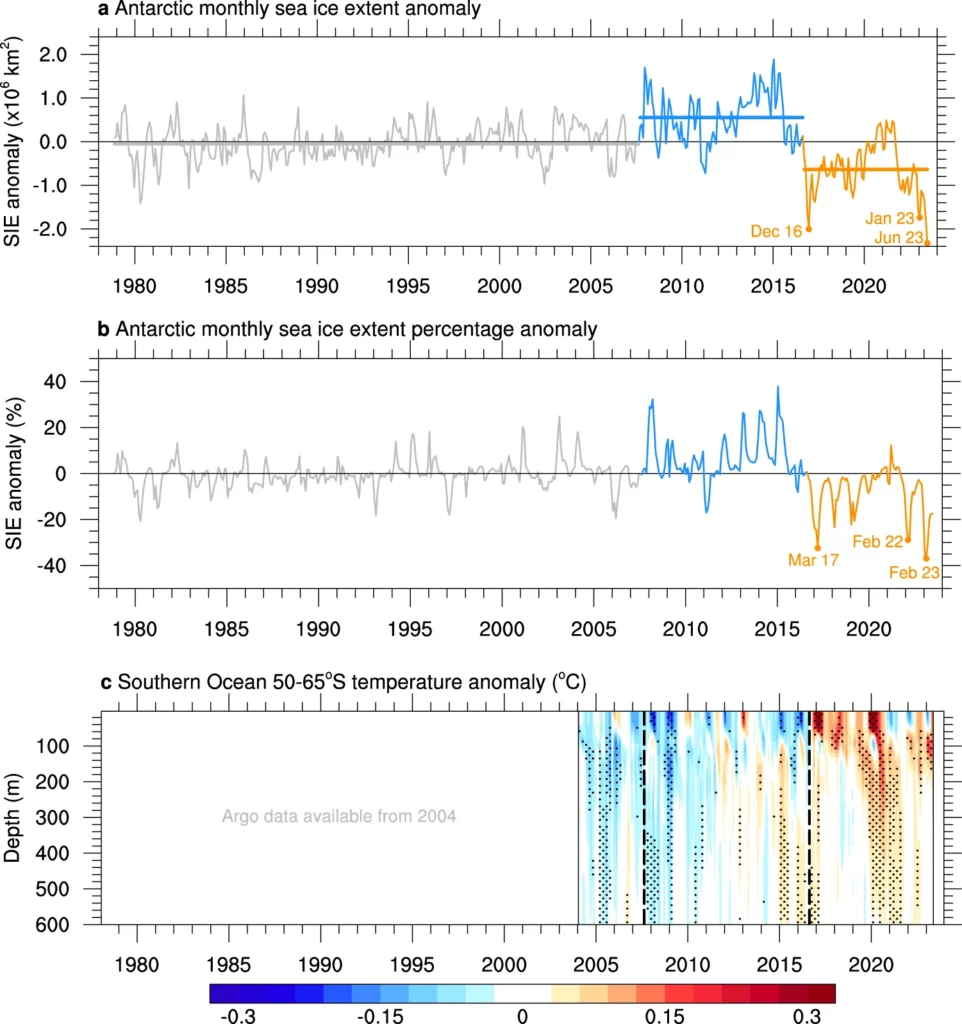
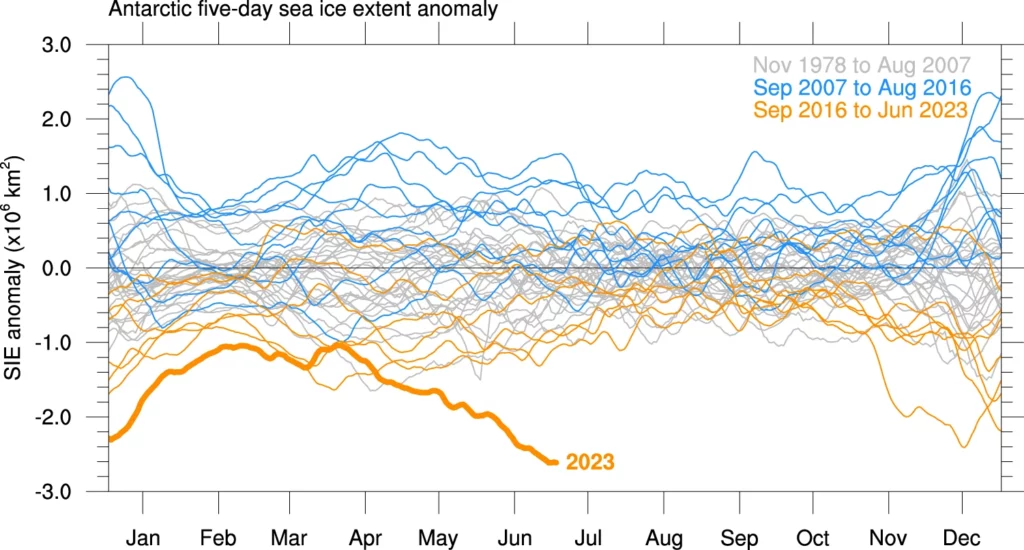
In February 2023, Antarctic sea ice set a record minimum; there have now been three record-breaking low sea ice summers in seven years. Following the summer minimum, circumpolar Antarctic sea ice coverage remained exceptionally low during the autumn and winter advance, leading to the largest negative areal extent anomalies observed over the satellite era. Here, we show the confluence of Southern Ocean subsurface warming and record minima and suggest that ocean warming has played a role in pushing Antarctic sea ice into a new low-extent state. In addition, this new state exhibits different seasonal persistence characteristics, suggesting that the underlying processes controlling Antarctic sea ice coverage may have altered. [my emphasis]
a Antarctic monthly sea ice extent (SIE) anomaly time series from the National Snow and Ice Data Center over the satellite period, November 1978 to June 2023, in millions of square kilometres. Sea ice extent anomalies are calculated relative to the 1979–2022 climatology. Two change points are detected, separating the time series into three periods: November 1978 to August 2007 (grey), September 2007 to August 2016 (blue), and September 2016 to June 2023 (orange). The means of each period are shown by the horizontal lines and are statistically distinguishable. b Antarctic monthly SIE anomaly time series expressed as a percentage of the monthly climatology over 1979–2022. Periods are coloured as in (a). Record minima months occurring since 2016 are noted in (a, b). c Southern Ocean 50–65°S temperature anomaly time series from Argo over January 2004 to May 2023, in degrees Celsius. Ocean temperature anomalies are calculated relative to the 2004-2022 climatology. Dashed vertical lines show the sea ice extent change points. Stippling indicates values outside ± 1 standard deviation, where the standard deviation is calculated independently at each depth level to account for the change in magnitude of the variability with depth. Warm anomalies shown in orange and red are evident below 100 m from 2015, and at the surface from late 2016.Antarctic five-day sea ice extent anomalies in millions of square kilometres for each year from the National Snow and Ice Data Center. Sea ice extent anomalies are calculated relative to the 1979–2022 climatology. Anomalies are coloured by period as in Fig. 1: November 1978 to August 2007 (grey), September 2007 to August 2016 (blue), and September 2016 to June 2023 (orange). January to June 2023 is shown in bold orange, with the largest negative areal extent anomaly of the satellite era observed during June 2023.
Implications
The current extremely low [Antarctic] sea ice will have a range of impacts. Changed ocean stratification and circulation will alter basal melting beneath ice shelves48. Greater coastal exposure will increase coastal erosion and reduce ice-shelf stability49. Changes in dense shelf water production will alter bottom water formation and deep ocean ventilation50. Sea ice changes will also have contrasting influences on Adélie and emperor penguin colonies51,52, and substantially alter human activities along the Antarctic coastline.
Anthropogenic greenhouse gas emissions have been attributed as the primary cause of Southern Ocean warming, and here we suggest a potential link to a regime shift in Antarctic sea ice. While for many years, Antarctic sea ice increased despite increasing global temperatures, it appears that we may now be seeing the inevitable decline, long projected by climate models. The far-reaching implications of Antarctic sea ice loss highlight the urgent need to reduce greenhouse gas emissions. [my emphasis]
Key facts from CDR (Center for Disaster Recovery):
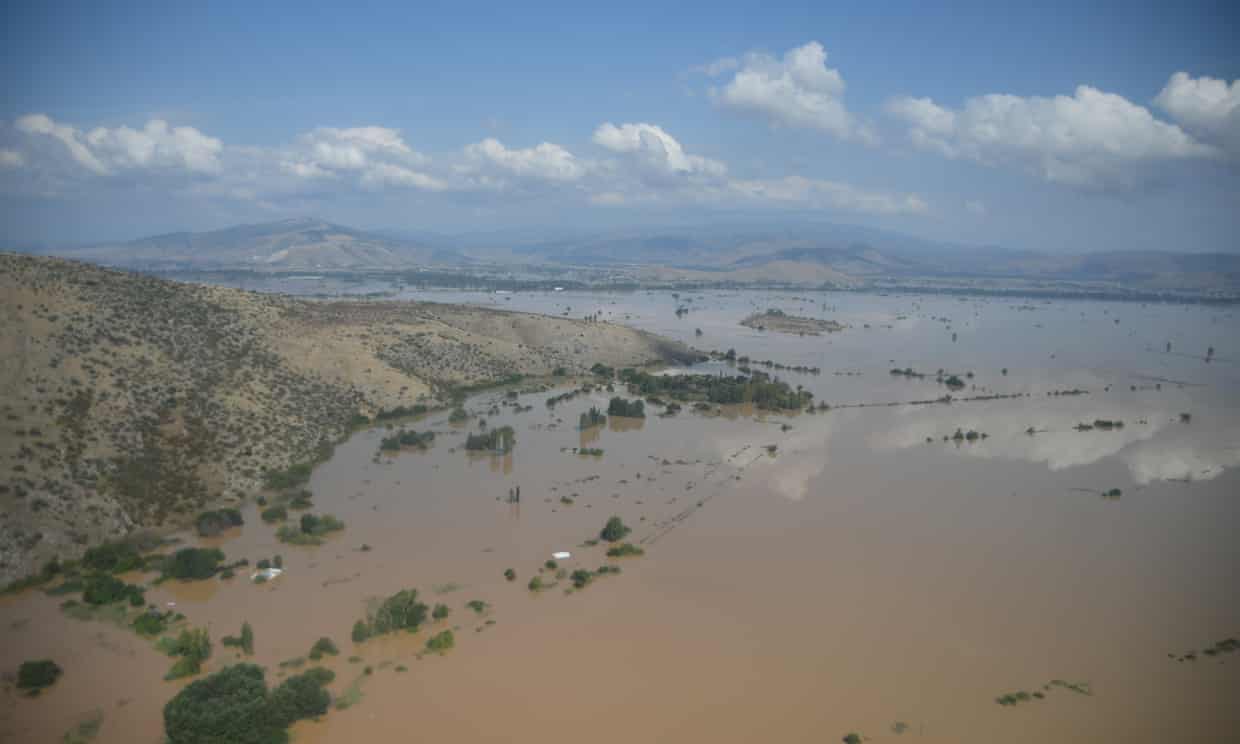
As of Sept. 15, the Libyan Red Crescent said the death toll had reached 11,300 people in Derna alone. Officials expect this figure to continue to rise, possibly as high as 20,000. About 170 people were also killed in other parts of eastern Libya, including in Susa, Marj, Bayda and Um Razaz. More than 7,000 people were injured and at least 10,100 people are still reported to be missing. Because of the lack of telecommunications, some may be displaced and unable to reach family, but due to the large-scale destruction, it is hard to confirm these figures.
According to Floodlist, Libya’s National Center of Meteorology reported, “in a 24 hour period to Sept. 10, a staggering 414.1 mm [16.2 inches] of rain was recorded in Bayda, while 240 mm [9.5 inches] of rain fell in Marawah in the District of Jabal al Akhdar, and 170 mm [6.7] fell in Al Abraq in the Derna District.”
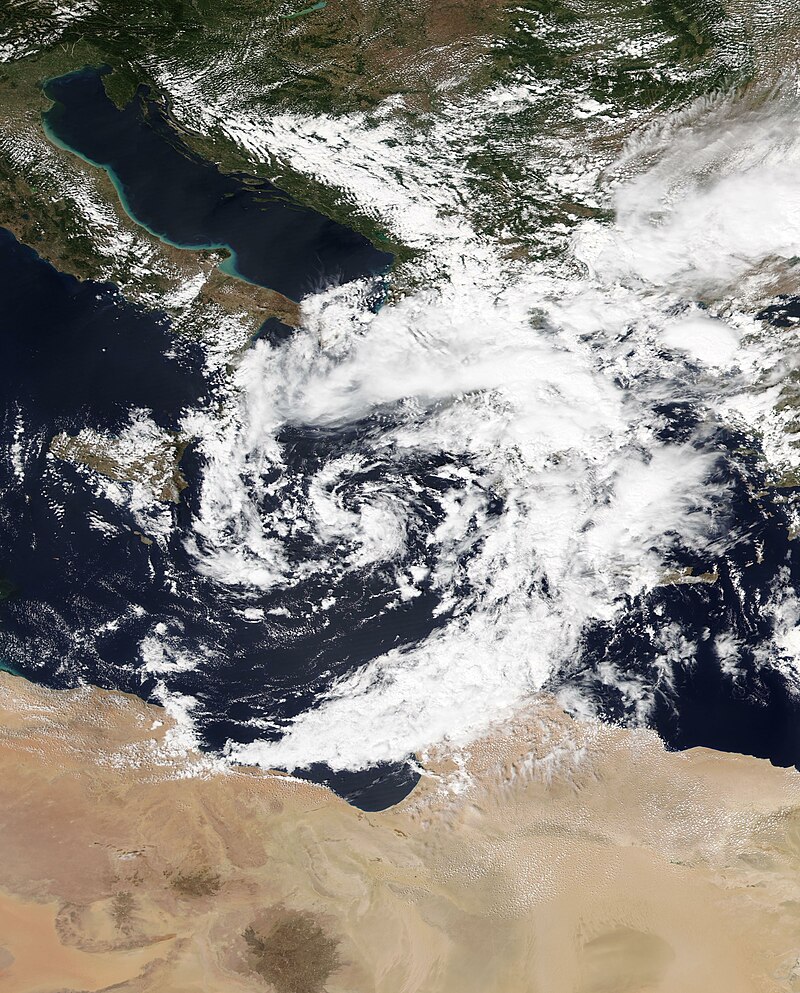
I used publicly available satellite imagery to try assess the damage attributed largely due to the failure of two dams. My conclusion is that the dams were no more than momentary and relatively insignificant barriers to to the flow of an inconceivably large volume of water. The following satellite images from Google Earth, and Sentinel Hub’s EO Browser clearly demonstrate the power of our planet’s increasingly extreme weather events driven by global warming. As the oceans and atmosphere warm, the atmosphere is able to transport increasingly stupendous volumes of water (in the form of water vapor) over the land to be dropped when the air cools for any reason.
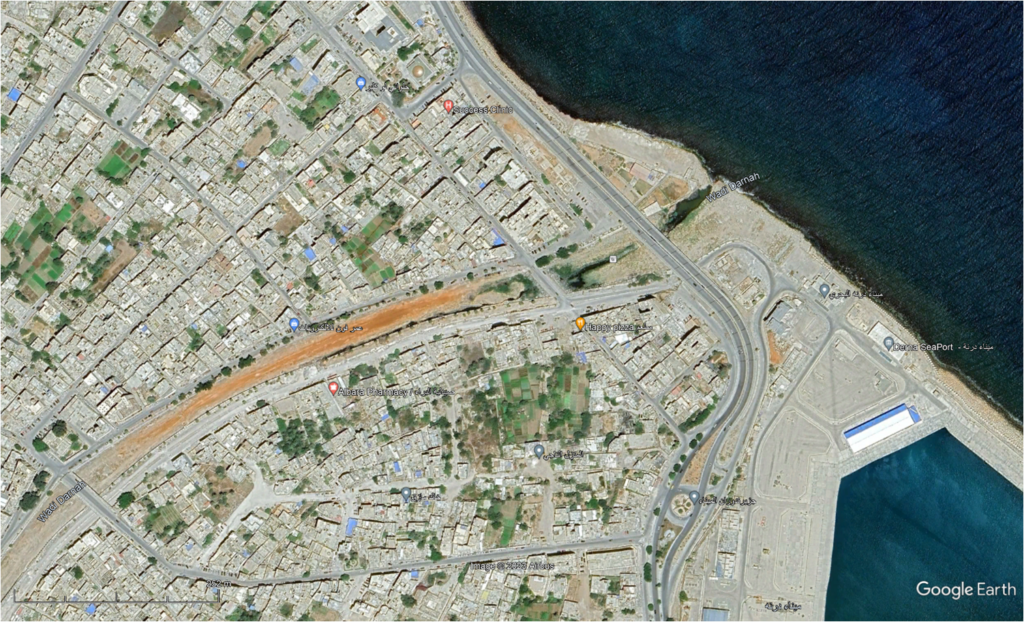
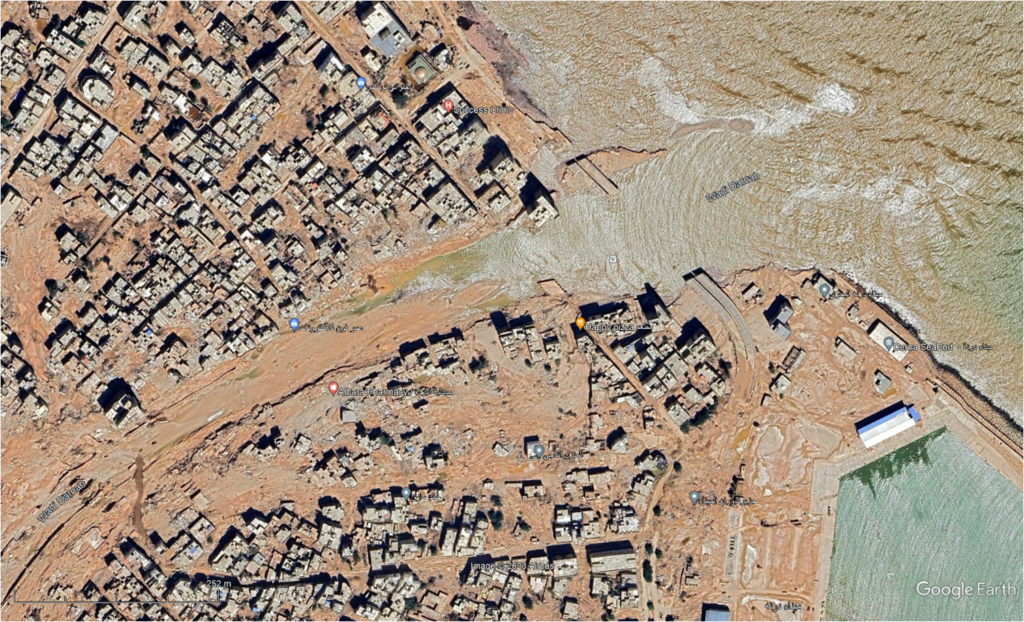
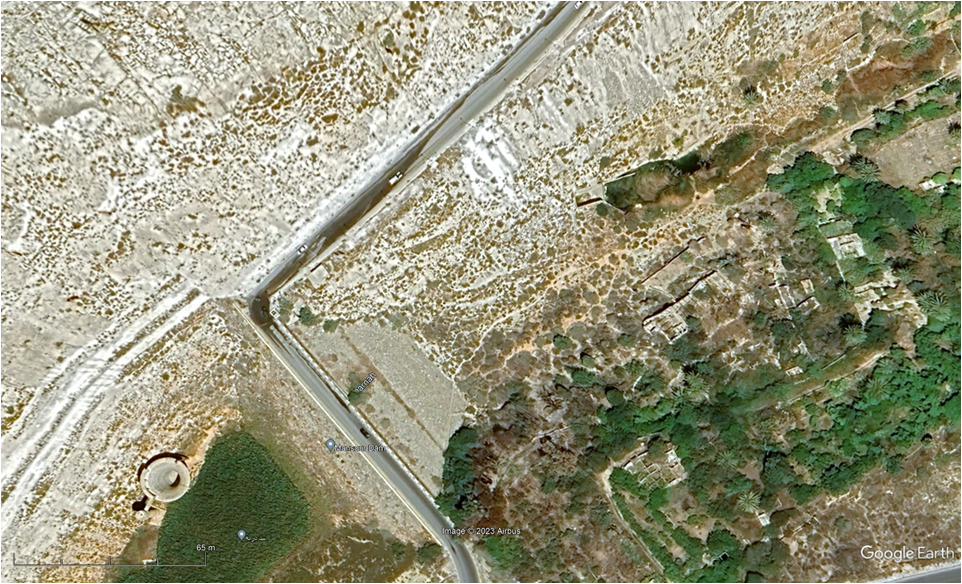
The following image is what appears to be the center of the city of Derna (pop ~100,000) immediately before Storm Daniel dropped part of its load of water in the watershed of Wadi Derna. The very dry stream bed of Wadi Derna crosses the center of the image. If you have access to Google Earth, you can zoom in to see shadows of the few individual people out in the mid-day sun.
Zooming in, note the large building on the NE side of the Wadi 3 blocks downstream from the bridge on the lower left corner of the picture. It is a high-rise, where the tallest part is 9 stories above the ground floor, and the rest five. I determined the number of floor by counting the sun shades visible on the downstream side of the building. This is one of the few structures left in this part of town that can be identified in the next image.
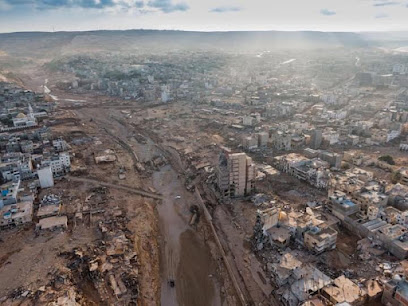
Immediately after it looked like this:
Note the conspicuous high-rise (10 stories) easily marked by its long shadow in this image. The image below images this building from the down-stream side. The image here is relatively low resolution, but the three lowest floors (facing AWAY from the flood) have clearly been gutted by the flood. The bridge referred to in the previous picture has vanished leaving only two supports (aligned with the stream flow) to show where it was. Rows of 4-6 story buildings (and even some 8 story buildings just off the left edge of this image) extending 3-4 and even more rows back from the Wadi have totally vanished or are only memorialized by a bit of concrete slab or trace of a foundation wall.
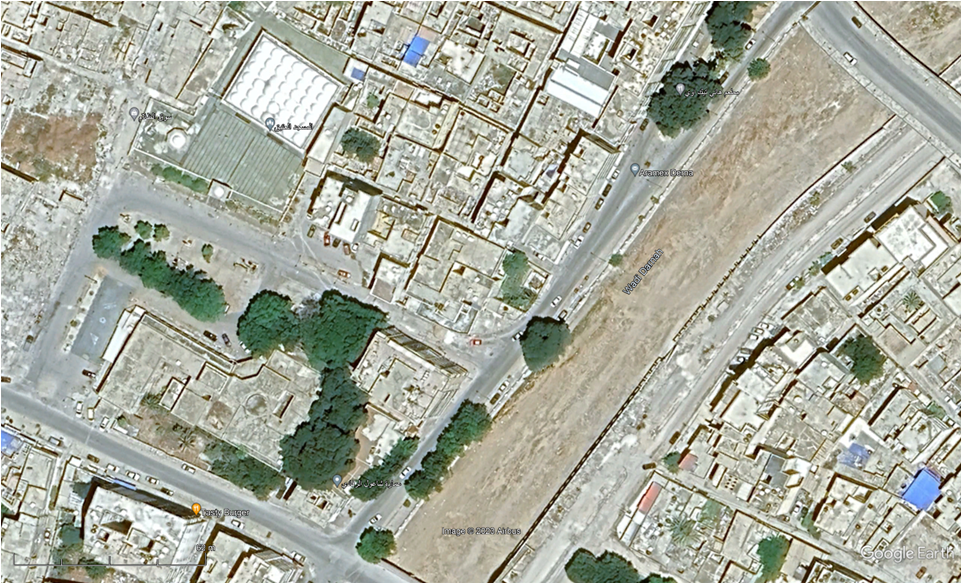
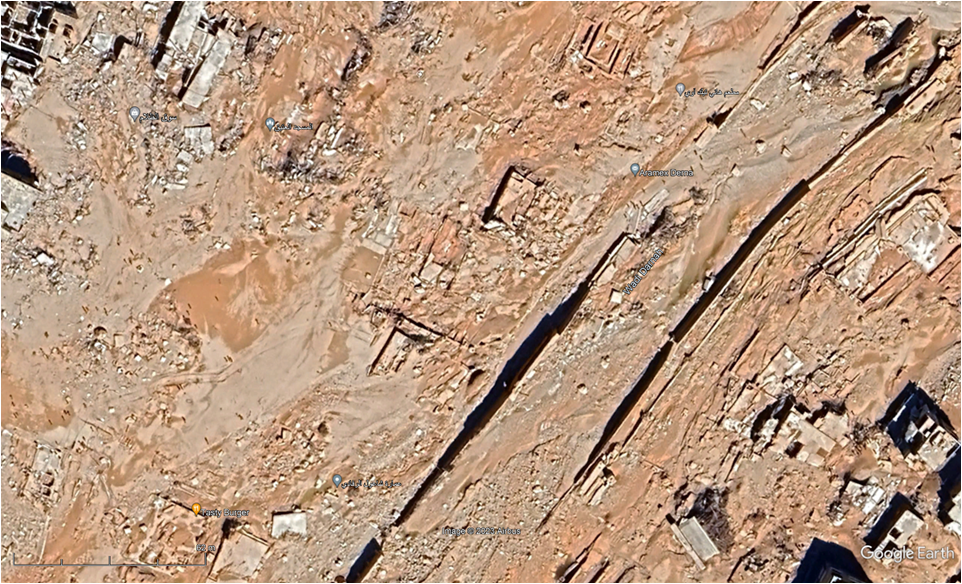
The next two pictures zoom in on the area between the vanished bridge in the above images and the next bridge upstream (just off the edge of the above).
The three buildings to the left of the Wadi at the bottom of the image were respectively 7, 4, and 7 stories high
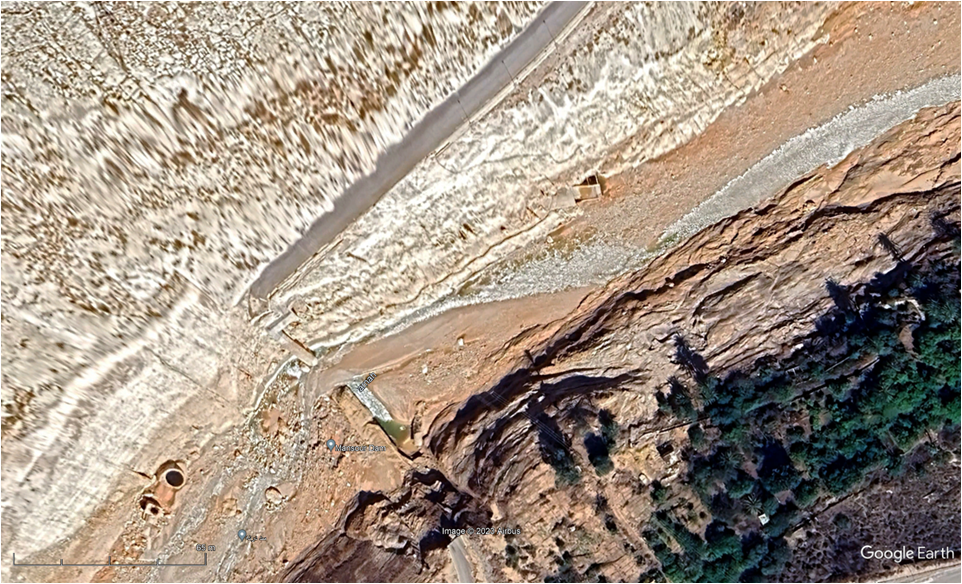
The next two pictures show the site of the lower dam – 250 meters upstream from the inland edge of the city.
Note: the dam has no spillway. Overflow protection is provided by the flared drain pipe (circular structure) in the lower left of the picture. Using Google Earth’s measuring tool, the diameter of the drain as approximately 6m. On the upstream side the surface of the reed bed is ~24 m above sea level, and the level of the road over the top is 45 m, giving the dam height of 21 m. On the downstream side the base of the dam is at 26 m, with the outlet for the overflow drain at approx 22 m. The length of the dam across the top is ~115 m, across the bottom (at reed level) is 50 m; thickness at the bottom is ~74 m, 8.5 m at the roadway.
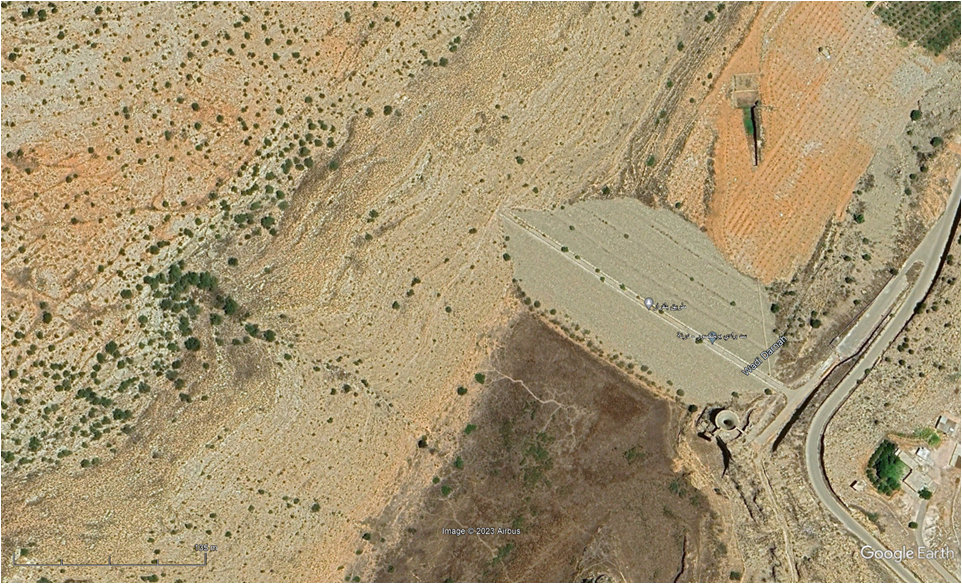
The next Google Earth image is of the upper dam (12.5 km upstream from the lower dam) from immediately before Storm David’s rain. There is no high resolution image available from after the flood.
The drain tube (right side upstream) seems to be 7m in diameter. The dam is ~10 m high and 270 m long. 143 m thick at the base and 6.5 m thick at the top.
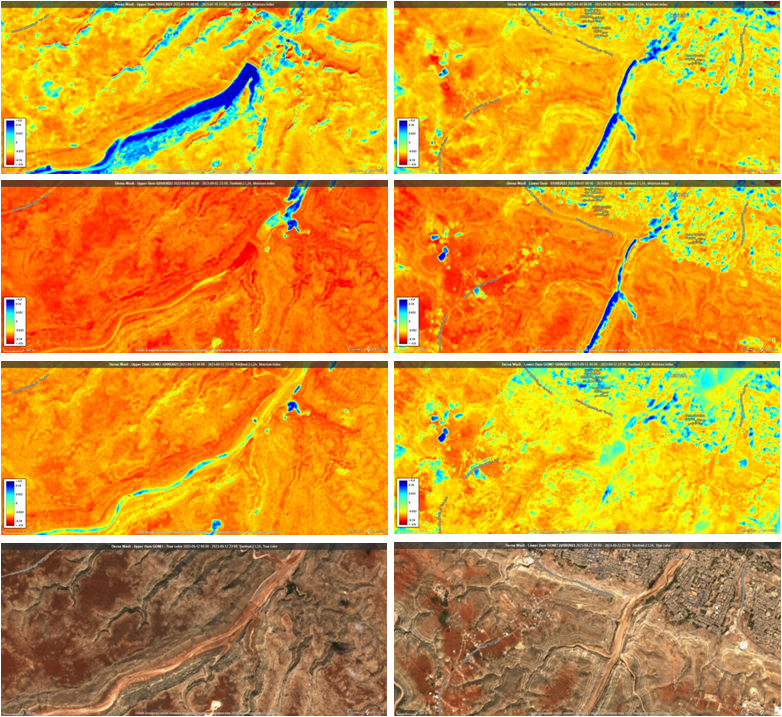
The last composite graphic gives an impression of the amount of water held behind both dams in the days immediately prior to Storm David. All are sourced via Sentinel Hub’s EO Browser and all are at the same scale – close to the maximum resolution available. The left four images are of the upper dam and its lake, while those on the right are of the lower dam and its lake. The upper three images of each dam use the Normalized Difference Moisture Index NDMI – that basically highlights any moisture in the otherwise barren landscape. The bottom picture is the same view as the one immediately above, except that it displays “true colors”. On the left in the top picture, on 10/01/2023 there was some water backed up behind the dam, perhaps 2 m deep at the dam wall given that most of the upstream face is still dry. The second picture, on 02/09/2023 shortly before Storm Daniel shows essentially zero moisture behind the dam, except there is a tiny blue streak in the bottom of the bright yellow area that is too small to be resolved at the magnification shown here. The blue areas below the dam are well watered orchards and fields – not standing water. The dam is visible in both of the above pictures. The third picture, from 12/09/2023 immediately after Storm Daniel shows the Wadi Derna has been scraped clean of any sign of a dam or the well watered agricultural area below the dam save the blue area off to the side. Inspection of the area just downstream from the pictures here in the before and after show the complete obliteration of farms and vegetation together with the road to a height of 20+ meters above the bottom of the wadi. A little further upstream – a bit closer to the dam, the landscape has been scraped up to a height of 38 m! above the wadi bottom, where the width of the wadi is approximately 200 m across. The height of this point is ~215 m above sea level (at least 10 m higher than the top of the dam!).
A similar story can be constructed for the pictures of the lower dam in the right column. The dams were minor inconveniences to the flow of the total volume of the storm water.
The Wadi Derna drains a large and relatively barren plateau with some of the weirdest landforms I have seen, and could possibly be organized so it receives large volumes of water from a number of subsidiary drainages at the same time. Or, more likely, the insanely hot Mediterranean air was supersaturated with water, and the storm dynamics led to rapid cooling that squeezed all of the water out over a very short period of time….. And the barren plateau lacked soil and vegetation to slow the flow of the water once it hit the ground, and simply demonstrated what can happen when the Earth System has too much energy to dissipate all at once in the form of climate catastrophes.
Consequently….
Our planet is progressively becoming uninhabitable!
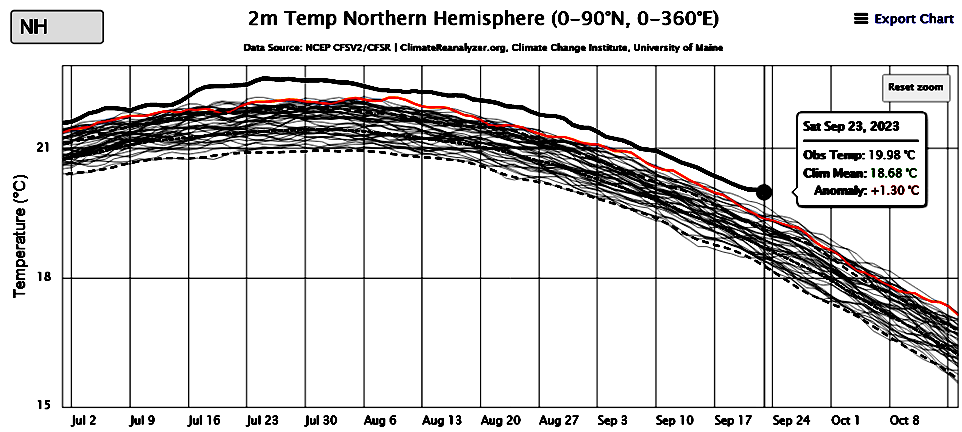
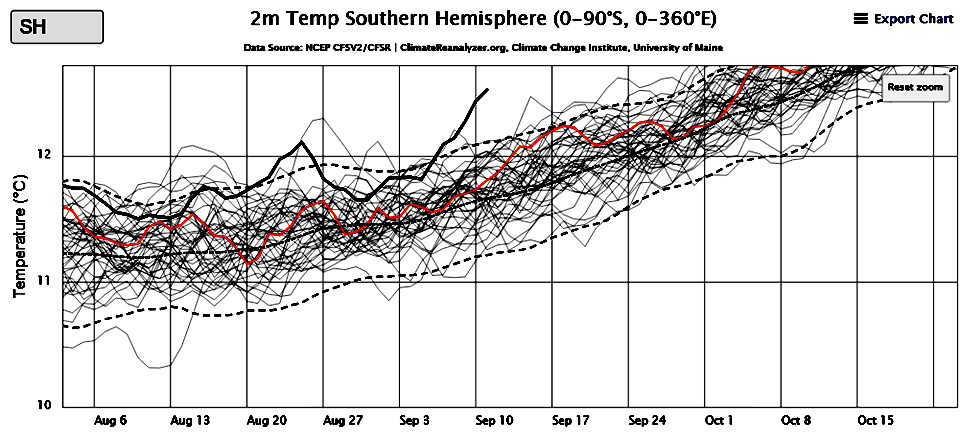
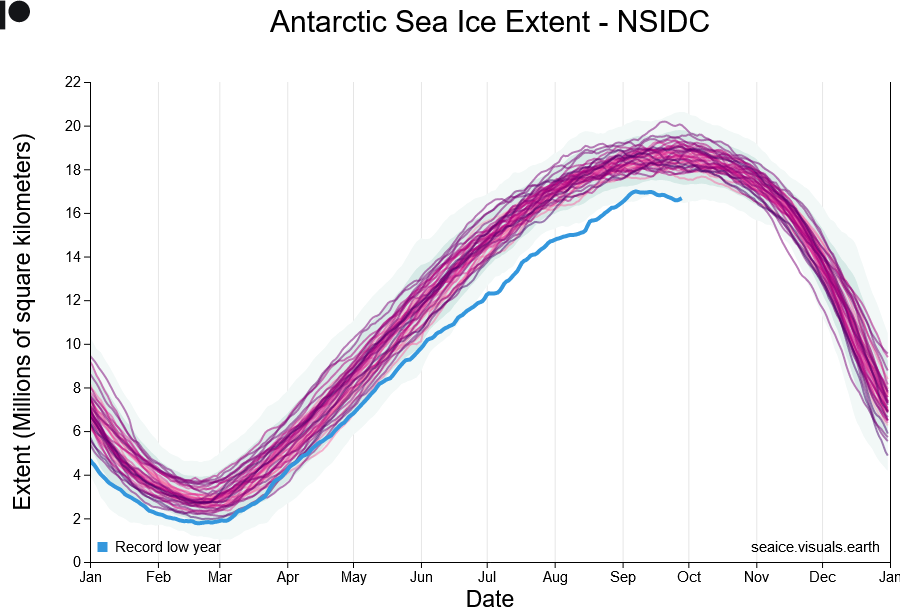
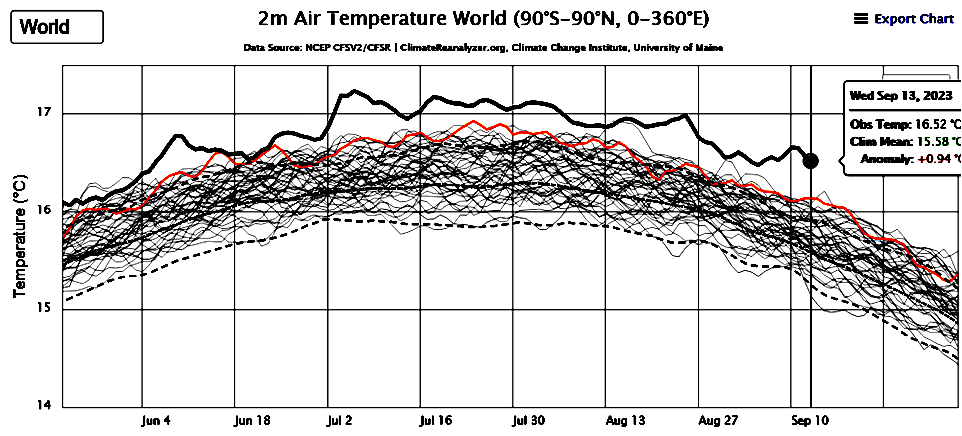
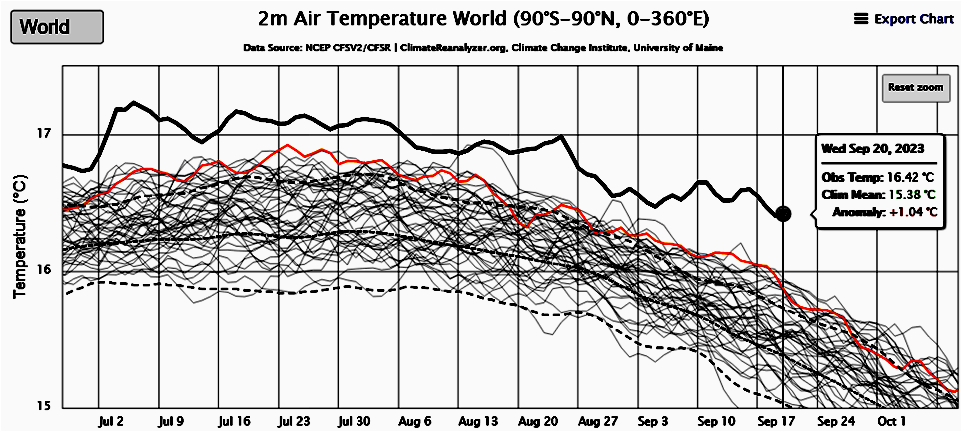
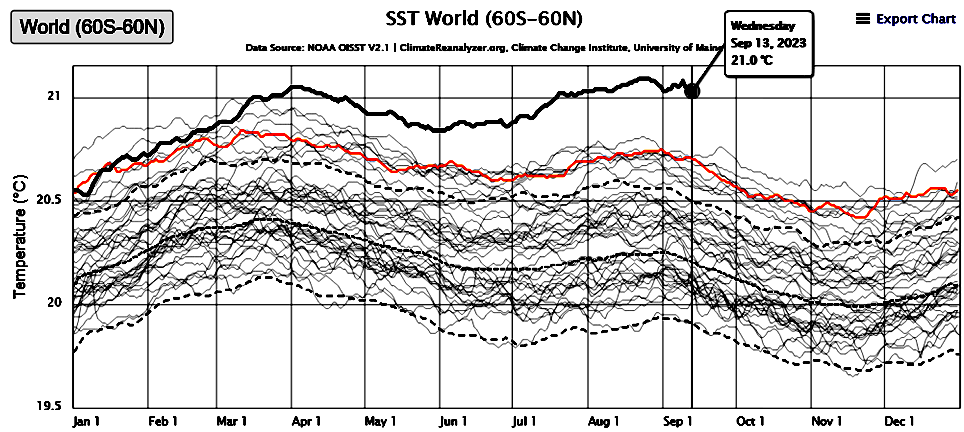
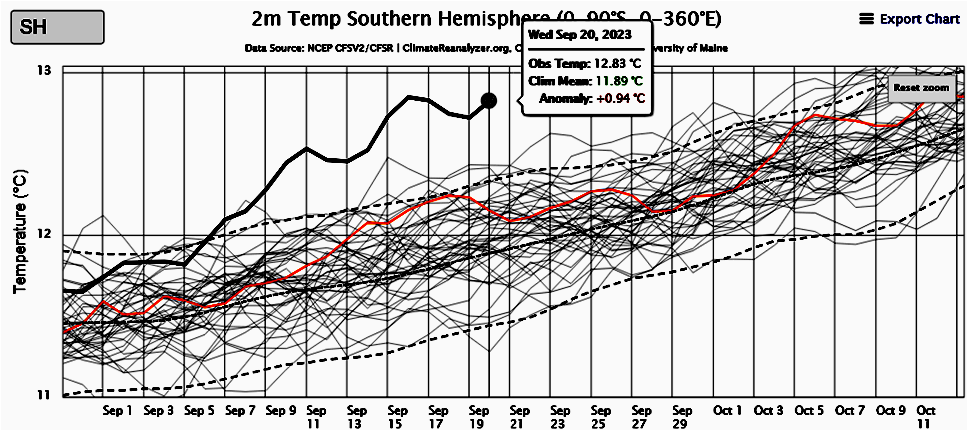
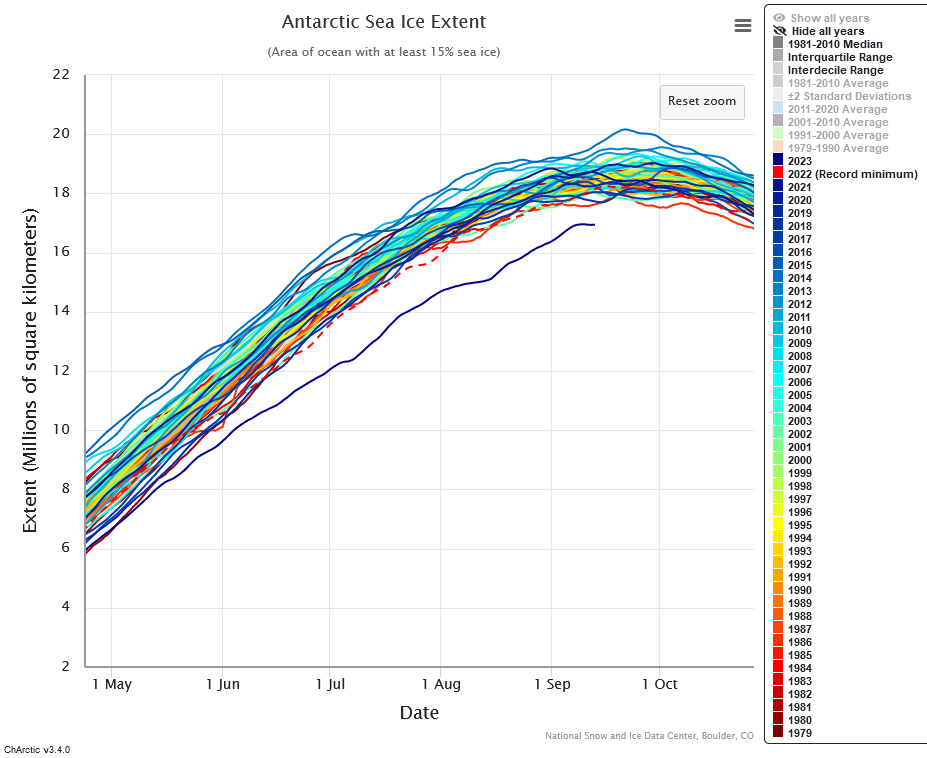
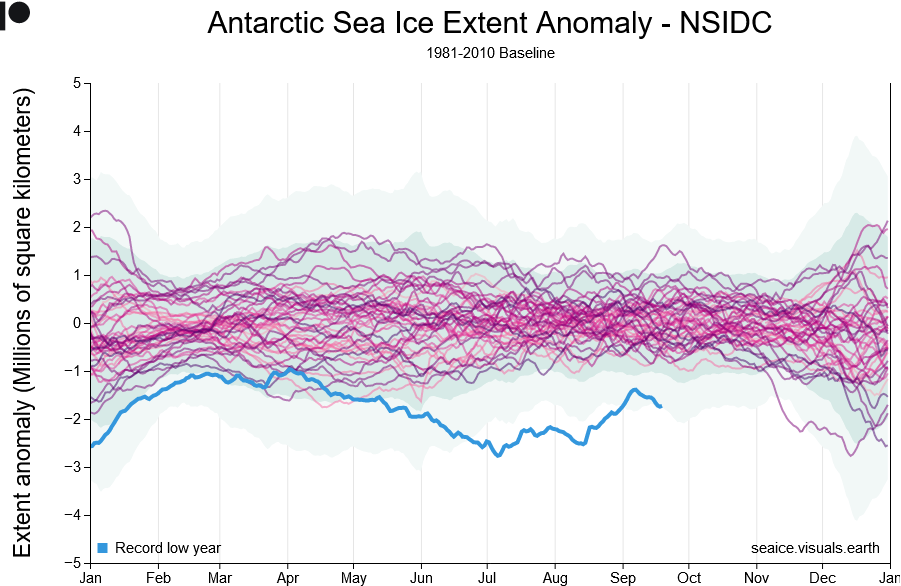
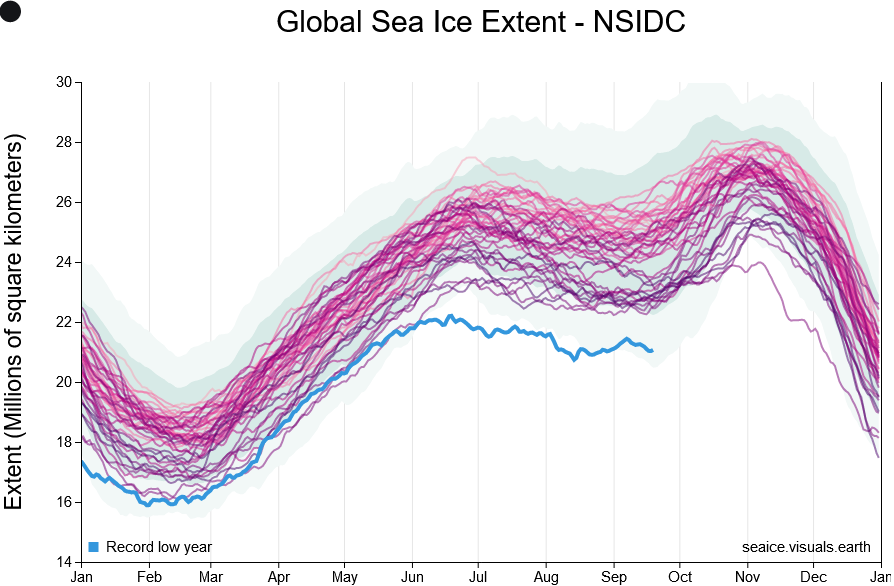
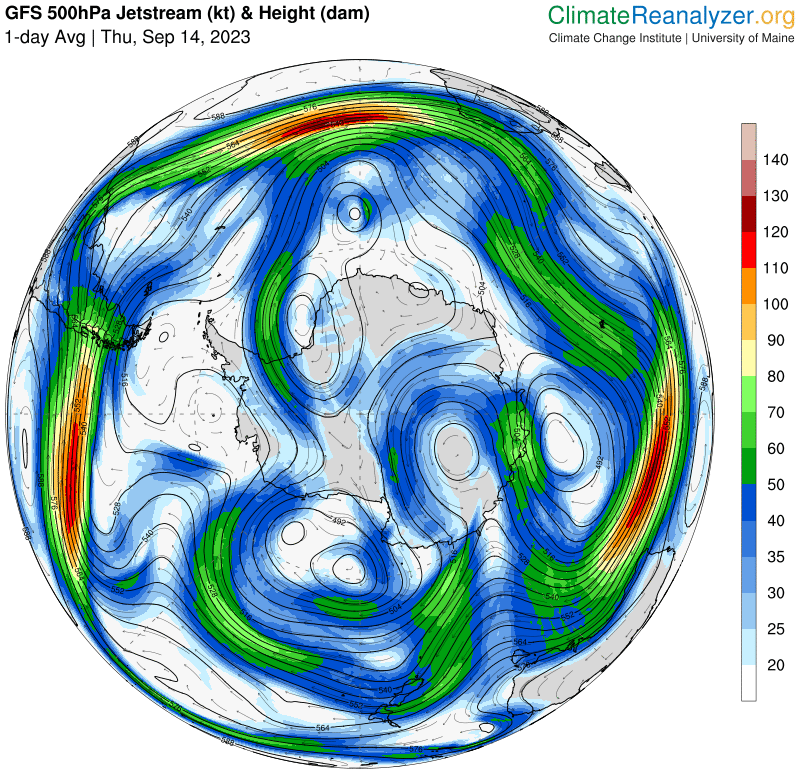
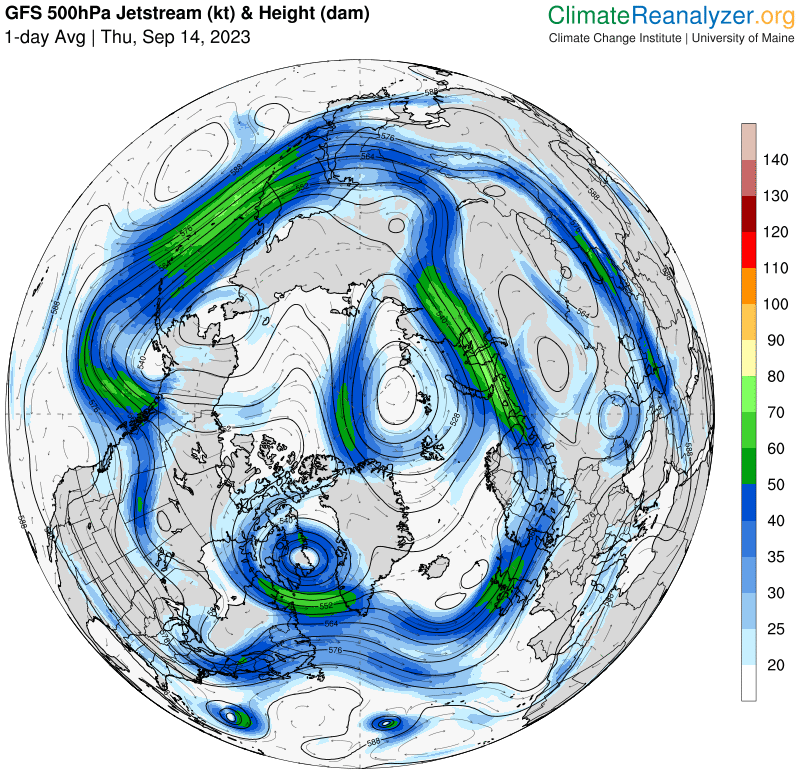
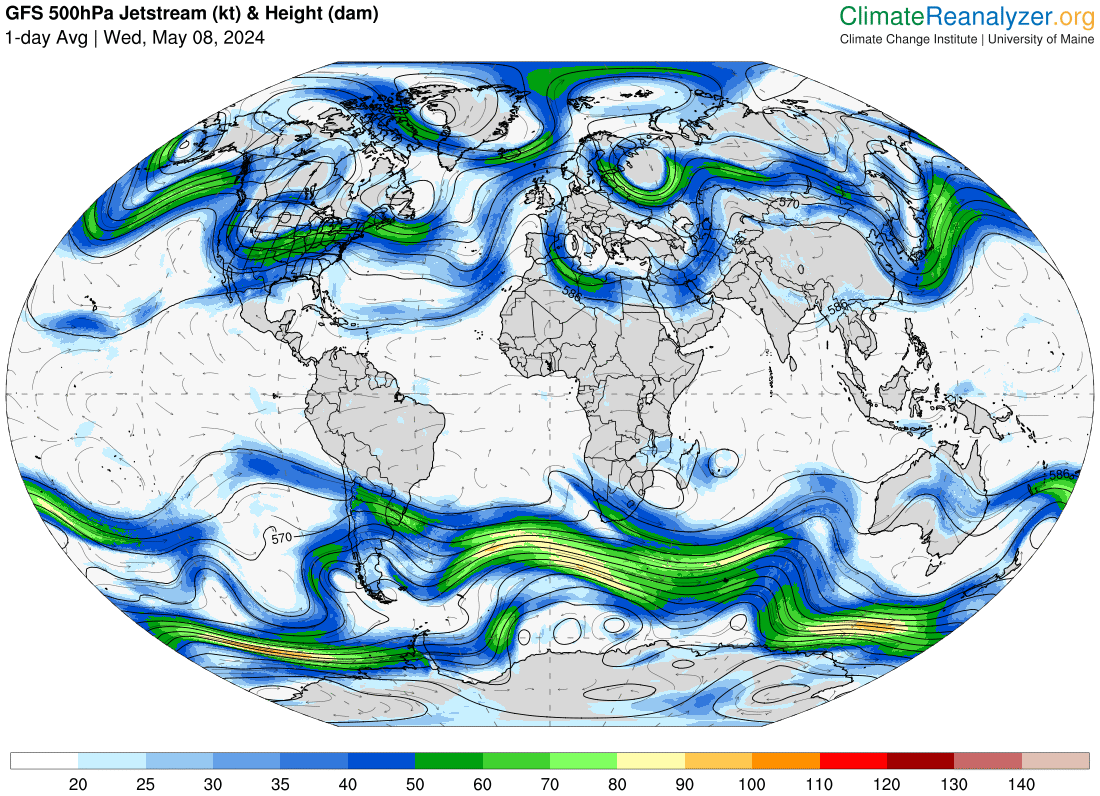
Not yet getting back to anything as cool as last year’s near record highs after more than 3 months! – https://climatereanalyzer.org/clim/t2_daily/?dm_id=world3+ months and the anomaly is still trending ever more extreme as the sub-solar point moves towards the Southern Hemisphere!Global Average Sea Surface Temperature still above previous years ALL TIME RECORD HIGH TEMPERATURE with trend line still widening the gap. 90% of excess solar heat is first absorbed into the oceans to heat the globe as a whole. – https://climatereanalyzer.org/clim/sst_daily/Southern Hemisphere anomaly also in record extreme territory and rising rapidly. Antarctic rising and ~1 day from record daily high.Sept. 13 and Antarctic sea ice already beginning to melt after 4+ months of record low freezing rate, to create a global average record low amounts of sea ice. At the southern summer low to come will there be ANY sea ice left around Antarctica? What does this mean for ice shelves and glacier fronts exposed to warm pounding waves and tides? – https://nsidc.org/arcticseaicenews/charctic-interactive-sea-ice-graph/Sept. 19 and the ice is rapidly melting into ever more extreme low sea ice for the date.Sept 19 and rapid Antarctic melting keeps global coverage more than 4 σ below any previous low for the date. Not good news for southern summer! https://seaice.visuals.earth/ Record high temperatures & reduced temperatures between polar and ‘temperate’ zones lead to crazy, weak and chaotic jet streams; in turn allowing stalled extreme heat domes, droughts and wildfires; lethally moist air masses, biblical flooding, and catastrophic storms. OUR GOVERNMENTS ARE STILL PROMOTING AND SUBSIDIZING FOSSIL FUEL BURNING!
It’s truly astonishing how hot the North Atlantic was this summer. 2.3F above normal (+1.3C) and about 1F or .5C above records. It may not sound like much but it’s tremendous – This is for a huge area from the equator to the southern tip of Greenland and from Florida to the UK. https://t.co/M6Wapdbo5jpic.twitter.com/D2mj0iKBRy
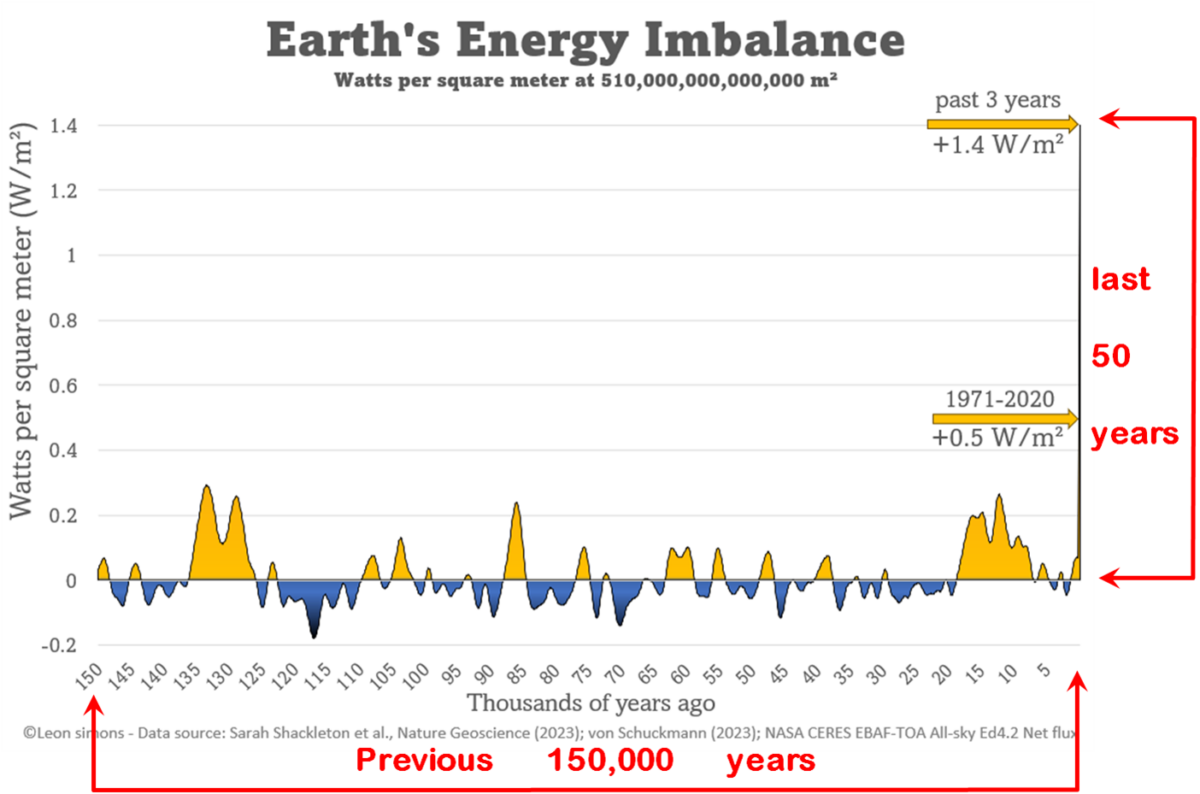
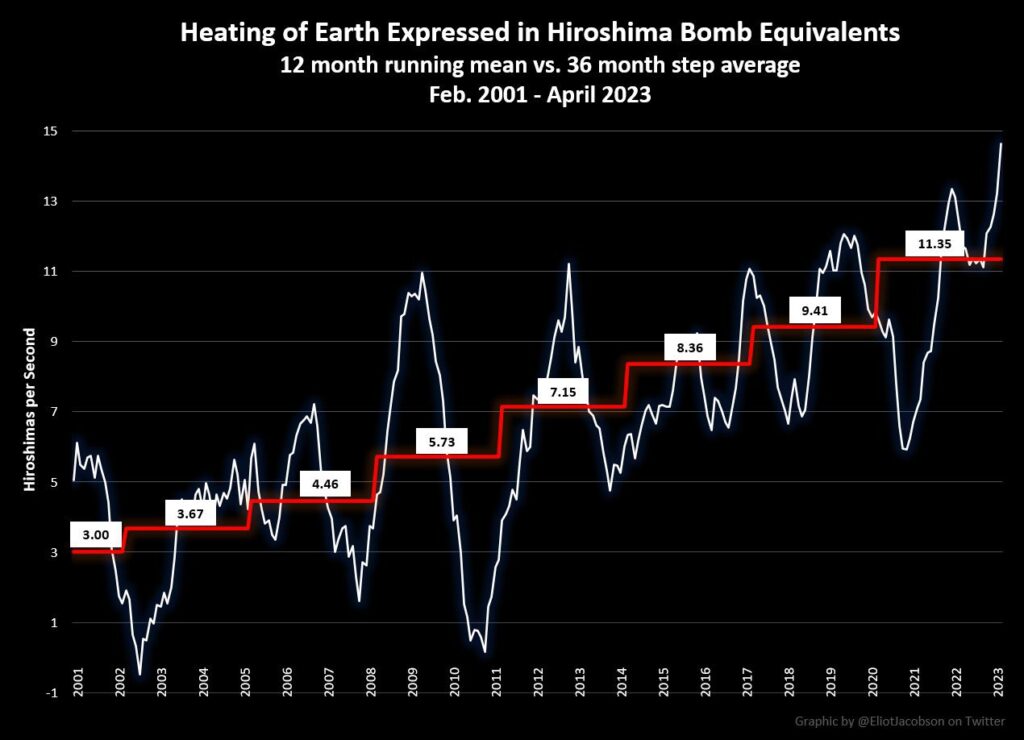
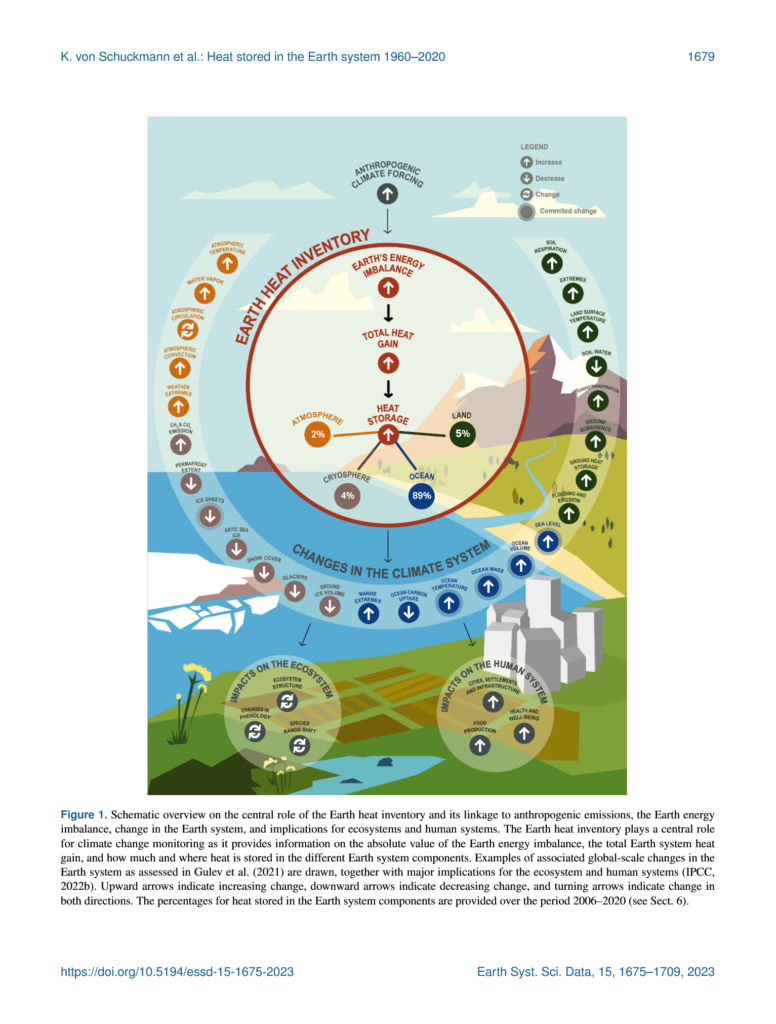
Leon Simons [Mission: To understand & protect the home planet. Innovator, climate researcher, social entrepreneur. Board member Club of Rome NL], who works outside the ‘reticence’ imposed by the usual academic and institutional employers considers the significance of recent reports on the Earth’s energy imbalance. Note: Simons is a coauthor on at least two peer reviewed scientific reports in this area.
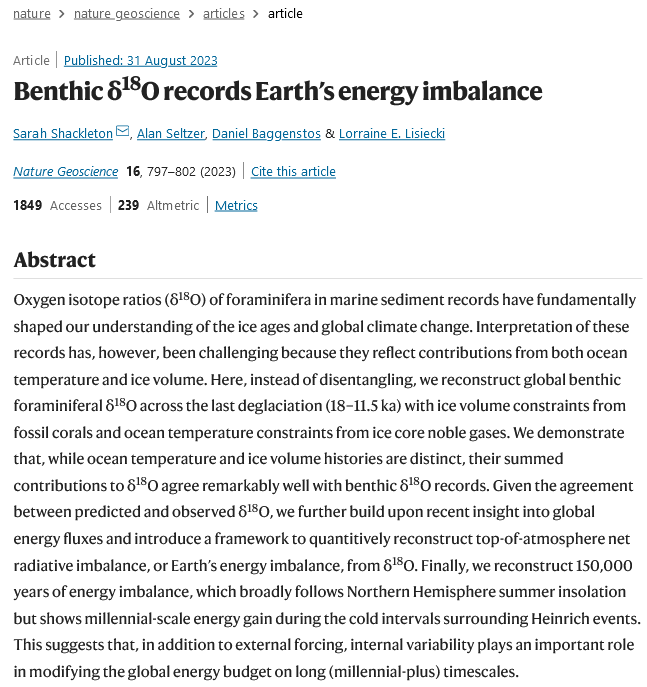
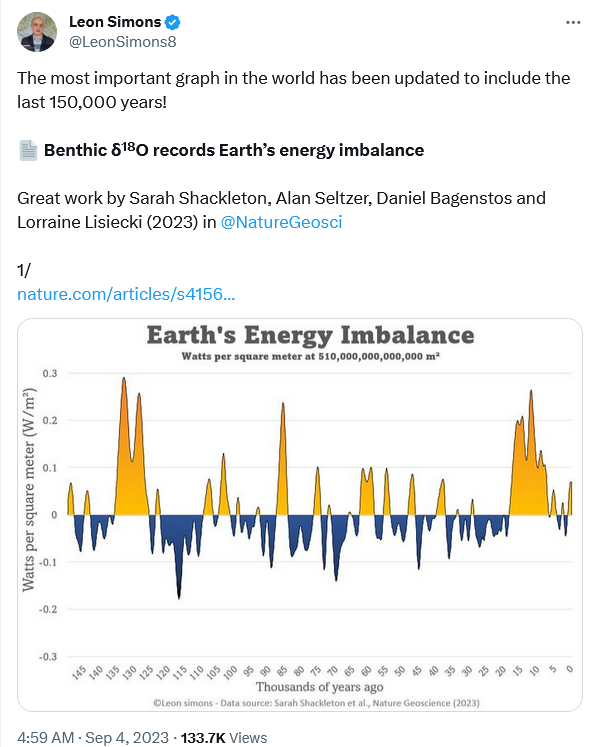
Simons puts the previous graphs in a geological context based on Shackleton et al’s reconstruction of variations of Earth’s energy balance determined from measurements of Oxygen isotope ratios in sediment cores from the seabeds.
The thread from https://twitter.com/LeonSimons8/status/1698413266421096893 explains in some detail how the following graph was inferred and extrapolated from the above. At first I found it difficult to make sense of this graph until I grasped that the vertical line defining the right-hand side of the graph was data, comparing the imbalance observed directly over the last 50 years, with the variation recorded over the last 150,000[!] years, not the border….
Simons was one of the coauthors of the above paper.
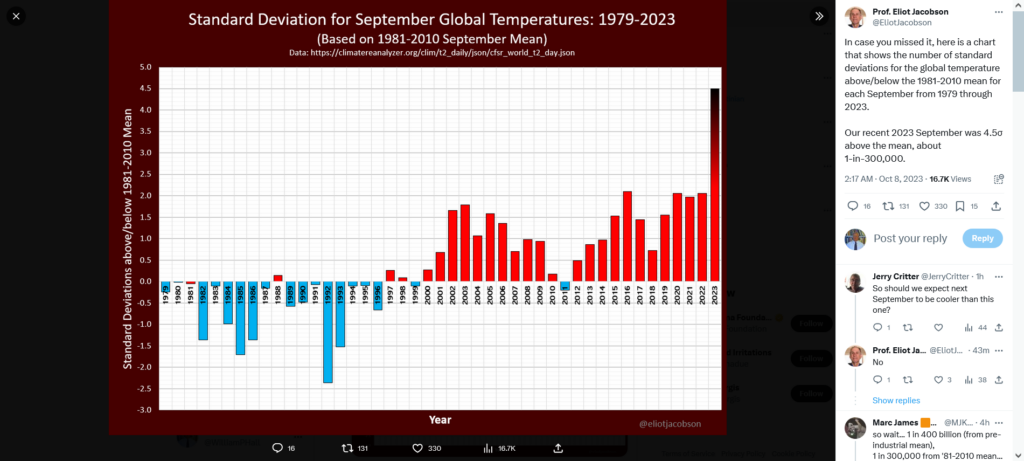
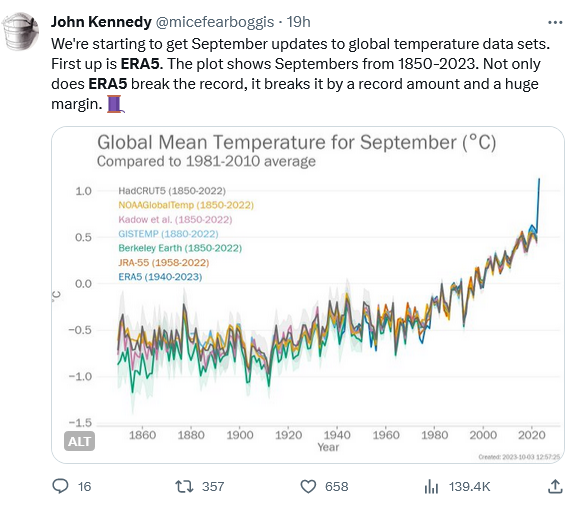
ERA5 September 2023 monthly data are out.
I'm still struggling to comprehend how a single year can jump so much compared to previous years.
Just by adding the latest data point, the linear warming trend since 1979 increased by 10%. pic.twitter.com/AnNAbyUQwY
Note that the following X-Tweet is limited to the United States – based on a Scientific American article. The rest of the world is suffering at least as much! Total costs are adjusted for inflation. It isn’t clear whether this also applies to the individual “billion dollar” events in the graph below.
Given the rapidly growing accumulation of excess heat in Earth’s oceans, if we cannot stop and reverse global warming within the next few years the inevitable result will be ecological and social collapses, within a few decades, and likely global extinction of most complex organisms — including humans within a century or so….
We must act before it is too late!
Featured Image
Based on an image by Leon Simons, https://twitter.com/LeonSimons8/status/1698410404693594417 depicting the urgent existential problem facing humanity today: If we cannot reverse the heating spike forming the right-hand border of the graph and force it below the neutral line forming the graph’s X axis within a few years, most complex life on Earth will be extinct in a century or so.
Views expressed in this post are those of its author(s), not necessarily all Vote Climate One members.
Climate change, driven by burning fossil fuels, contributing to the Great Deluge, is consigning Australia to escalating climate disasters
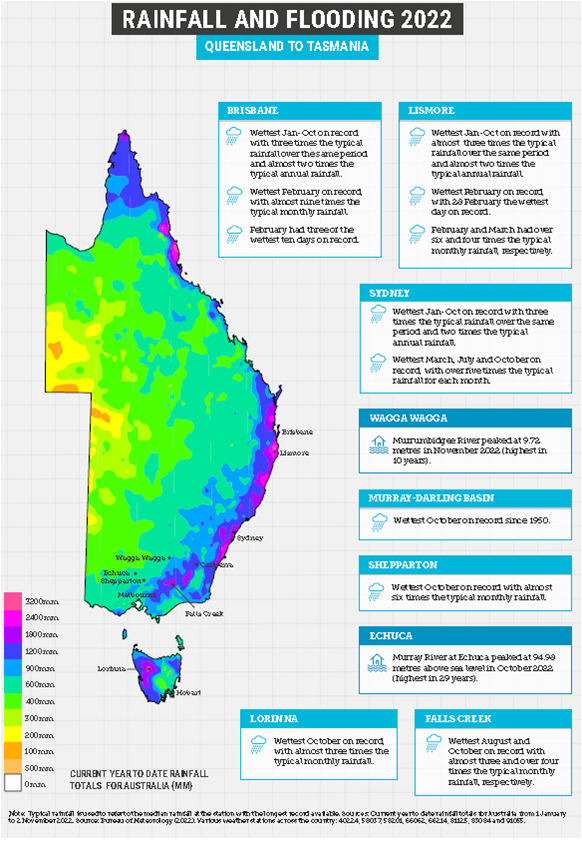
Most of Australia’s East Coast from Cape York south to the Victorian border has had over a meter of rain by the end of October — with the rains still continuing. Some of these areas have had more than 2 meters, and a few more than 3 meters! Many rainfall records have been smashed in all of the eastern states: Queensland, New South Wales, Victoria, Tasmania; leading to almost constant flooding through the whole area that is continuing today. The latest reports from the BOM tell us the rains will continue into summer.
This is clearly a function of global warming. Physical laws dictate that as air temperatures rise, the air can carry more water vapor before it begins to condense as rain. Higher temperatures increase the rate of evaporation of water from soils and standing water – encouraging drought. Seemingly contradictory warmer air can precipitate more water in areas where it is raining. As the water condenses out as rain it also releases its ‘heat of fusion’ — and more heat is available to drive more extreme winds able to carry rain to high elevations before the rain freezes to fall back to Earth in devastating hail storms. Over larger areas there is also more energy available to fuel increasingly powerful cyclones.
Increased water means increased plant growth, increased temperature increases the rate at which soils and vegetation dry out — ensuring ever more catastrophic wildfires.
Ever more floods, fires and tempests cause increasing damage to infrastructure and people’s livelihoods and property until the catastrophes follow one another so closely that there are simply not physical or human resources left to repair the damage from one catastrophe before the next catastrophe causes even more damage. If the warming is not stopped this progression leads inevitably leads to social collapse (as we are already seeing in parts of the world), agricultural collapse (and famines as we are already beginning to see in Africa and the Middle East), ecological collapse (as we are already seeing in marine habitats with coral reef communities, kelp beds, sea grass meadows), and finally, population collapses when the land has literally been swept bare (areas in Africa are already on the edge of the cliff).
With the collapse of society, humans will quickly lose the scientific and engineering capabilities to fight further climate change already dialed into the system, such that there will be little hope of avoiding near-term global mass extinction. Continuing ‘business as usual’ support of the fossil fuel industry more-or-less ensures this grim outcome.
The Climate Council’s report, presented below, presents the facts and explains what they mean here in Australia, and some of the things we can to moderate and mitigate the expected damages. This is a good start, but I would be a silly liar if I said this was all we need to do in order to keep from utterly destroying our future.
Vote Climate One will continue to do whatever we can do to encourage serious government leadership and action to fight climate change. Please do what you can to pressure your representatives to counteract the self-serving special interests who consume our resources and return little or nothing from the super-profits they take overseas.
If we can help get climate savvy governments on the problems that really matter, they may be able to mobilize enough action so we can survive our accidental disruption of Earth’s Climate System so our kids and grandkids inherit a world they can live in….
Let’s hope that we can stop global warming soon enough to leave them with a future where they can survive and flourish
Featured Image: Rainfall and Flooding 2022 – Queensland to Tasmania. Current year data from 1 January to 2 November, sourced from Bureau of Meteorology, 2022. Graphic from Chapter 2, The Great Deluge: Climate Extremes in Action, in the featured article.
Views expressed in this post are those of its author(s), not necessarily all Vote Climate One members.
Smoke and Sandstorm, Seen From Space: A time-lapse image of smoke from wildfires in New Mexico and dust from a storm in Colorado illustrates the scope of Western catastrophe.
The video is mesmerizing: As three whitish-gray geysers gush eastward from the mountains of New Mexico, a sheet of brown spills down from the north like swash on a beach.
What it represents is far more destructive.
The image, a time-lapse captured by a National Oceanic and Atmospheric Administration satellite, shows two devastating events happening [at the same time] in the Western United States. The first is a wildfire outbreak in northern New Mexico that started last month and has intensified in the past two weeks, fueled by extreme drought and high winds. The second is a dust storm caused by violent winds in Colorado.
Both are examples of the sorts of natural disasters that are becoming more severe and frequent as a result of climate change.
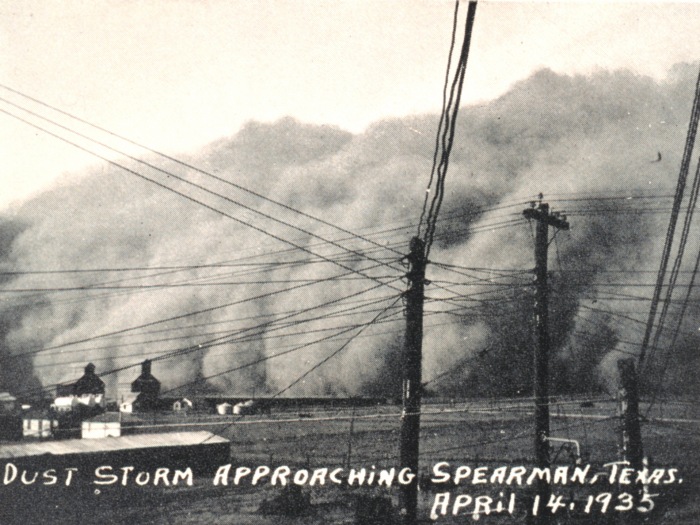
Featured Image: A dust storm approaching Spearman. In: Monthly Weather Review, Volume 63, April 1935, p. 148. Date: 1935April 14 Location: Texas, Spearman …an excellent view of a dust storm that occurred at Spearman, Tex., on April 14, 1935. The photograph was submitted by the official in charge, Houston, Tex., and was taken by F. W. Brandt, cooperative observer at Spearman, Tex. Credit: US National Oceanic and Atmospheric Administration, National Weather Service / Public Domain / Wikipedia
Views expressed in this post are those of its author(s), not necessarily all Vote Climate One members.
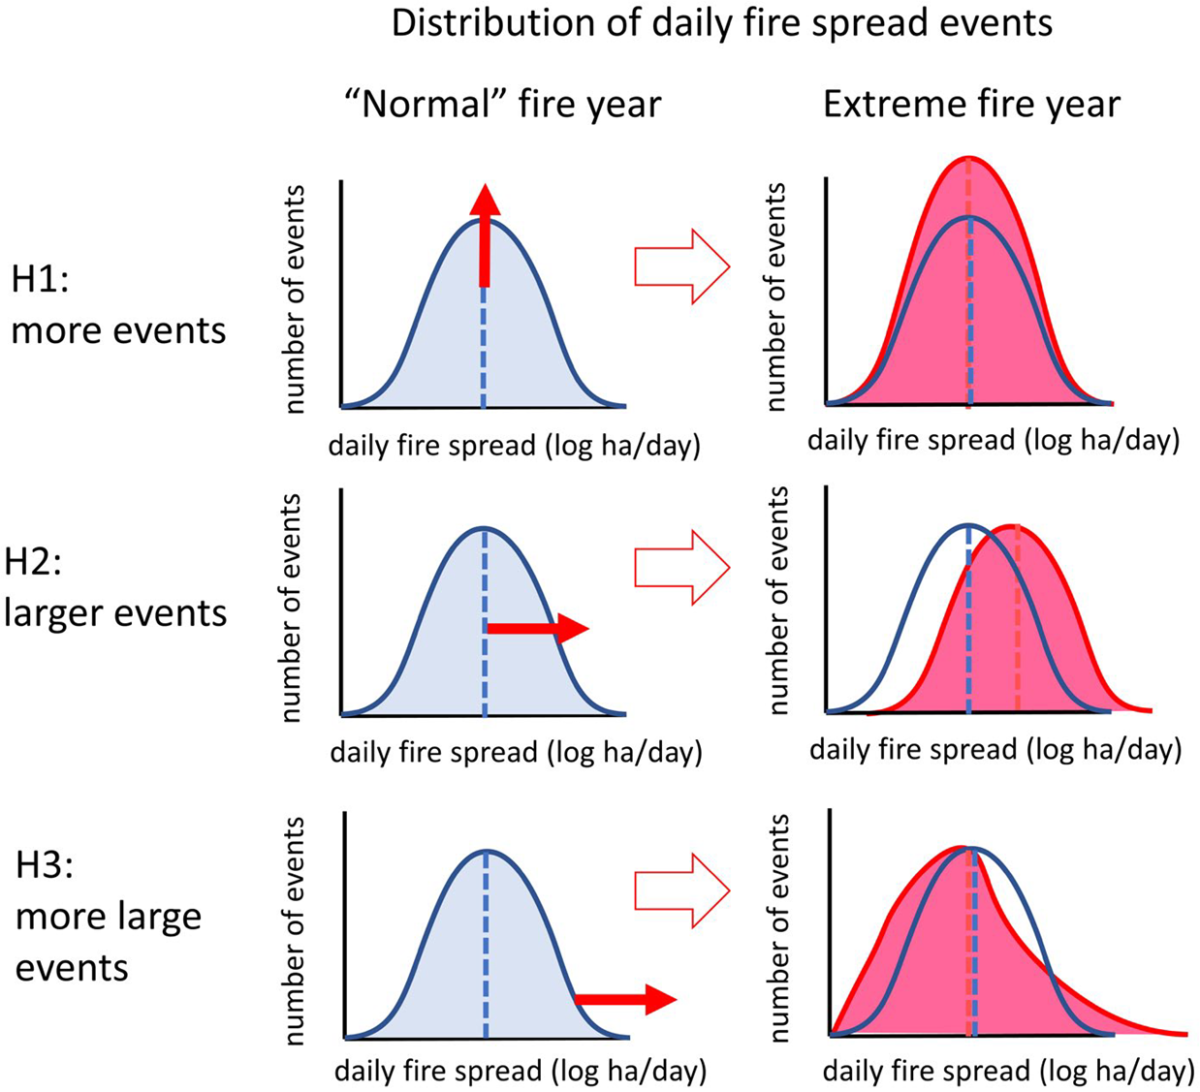
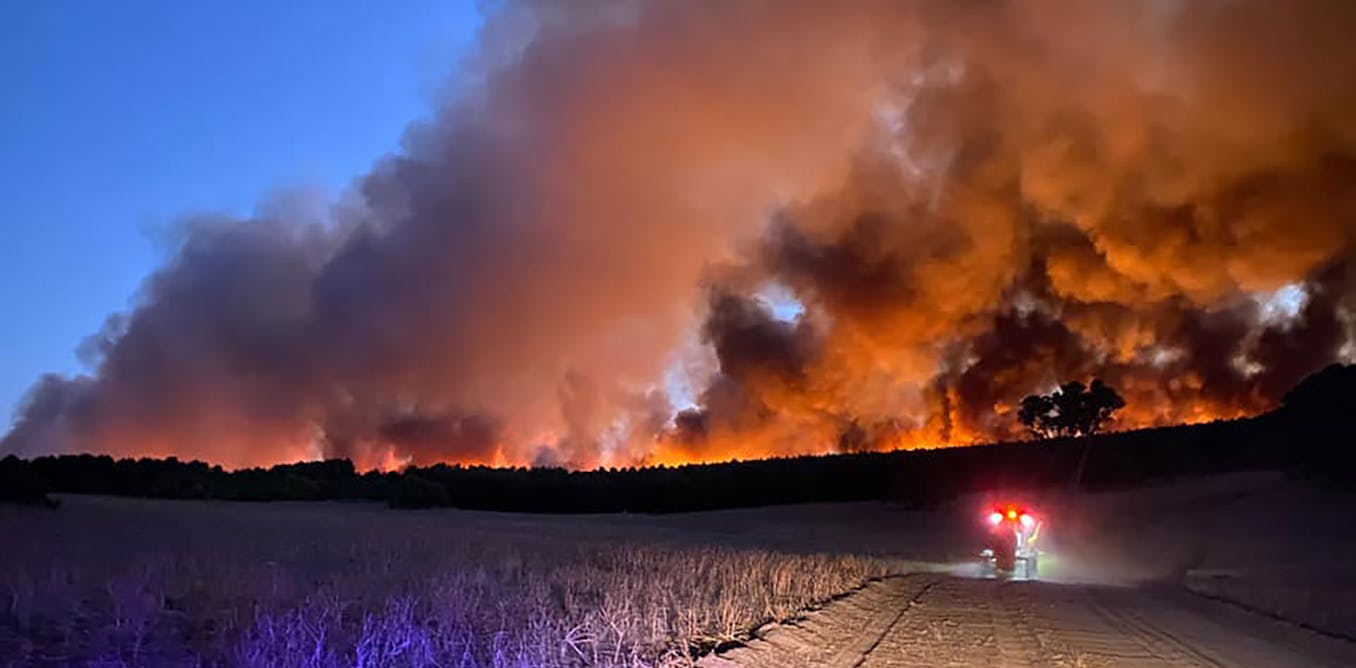
Results: Extreme single-day fire spread events >1,100 ha (the top 16%, >1 SD) accounted for 70% of the cumulative area burned over the period of analysis. The variation in annual area burned was closely tied to the number and mean size of spread events and distributional skewness towards more large events. For example, we identified 441 extreme events in 2020 that together burned 2.2 million ha across our study area, in contrast to an average of 168 per year that burned 0.5 million ha annually between 2002 and 2019. Fire season climate variables were correlated with the annual number of extreme events and area burned. Our models predicted that the annual number of extreme fire spread events more than double under a 2°C warming scenario, with an attendant doubling in the area burned.
Conclusions: Exceptional fire seasons like 2020 will become more likely, and wildfire activity under future extremes is predicted to exceed anything yet witnessed. Safeguarding human communities and supporting resilient ecosystems will require new lines of scientific inquiry, new land management approaches and accelerated climate mitigation efforts.
Featured Image: Hypothetical distribution of daily fire spread events during normal and extreme fire years. Increases in the annual area burned could potentially be accounted for by more fire spread events (number), larger event size (mean) and/or more large events (right skewness) / From the article
Views expressed in this post are those of its author(s), not necessarily all Vote Climate One members.
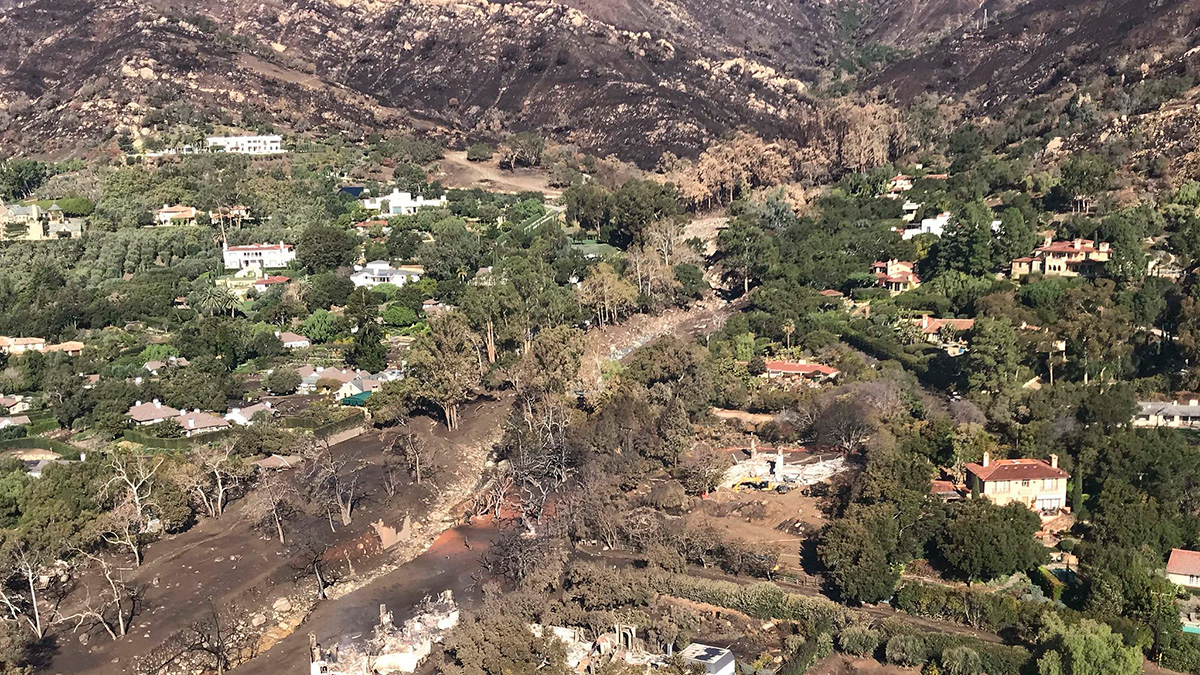
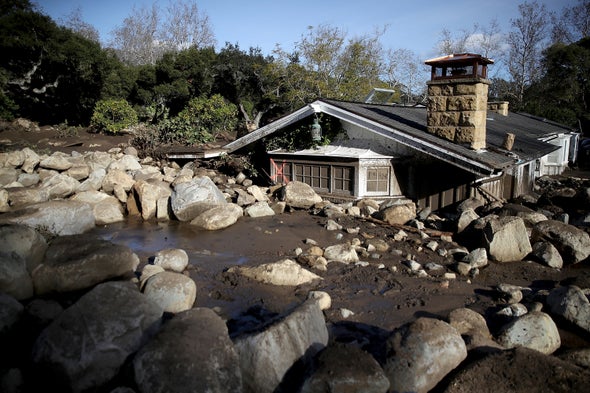
At 3:30 A.M. on January 9, 2018, half an inch of rain poured down on the charred slopes of the Santa Ynez Mountains in coastal southern California. The flames of the Thomas Fire—at the time the largest wildfire in state history—had swept through the previous month, leaving the soil and vegetation scorched and unable to soak up the onslaught of water. The destabilized ground gave way in a devastating landslide. Boulders crashed into houses in the town of Montecito, Calif., and a highway was buried under several feet of mud. The disaster killed 23 people and caused an estimate of around $200 million in damage.
Featured Image: This image from a rescue helicopter records the burn scar from the Thomas Fire, as well as the path of a deadly mudslide in Montecito, Calif., in January 2018. Credit: California National Guard, CC BY 2.0 / from No Relief from Rain: Climate Change Fuels Compound Disasters: Climate change is increasing the risk of fire-rain events, raising mudslide concerns in fire-prone communities. by Leah Campbell, 12/12/2021 in EOS.
Views expressed in this post are those of its author(s), not necessarily all Vote Climate One members.
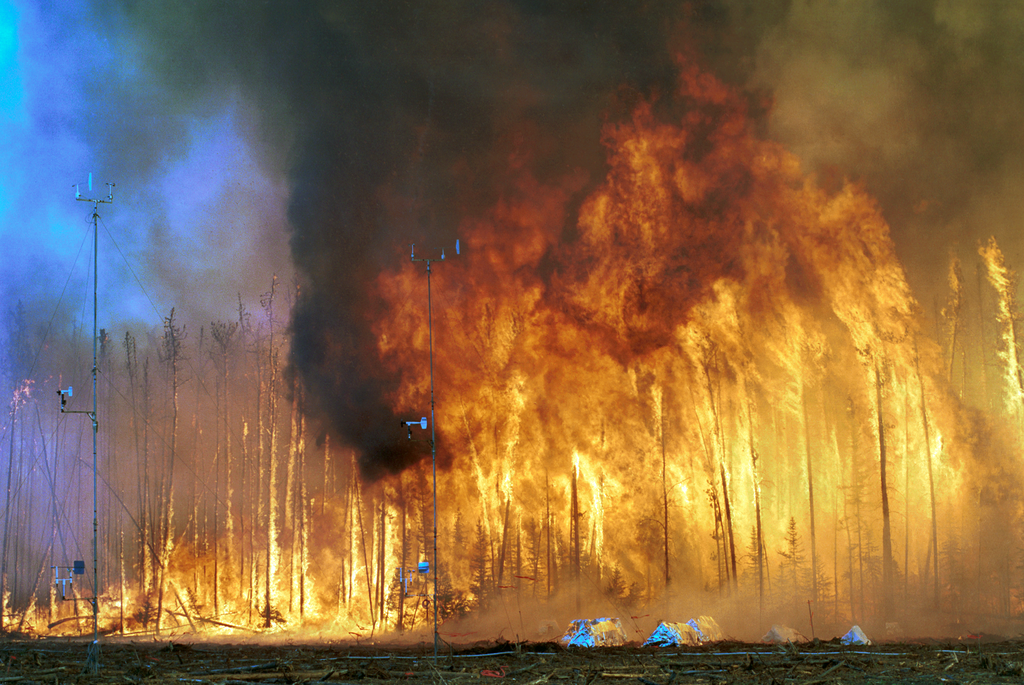
conditions conducive to higher frequency fires. In the coniferous boreal forest, the world’s largest terrestrial biome, fires are historically common but relatively infrequent. Post-fire, regenerating forests are generally resistant to burning (strong fire self-regulation), favoring millennial coniferous resilience. However, short intervals between fires are associated with rapid, threshold-like losses of resilience and changes to broadleaf or shrub communities, impacting carbon content, habitat, and other ecosystem services.
by Buma et al., 22/03/2022 in Scientific Reports
Views expressed in this post are those of its author(s), not necessarily all Vote Climate One members.
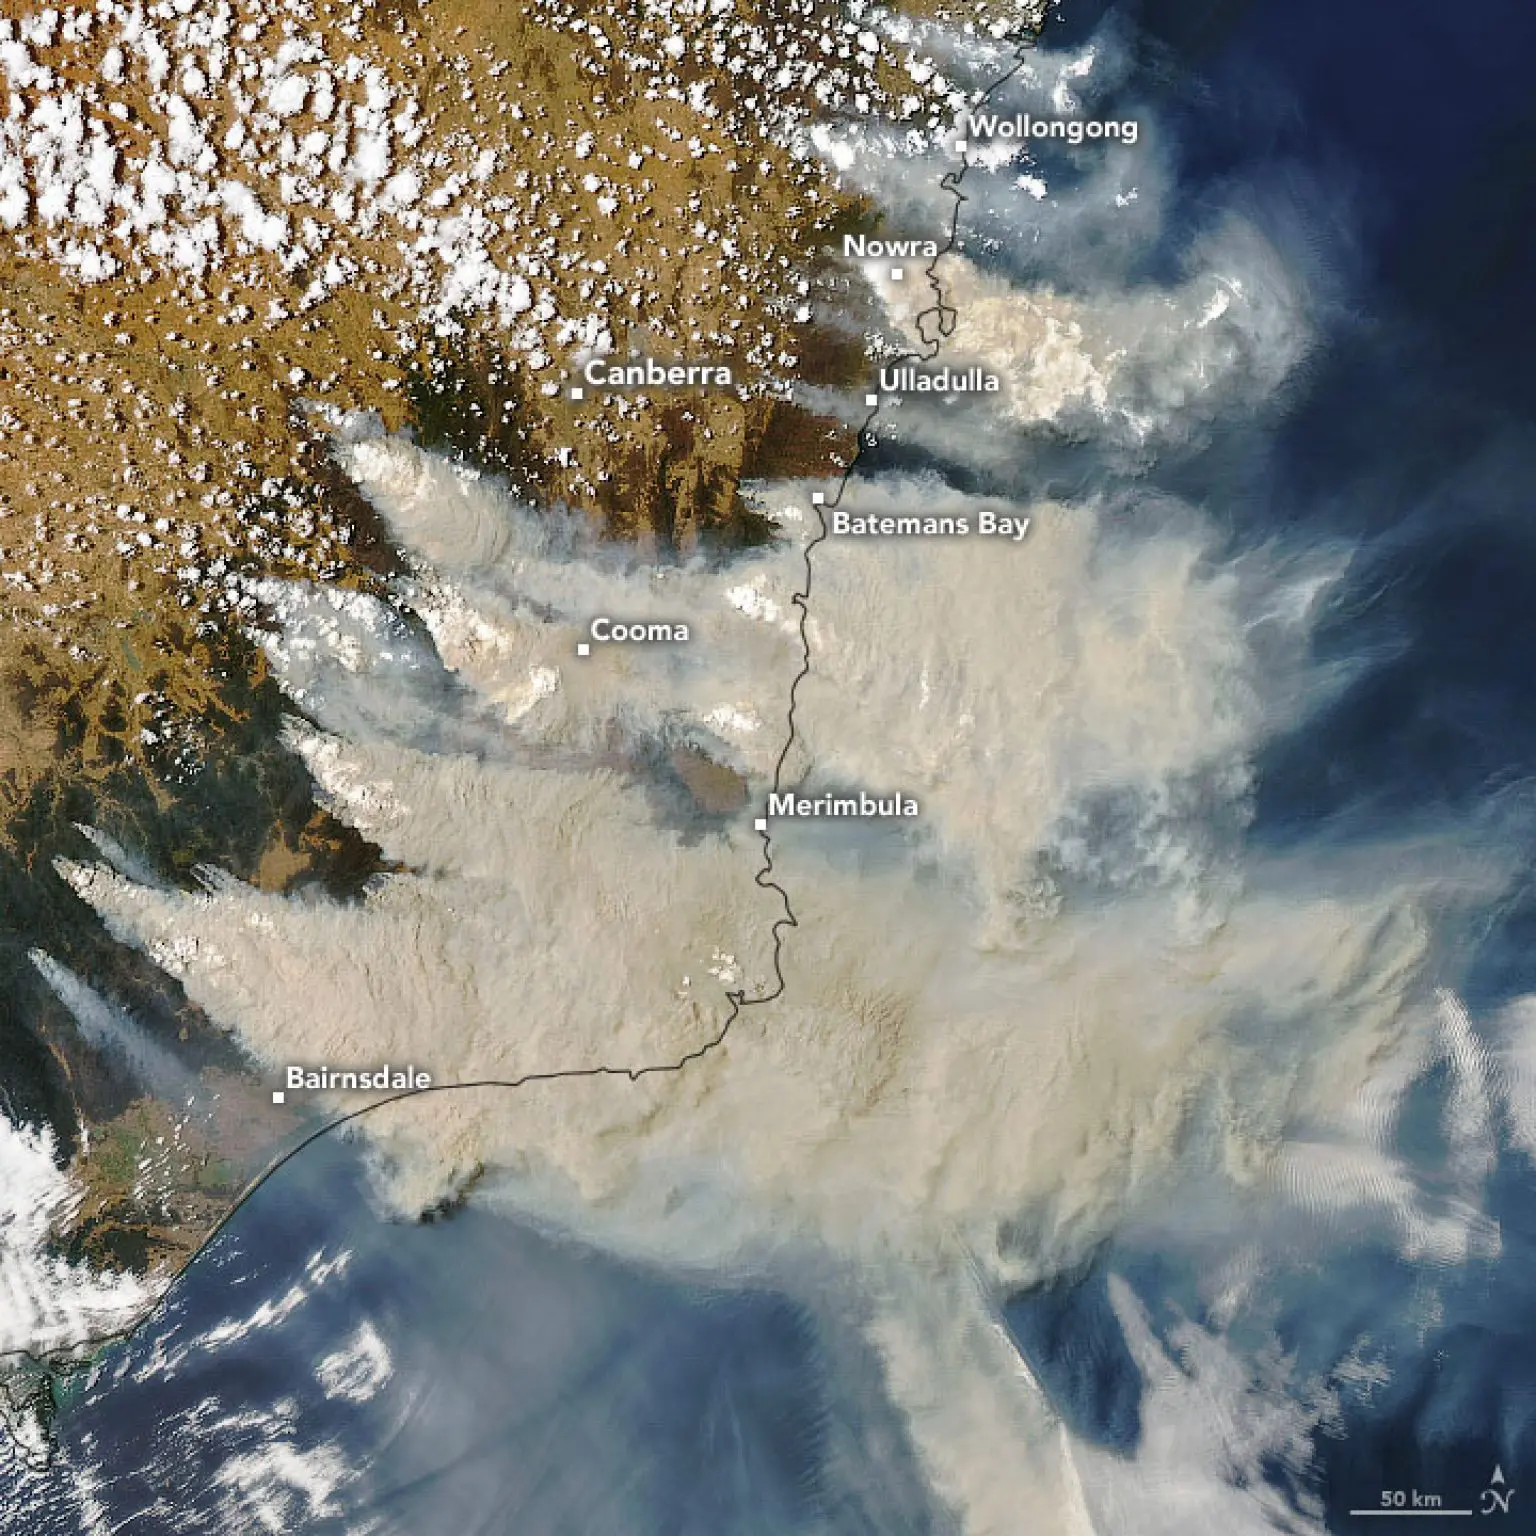
‘Brown carbon’ from burning forests, tundra, and peat soils drives temperatures higher in positive feedback loop with increasing global temps
Taken by NASA’s Aqua satellite on January 4, 2021, this image shows smoke from fires burning in southeastern Australia. NASA says it is likely that some of the white patches above the smoke are pyrocumulonimbus clouds, which resemble violent thunderstorms and can form above intense fires. Credit: NASA Earth Observatory image by Joshua Stevens. Picture via Australia’s “firenadoes” summon images of Hiroshima, atomic bombs By Dawn Stover | January 14, 2020 in Bulletin of the Atomic Scientists.
Source: Cell Press, 18/03/2022 in Science News
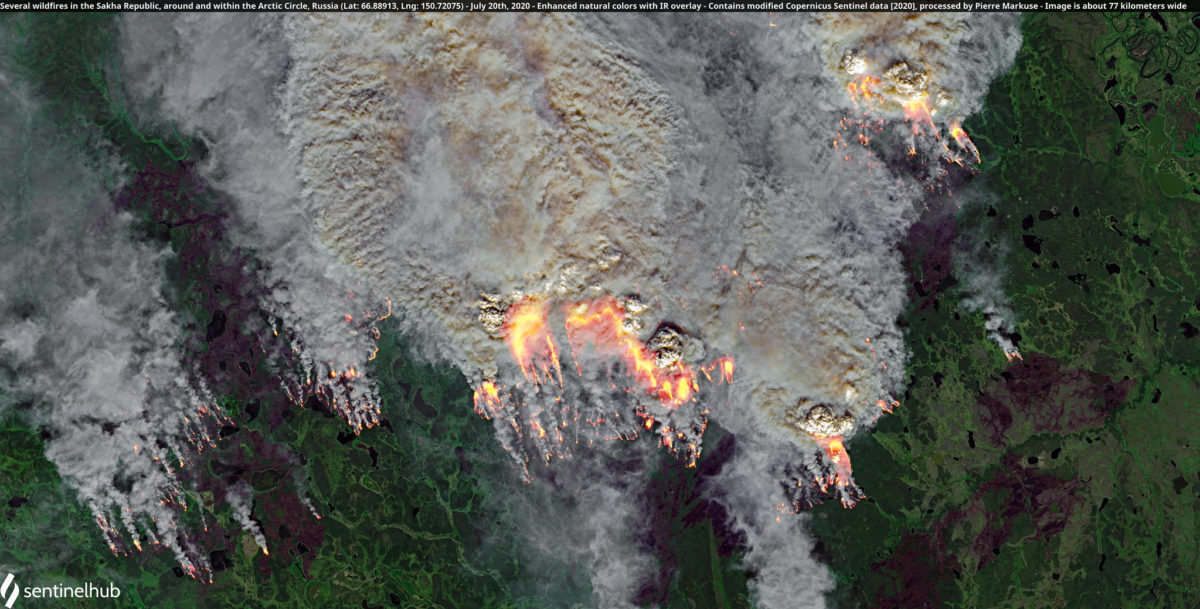
Wildfires devastate the land they burn, and they are also warming the planet: The 2021 wildfire season broke records globally, leaving land charred from California to Siberia. The risk of fire is growing, and a recent report warned that wildfires are on track to increase 50% by 2050. These fires destroy homes, plant life, and animals as they burn, but the risk doesn’t stop there. Researchers detail how the brown carbon released by burning biomass in the northern hemisphere is accelerating warming in the Arctic and warn that this could lead to even more wildfires in the future.
Featured Image: Several wildfires in the Sakha Republic, in and around the Arctic Circle, Russia (Lat: 66.88913, Long: 150.72075) – July 20, 2020 – Enhanced natural colors with IR overlay – Contains modified Copernicus Sentinel data [2020], processed by Pierre Markuse – Image is about 77 km wide. / Downloaded from Flikr
Views expressed in this post are those of its author(s), not necessarily all Vote Climate One members.
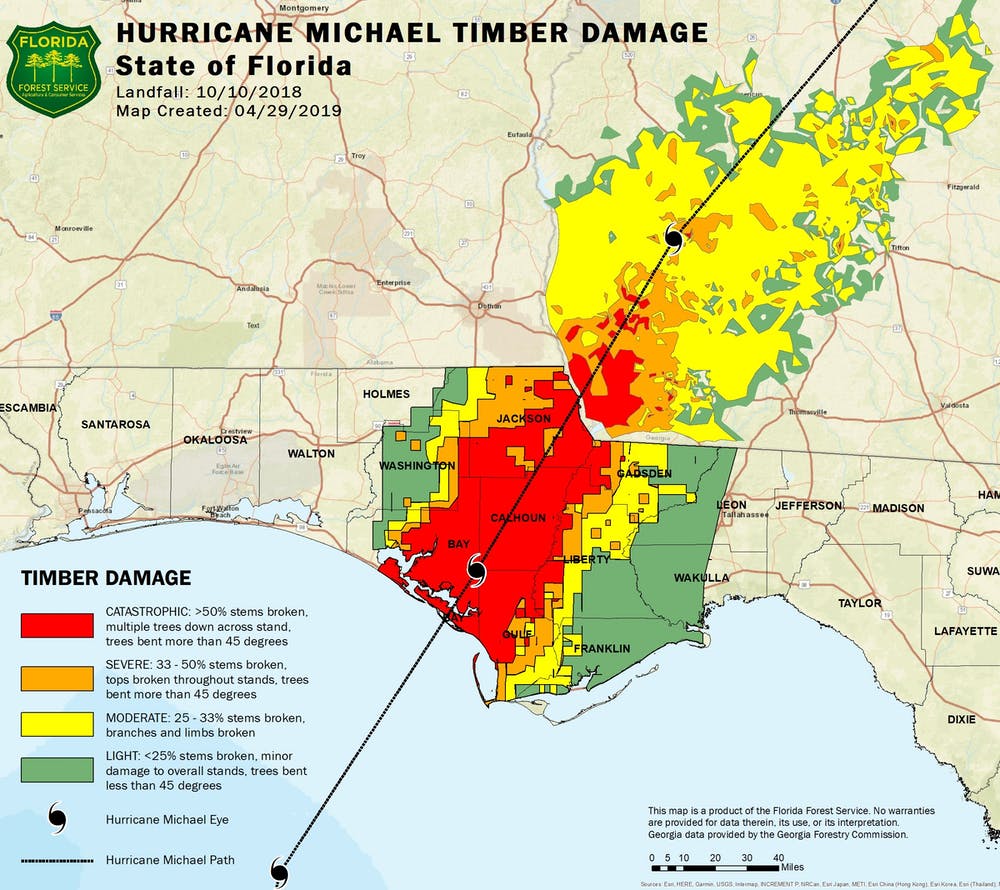
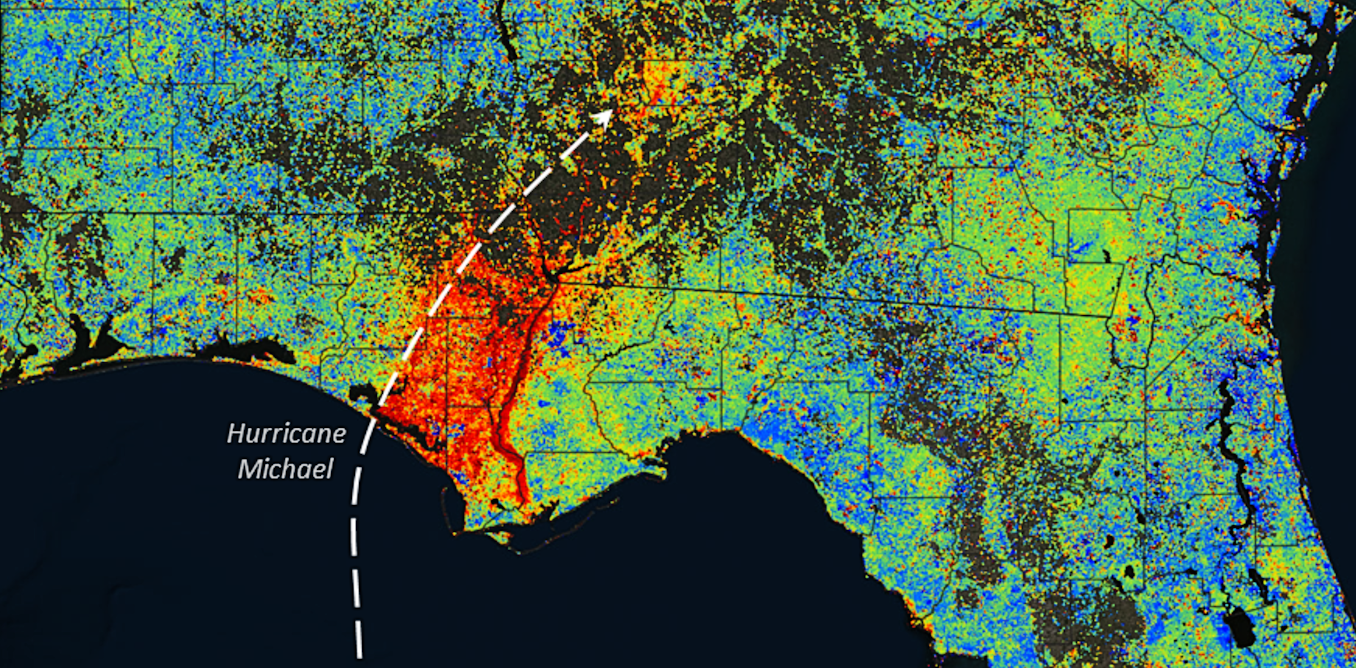
How a hurricane fueled wildfires in the Florida Panhandle: The wildfires that broke out in the Florida Panhandle in early March 2022 were the nightmare fire managers had feared since the day Hurricane Michael flattened millions of trees there in 2018. It might sound odd – hurricanes helping to fuel wildfires
. But Michael’s 160 mph winds left tangles of dead trees that were ready to burn.
Featured image:Using satellites, the Florida Forest Service mapped the damage to timber in the Panhandle. Florida Forest Service / via The Conversation article.
Views expressed in this post are those of its author(s), not necessarily all Vote Climate One members.
There is no good news in the IPCC’s AR6 pt II report on impacts of ongoing global warming. If frequent, catastrophic risks will be uninsurable.
The problem with most extreme weather events like wildfire, floods, droughts, cyclones, etc., is that their catastrophic effects normally cover large areas.
Insurance companies are only profitable if premium payments produce more income than is paid out on claims for losses over the number of customers. If only a small proportion of insured people make claims, the company can still profitably sell the policies for a small fraction of the average payout, such that people can expect full payouts on the claims made, even though the premium paid is only a fraction of the payout.
Even in the case of widespread catastrophes, if such catastrophes are rare enough over the world, a retail insurance company can insure themselves against a huge payoff by buying re-insurance from a specialist company betting that the total number of catastrophic risk events will be small relative to the policies they sell. Both the retail insurer and the reinsurer can still make a profit to stay in business.
However, if catastrophic loss events become too common, to stay profitable insurers have to charge premium fees that become such a large fraction of the cost of the possible loss that customers simply can no longer afford to pay the premium cost, as many people and businesses located in areas such as flood planes, bush lots in fire prone regions, and low-lying coastal area susceptible to cyclones and rising sea-levels deemed to be at high risk of catastrophic losses.
Thanks to rising rates and ferocities of wildfires and intense flooding many people are discovering that their catastrophic risks of total loss in such events are no longer insurable at an affordable cost — even assuming they can find someone willing to sell them such a policy.
As explored in the attached news items, the just released IPCC report tells the insurance industry that the frequency of catastrophic risk events is likely to continue rising, at an accelerating rate as the world continues to warm. This will undoubtedly mean that many more people and businesses will no longer be able to find insurance against total loss in the event of a climate catastrophe.
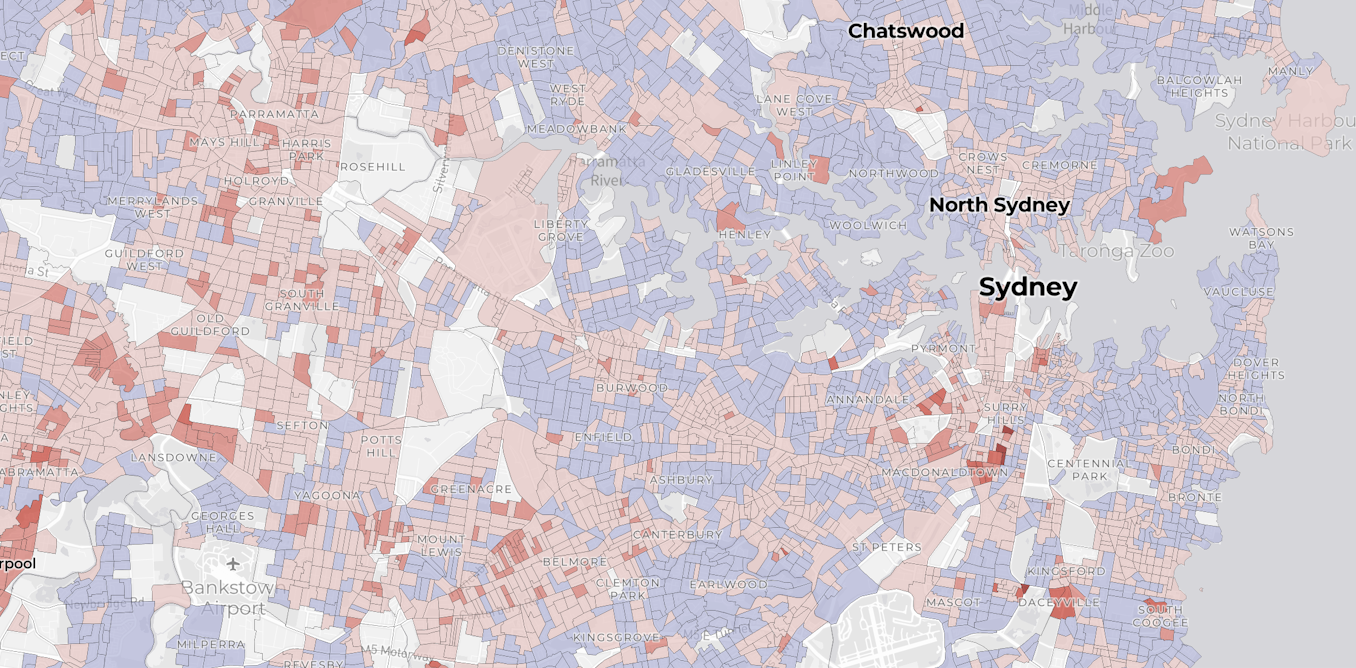
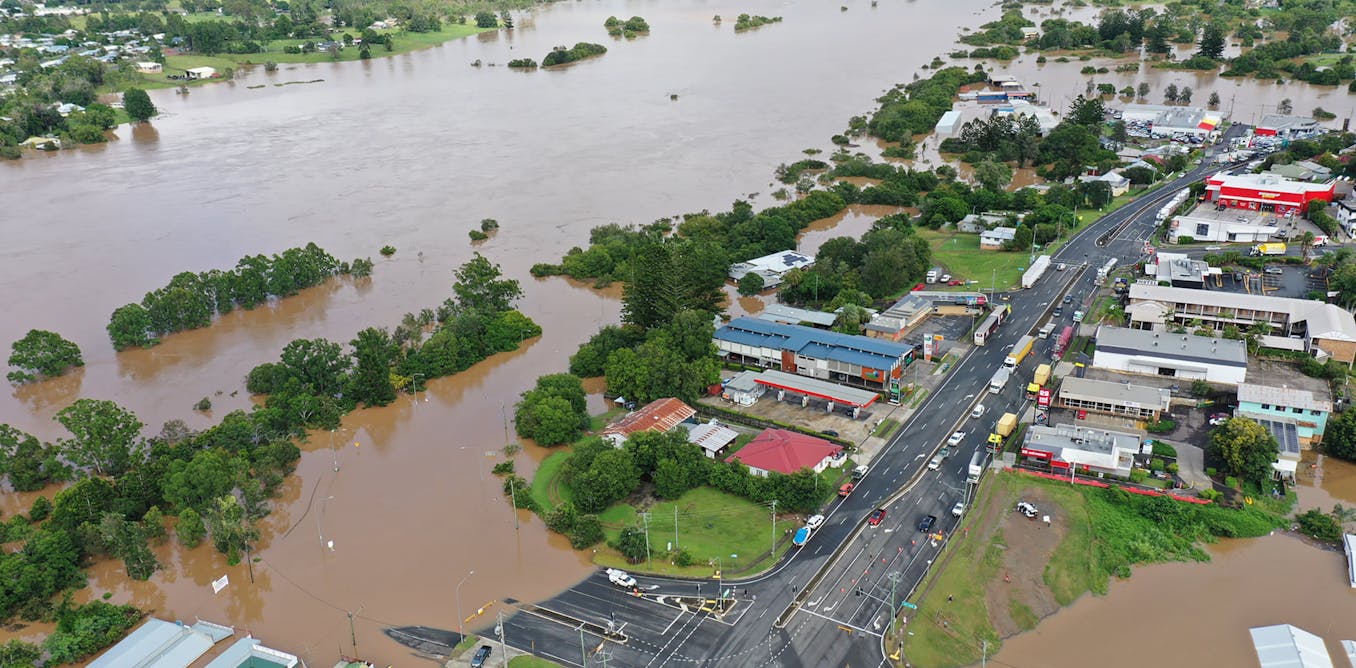
The likelihood of East Coast flooding and its costs
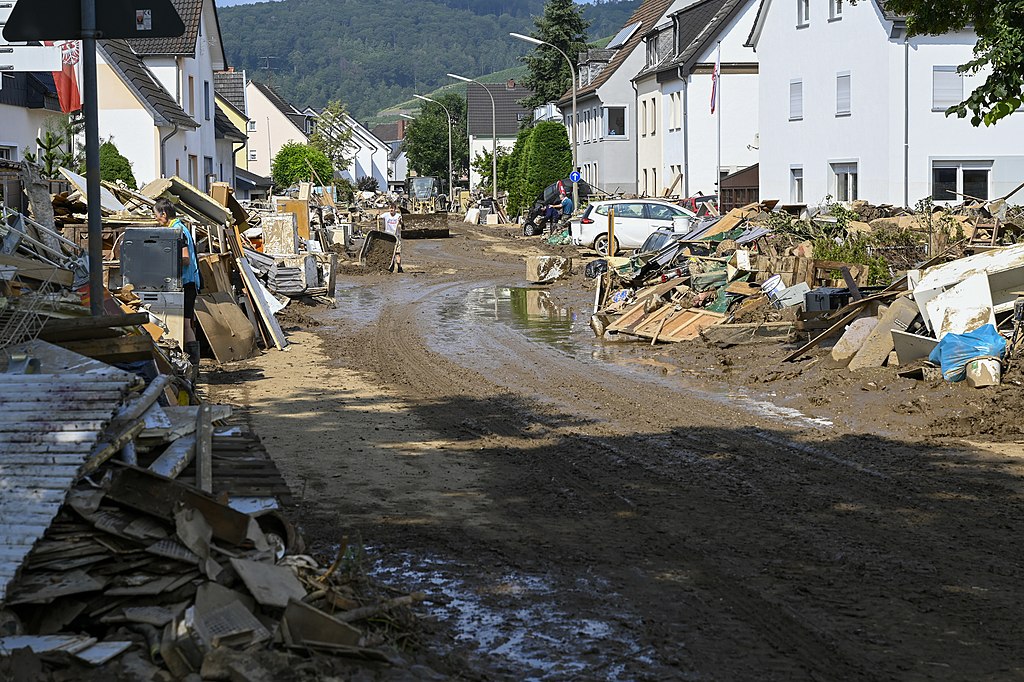
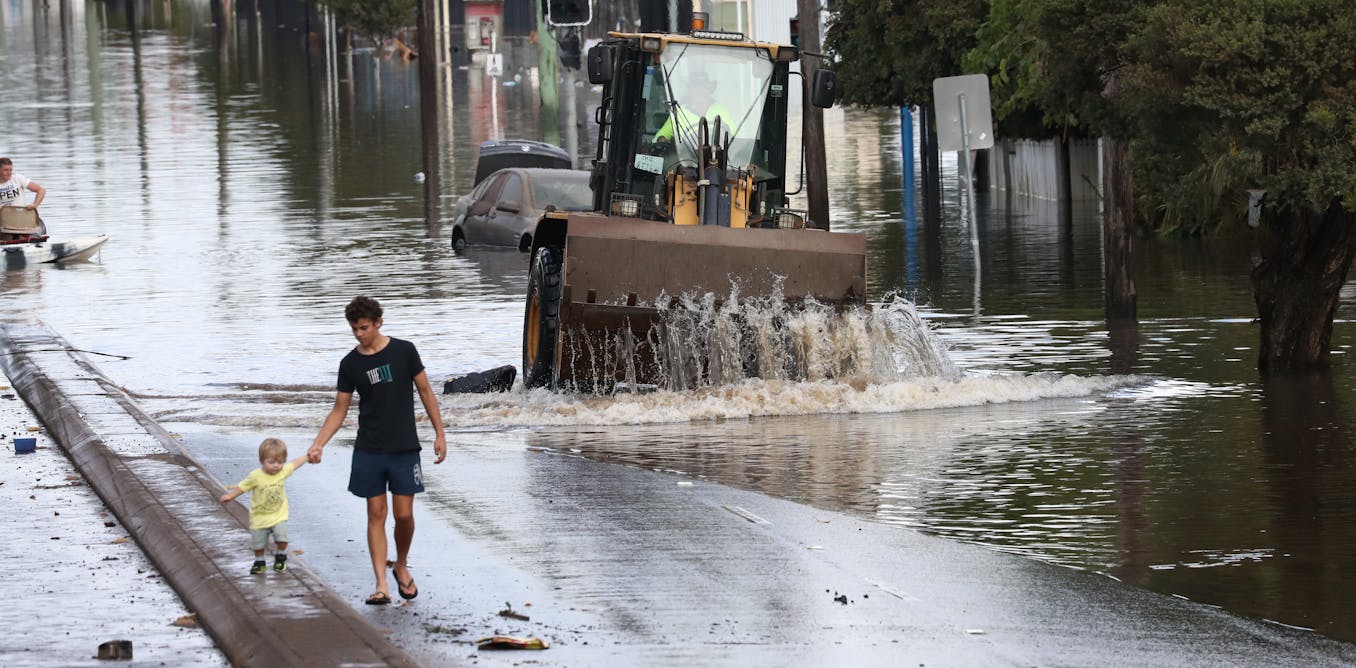
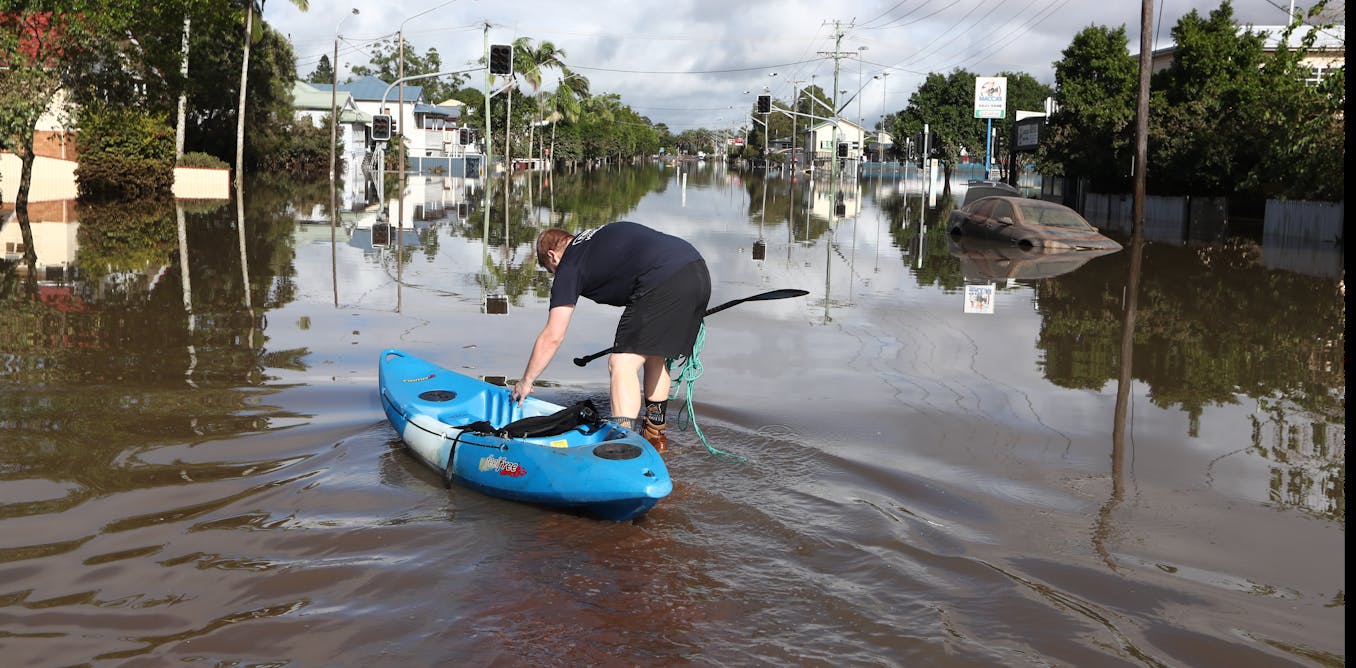
Underinsurance is more common than many realise. And if you live in an area where most people don’t have enough home and/or contents insurance, the financial and social catastrophe that follows a disaster can be community-wide. Even if you’re well covered, your neighbourhood may struggle long after the dust has settled, as houses lie derelict, people struggle to bounce back and social cohesion frays….
AAP /Jason O’Brien in The Conversation
by A. King, et al., 02/03/2022 in The Conversation
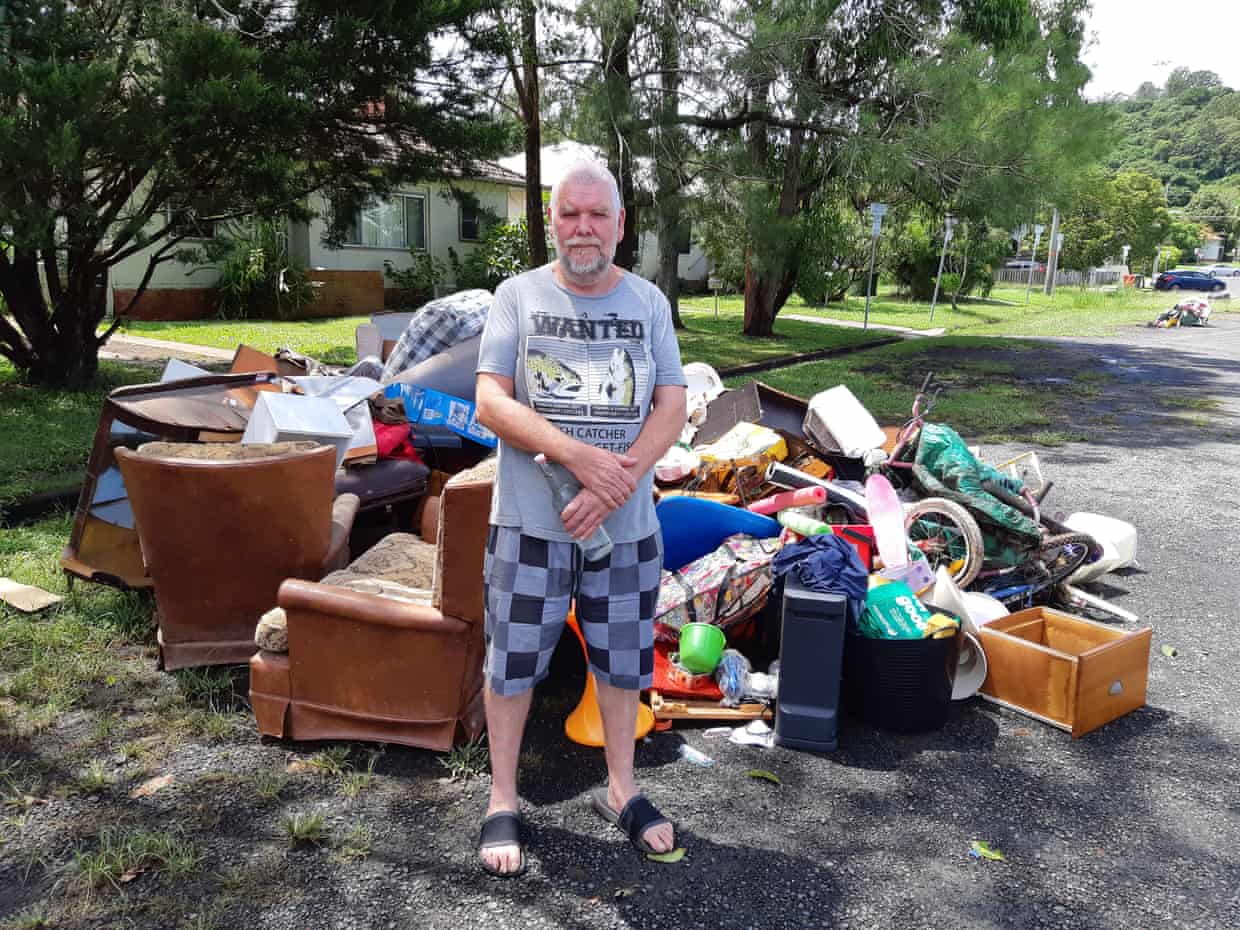
…Even though his house has never before had water through it, he couldn’t get flood insurance, explaining “no one will do it, no one would give it to me”.
“Hardened by a history of floods, residents are ‘getting on’ with the clean-up while waiting for politicians to address climate change” Guardian
In Australia, the political context and implications are also crystal clear. For years our LNP COALition Government has been owned and controlled by mindlessly greedy fossil fuel special interests. Both work to deny the science that shows us the world is warming at an accelerating rate from the continued burning of fossil carbon and to fill the thought space with endlessly distracting humbug and blather. The COALition’s priorities are clear in their lack of interest in using any of their Emergency Response Funds for mitigation or recovery. Burning coal clearly comes first!
As I have noted many times previously in my Climate Sentinel posts, even a child can still draw reasonable conclusions from the kinds of facts that the IPCC has exhaustively documented. Too bad for us all that the COALition are blinded to the reality of what they are doing.
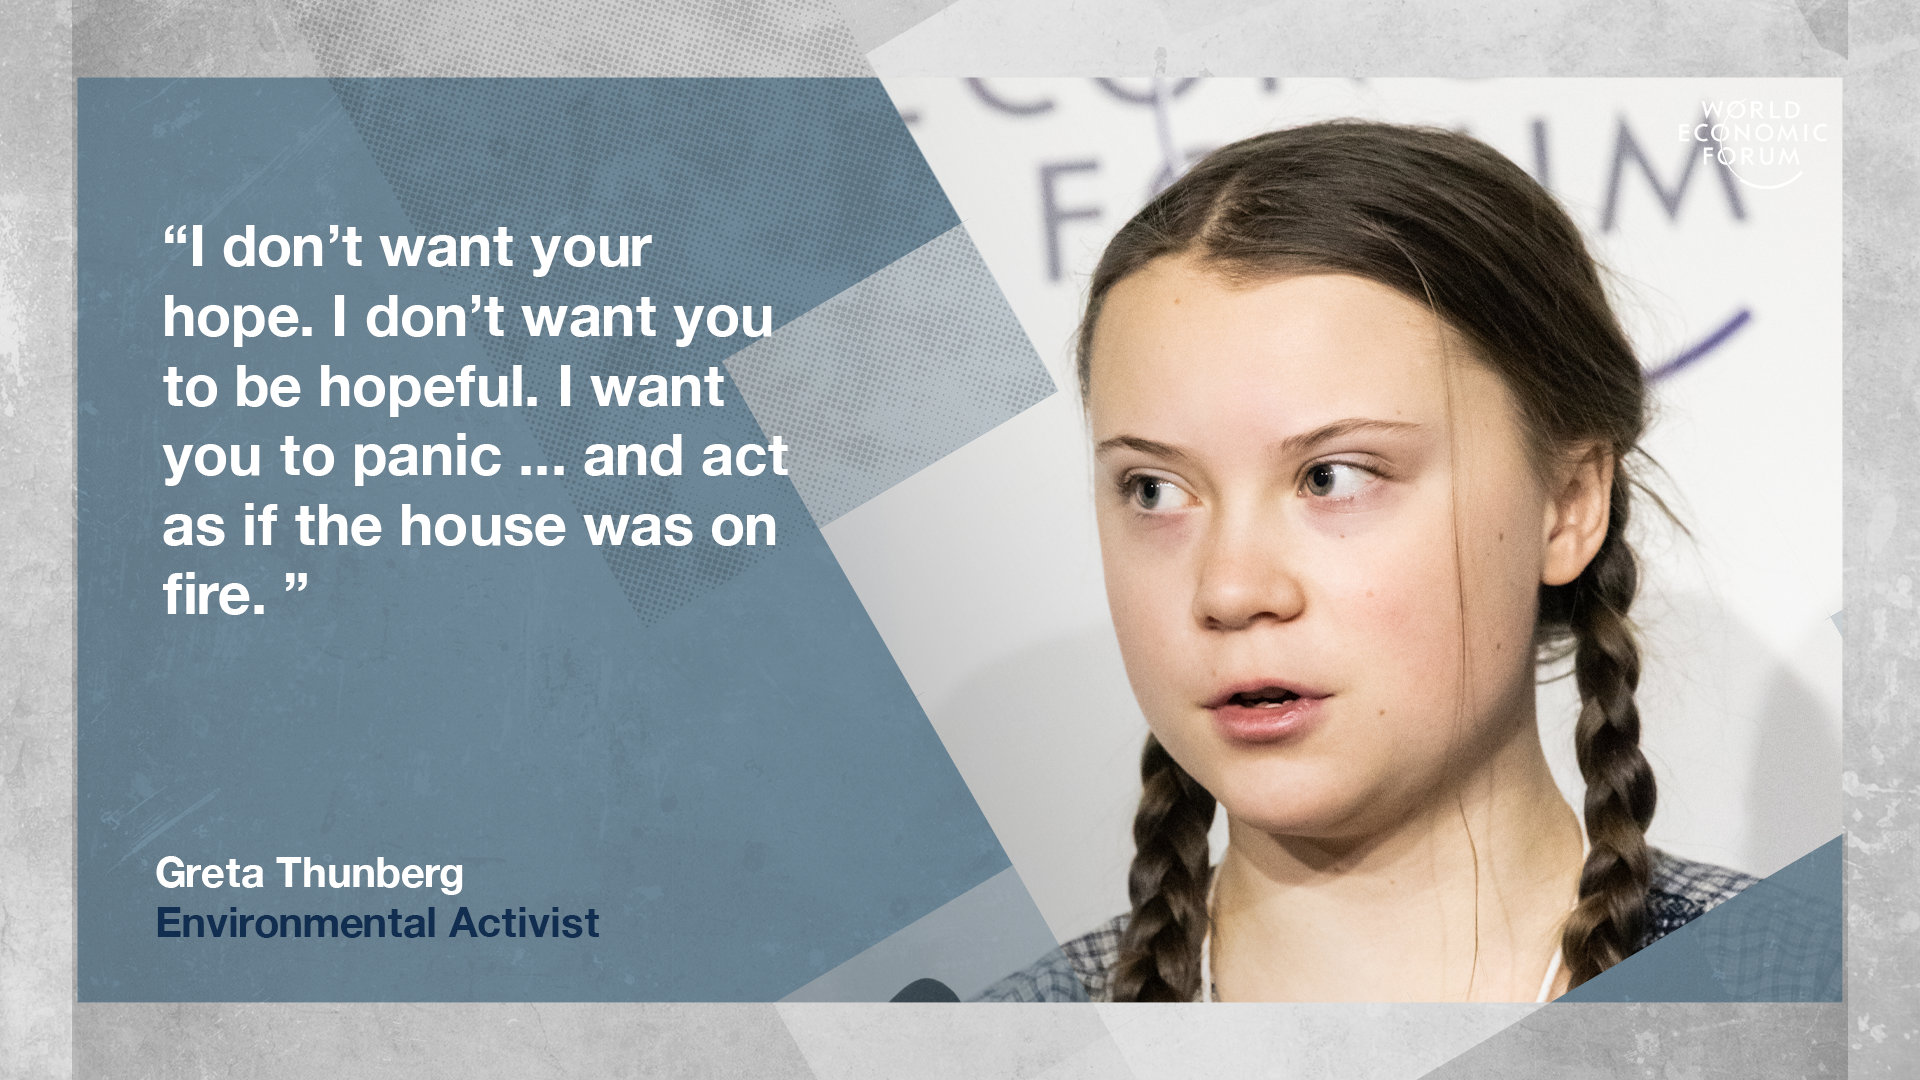
Listen to Greta’s speech live at the World Economic forum in Davos 2019. Except for her reliance on the IPCC’s overoptimistic idea that there is a ‘safe’ emissions budget, everything else Greta says is spot on: even she, as a child, can understand the alternatives and what has to happen.
In other words, wake up! smell the smoke! see the grimly frightful reality, and fight the fire that is burning up our only planet so we can give our offspring a hopeful future. This is the only issue that matters. Even the IPCC’s hyperconservative Report that looks at climate change’s global and regional impacts on ecosystems, biodiversity, and human communities makes it clear we are headed for climate catastrophe if we don’t stop the warming process.
We’ll be having a Federal Election in a couple of months. Now is our chance to rid ourselves of the dead hands of this puppet government and replace the puppets with sensible people who have committed themselves to prioritizing action on the climate emergency on the top of their agendas if elected to Parliament. Our Traffic Light Voting System can help you use our preferential voting system to its best advantage towards meeting this goal.
Help us work towards insuring our kids have a future life.
Views expressed in this post are those of its author(s), not necessarily all Vote Climate One members.


