More on our warming World Ocean’s revenge…

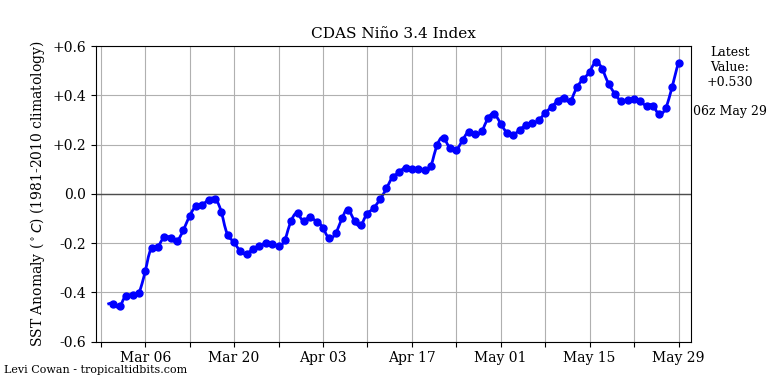
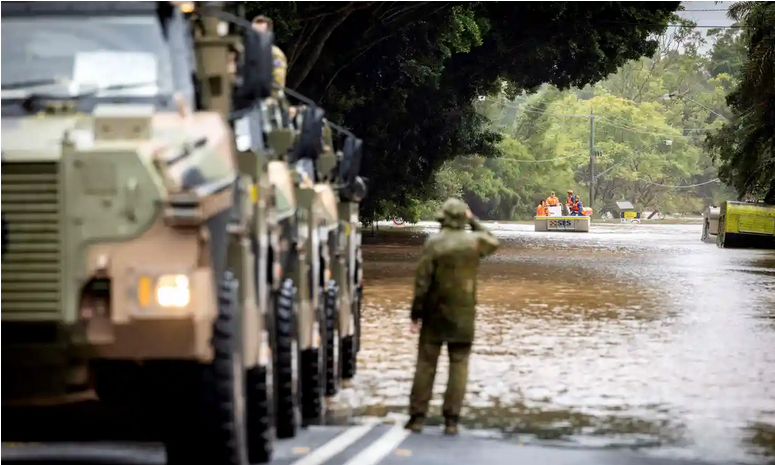
Following on from my May 22 post, the Australian Bureau of Meteorology is raising warning flags that the impending El Niño will be the worst yet.

There is actually a lot more on the front burner than El Niño. There are signs we may have just crossed a catastrophic ocean tipping point over the last three and a half months. The following thread of tweets and news items summarizes a very scary thread of observational data.

We may have broken Earth’s Thermohaline Circulation.

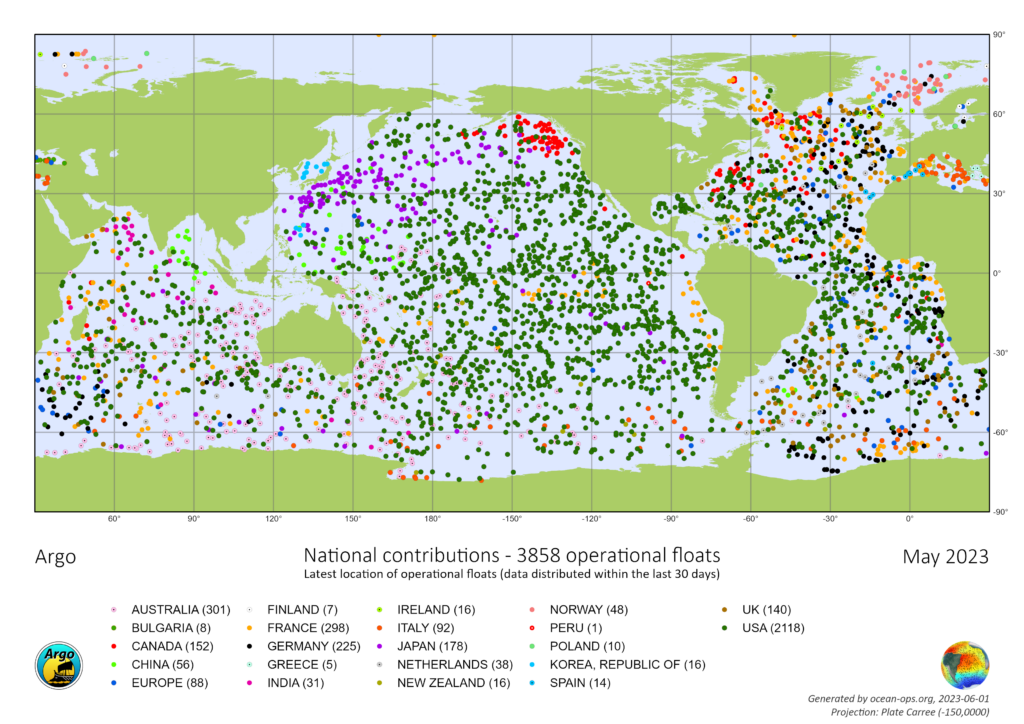
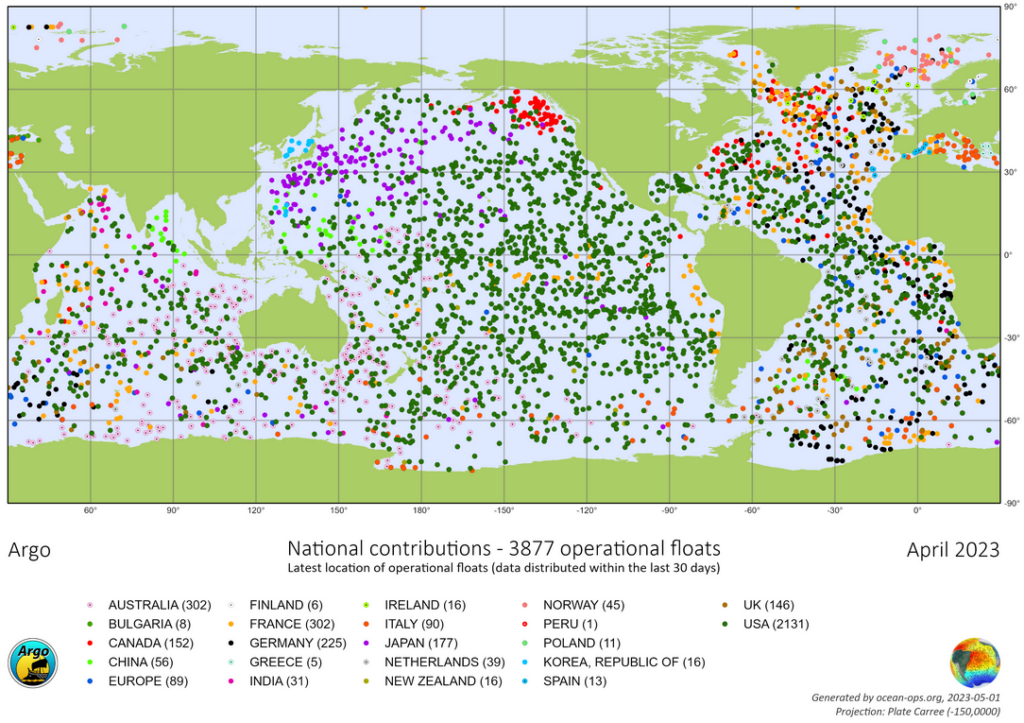
The data based on millions of satellite observations and hundreds of thousands of Argo Float profiles of ocean temperature, salinity and density suggests that the driver of major ocean currents distributing excess heat around the world has stopped working because it is choked with relatively hot and relatively fresh water.

In 2020 Argo collected 12,000 data profiles each month (400 a day) or around 436,500 profiles a year. Each profile provides for each increment of depth a a record of the variation in ocean temperatures, salinity, and pressure from 2,000 m deep to the surface, together with the precise global positioning coordinates where the probe surfaced.

In the past water flowing into the polar regions was quite salty because a lot of moisture evaporated from the surface in tropical and sub-tropical regions, leaving the salt behind to make the water more dense. However, because the water was hot the density was somewhat lowered due to thermal expansion it stayed on the surface because it floated over the surface of cooler but fresher water. As the salty water flowed into polar regions it cooled enough that even though it was being diluted by precipitation and runoff from melting snow and ice on the land, the cooling and increasingly diluted water become dense enough sink under the warm salty waters drawn towards the poles by the sinking polar waters. This circulation also carried oxygen into the depths and nutrients from the depths towards the surface in areas where deep water wells up to replace the surface water flowing towards the poles in tropical and temperate areas.

Wikipedia: Thermohaline circulation (THC) is a part of the large-scale ocean circulation that is driven by global density gradients created by surface heat and freshwater fluxes.

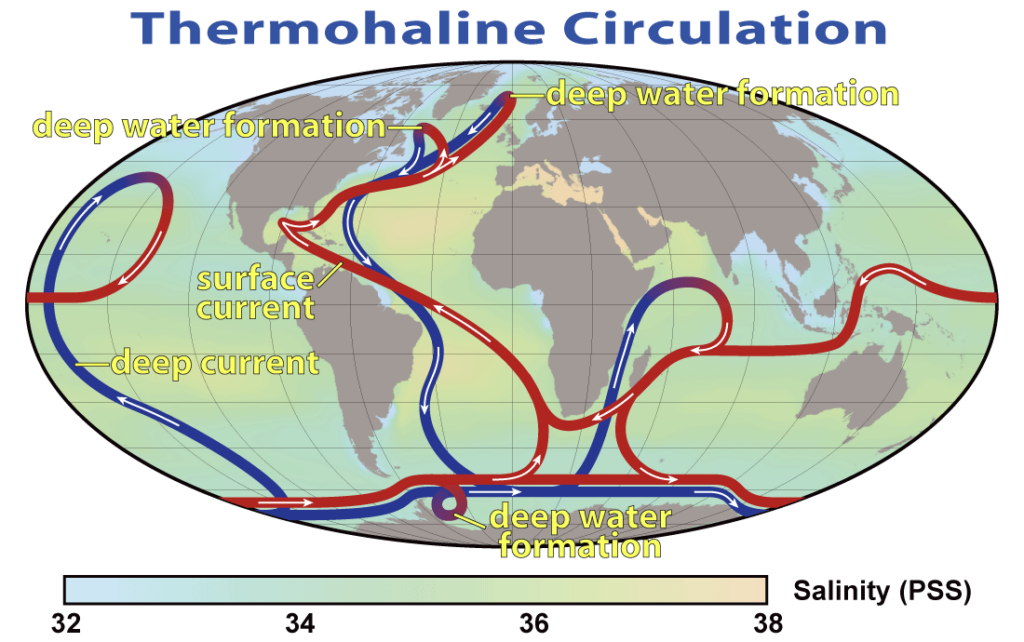
However, as global average temperatures rise and more heat is trapped in the ocean evaporation everywhere puts more moisture into the air that falls as rain in tropical and subtropical areas, diluting the warmer ocean surface waters. In polar and sub-polar areas the increased moisture greatly increasing the runoff from the land from rain and melting snow and ice, that further dilutes the increasingly diluted ocean surface water flowing into polar regions from tropical and subtropical areas.

The result is that the thermohaline conveyors driving the major ocean currents are probably being choked and possibly being completely stopped by masses of water that are too hot and dilute to sink. Even worse, the warm dilute water washing against the ice sheets and glaciers reaching the ocean melts ice at an increasing rate making the surface waters even fresher.

On 26 May, 2023 we are seeing an all-time low extent of sea ice since the satellite record began in 1979. http://kjpluck.github.io/seaice/

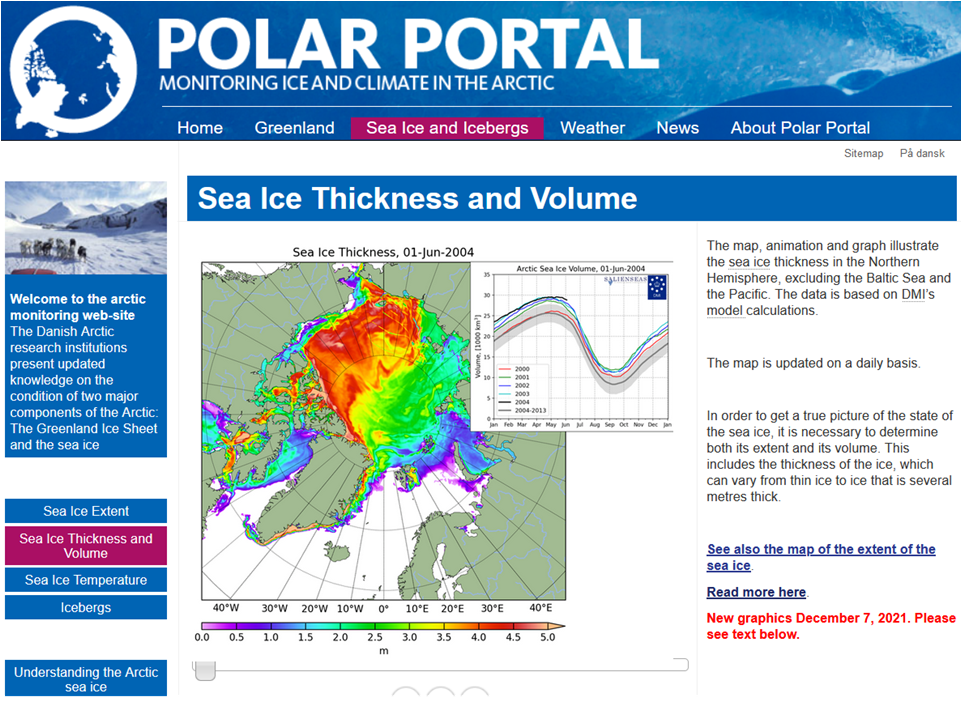
Denmark’s Polar Portal (below) shows the melting of the multi-year Arctic sea ice from its winter peak in June 2004 until now. [Click the picture to load the live site, scroll up to to see the “Sea Ice Thickness and Volume” title. Note the grey slider bar below the map. Click the “Animate Monthly” to load the animation — which will take some time to download the data. You may use the slider to scroll through the series of monthly maps, or you can control buttons below the slider to start and stop the animation or step back or forward one month at a time. The red color represents multi-year ice around 4 meters thick, lavender to blue ice is single year ice less than about 1.5 m thick.]

Note, there is an interesting but deadly physical twist here: As water temperature drops below 4 °C cold/freezing fresh water floats on top of warmer relatively salty water, and freezes-over in the winter at higher temperatures than saltier water. Paradoxically, floating ice and snow accumulating on the surface actually insulates the lower layer of warm salty water from further cooling, where the winter surface temperature may be 20-50 °C below freezing. However, the fronts of large glaciers flowing into the ocean may be grounded hundreds of meters below sea level or floating on even deeper warm water(!). This means they will still be melting rapidly from the bottom up even in the dead of winter when fresh water is freezing. The ice melt dilutes the polar oceans even more – so say nothing of raising sea levels that will, in turn, lead to the floating of glacier fronts, exposing even more areas to melting.

What is happening as I write this warning?

If you follow the threads and commentary attached to these tweets here, the links show what was happening a week ago.

The following Guardian articles highlight the existential risk we are facing.

Melting ice around Antarctica could cause a 40% slowdown of a global deep ocean current by 2050 if current greenhouse gas emissions continue, according to researchers. Photograph: Anadolu Agency/Getty Images / from the article

Graham Redfearn – 30/03/2023 in The Guardian

Melting Antarctic ice predicted to cause rapid slowdown of deep ocean current by 2050

New research by Australian scientists suggests 40% slowdown in just three decades could alter world’s climate for centuries.

[Actually, the data presented here suggests that as of the last three months or so this stoppage has already begun!]

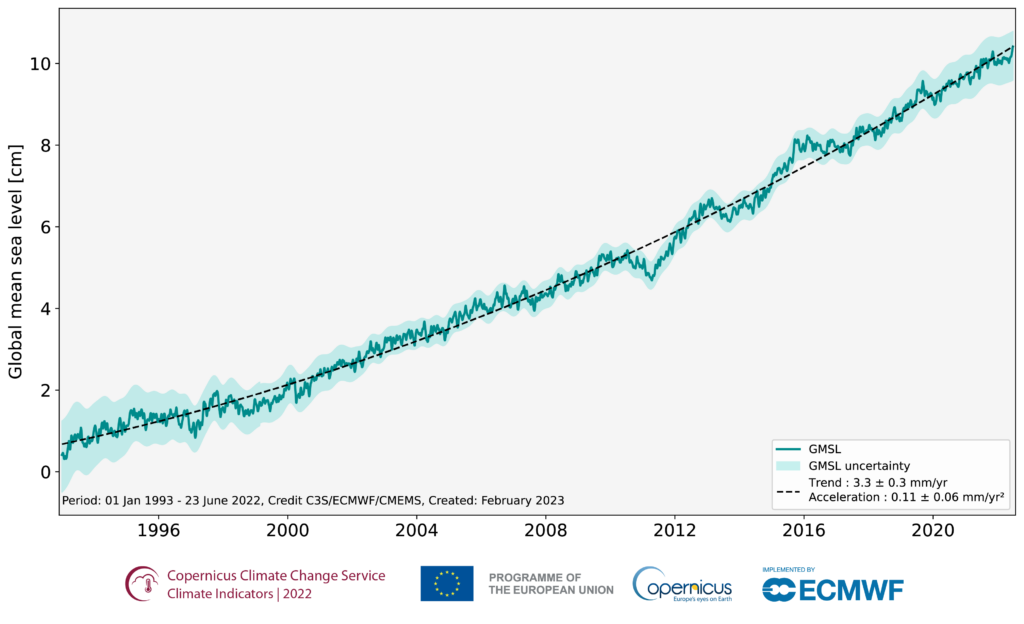
Melting ice around Antarctica will cause a rapid slowdown of a major global deep ocean current by 2050 that could alter the world’s climate for centuries and accelerate sea level rise, according to scientists behind new research.

The research suggests if greenhouse gas emissions continue at today’s levels, the current in the deepest parts of the ocean could slow down by 40% in only three decades.

This, the scientists said, could generate a cascade of impacts that could push up sea levels, alter weather patterns and starve marine life of a vital source of nutrients.

Read the complete article….
Antarctica’s Larsen B ice shelf. There has never been less ice around the continent than there was last week. Photograph: staphy/Getty Images/iStockphoto / from the article

Graham Redfearn – 05/03/2023 in The Guardian

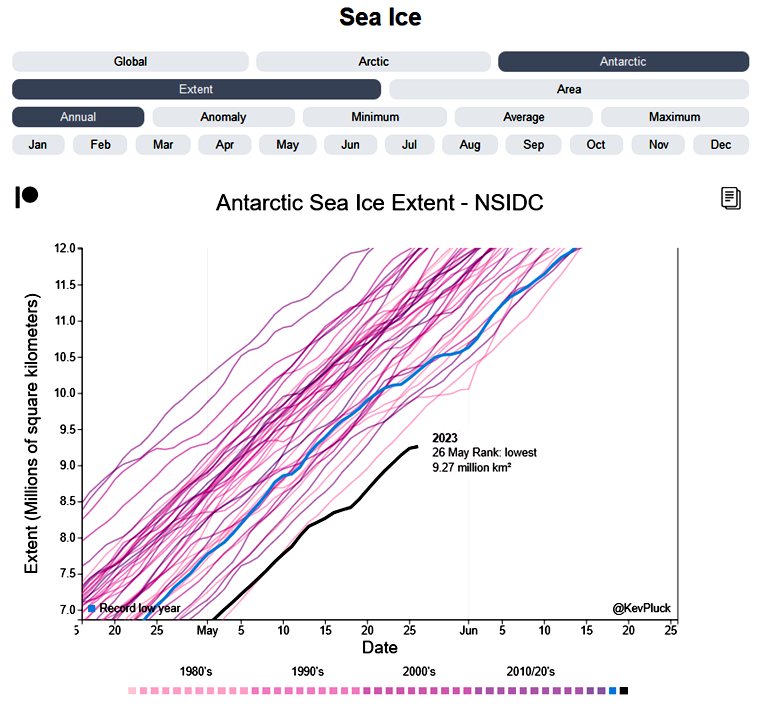
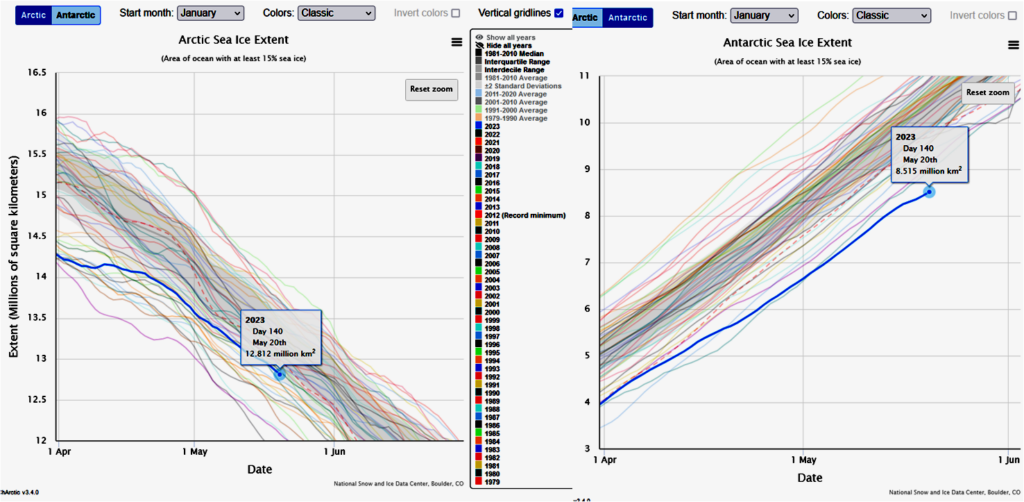
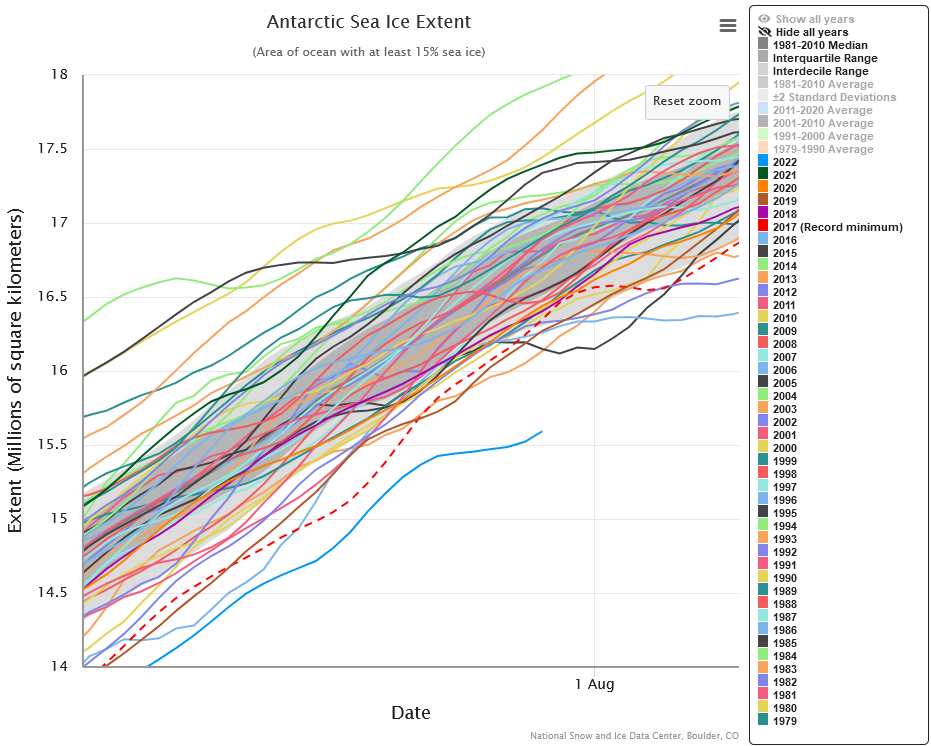
‘Everyone should be concerned’: Antarctic sea ice reaches lowest levels ever recorded

With the continent holding enough ice to raise sea levels by many metres if it was to melt, polar scientists are scrambling for answers.

For 44 years, satellites have helped scientists track how much ice is floating on the ocean around Antarctica’s 18,000km coastline.

The continent’s fringing waters witness a massive shift each year, with sea ice peaking at about 18m sq km each September before dropping to just above 2m sq km by February.

But across those four decades of satellite observations, there has never been less ice around the continent than there was last week.

“We are seeing less ice everywhere. It’s a circumpolar event.”

In the southern hemisphere summer of 2022, the amount of sea ice dropped to 1.92m sq km on 25 February – an all-time low based on satellite observations that started in 1979.

Read the complete article….
Melting ice in Antarctica has affected a key global ocean current, research suggests. Photograph: Anadolu Agency/Getty Images / from the article

Donna Lu – 26/05/2023 in The Guardian

Slowing ocean current caused by melting Antarctic ice could have drastic climate impact, study says

The Southern Ocean overturning circulation has ebbed 30% since the 90s, CSIRO scientist claims, leading to higher sea levels and changing weather.

A major global deep ocean current has slowed down by approximately 30% since the 1990s as a result of melting Antarctic ice, which could have critical consequences for Earth’s climate patterns and sea levels, new research suggests.

Known as the Southern Ocean overturning circulation, the global circulation system plays a key role in influencing the Earth’s climate, including rainfall and warming patterns. It also determines how much heat and carbon dioxide the oceans store.

Scientists warn that its slowdown could have drastic impacts, including increasing sea levels, altering weather patterns and depriving marine ecosystems of vital nutrients.

Read the complete article….

Markus Noll – 23/05/2023 in EarthArXiv

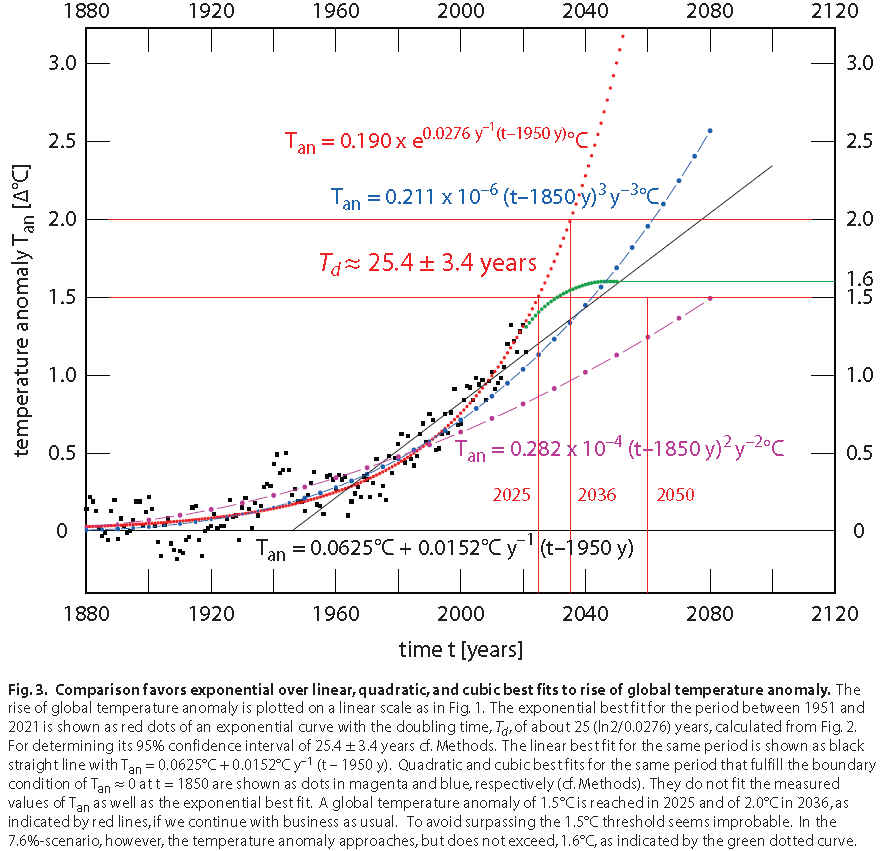
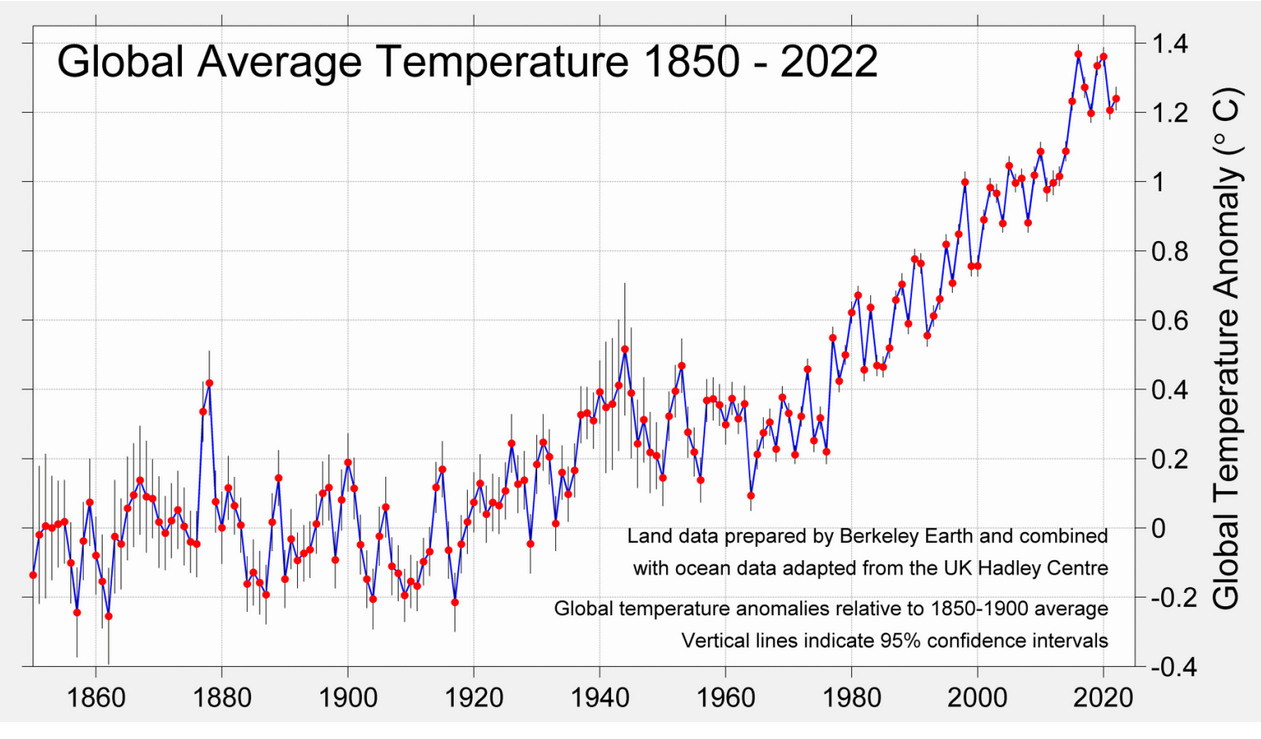
Exponential life-threatening rise of the global temperature

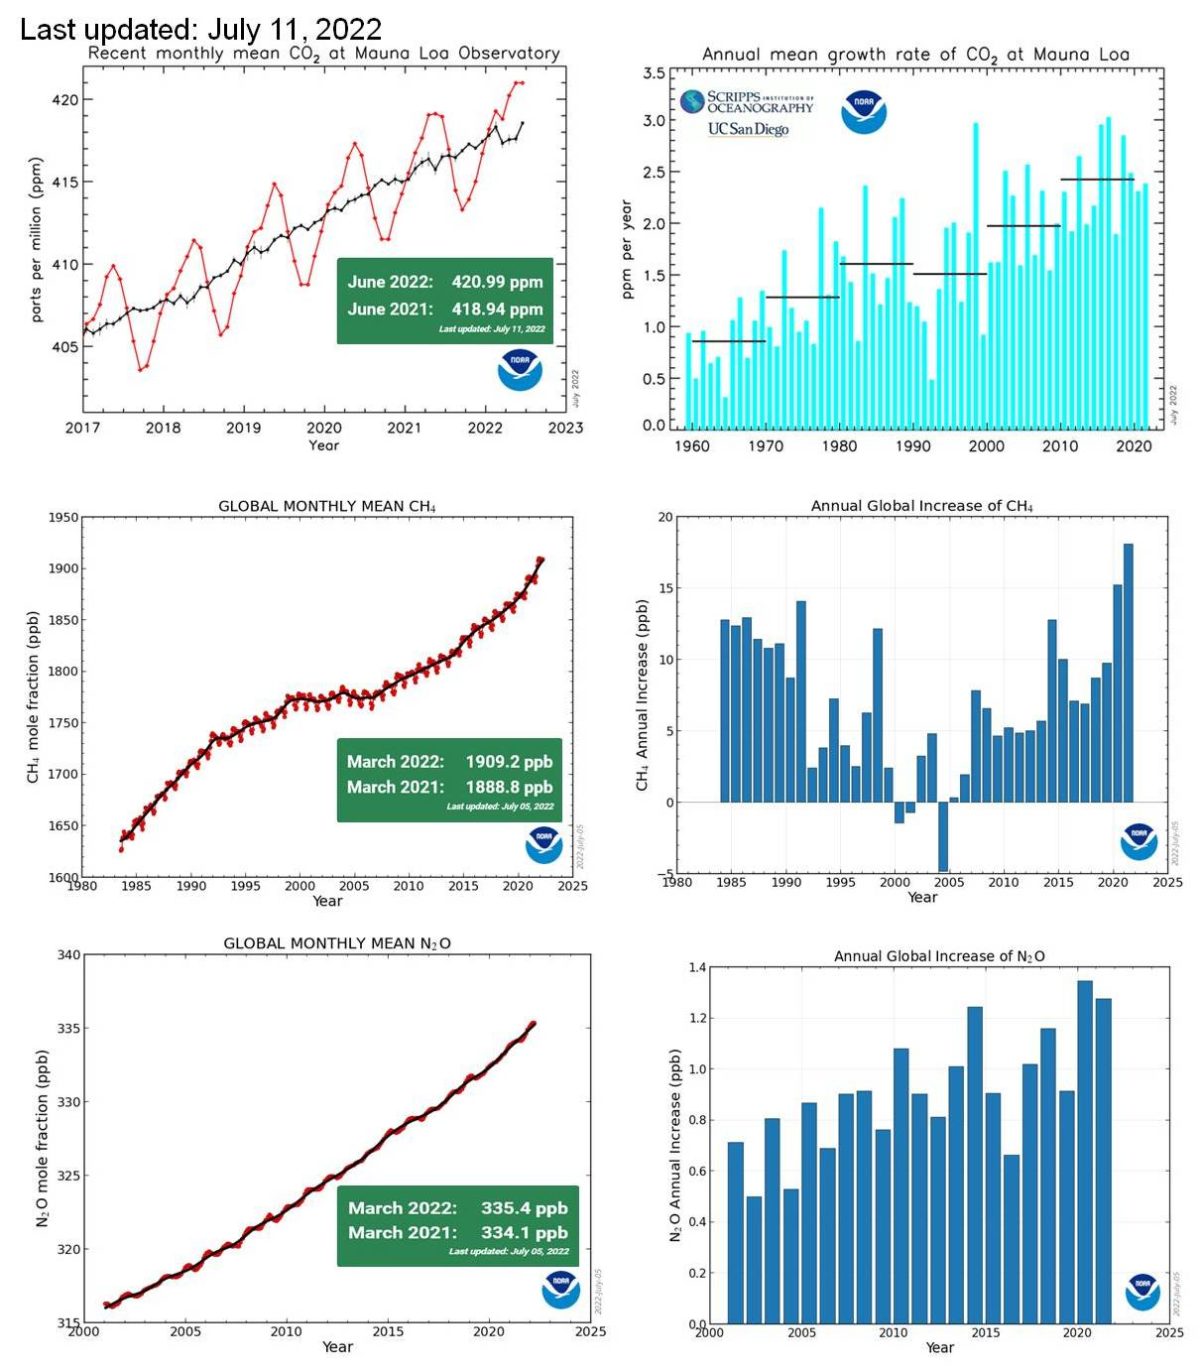
Global temperatures are rising. This paper demonstrates for the first time that the global temperature increase has not been linear but is exponential with a doubling time of about 25 years. Both the amount of carbon dioxide produced by the combustion of fossil fuels and the amount of carbon dioxide in the atmosphere have also risen exponentially, with a similar doubling time. The exponential trajectories of rising global temperature, carbon dioxide emission, and atmospheric carbon dioxide concentration support the idea that all three are entirely man-made. This analysis shows that during the past 70 years, the increasing use of fossil fuels results more from human activities than population growth, and that reducing the use of fossil fuels by 7.6% each year, the “7.6%-scenario”, can prevent annual global temperatures from surpassing pre-industrial temperatures by 1.6°C, a critical threshold to sustaining life on Earth.

Read the complete article….

Driven by exponentially increasing global temperatures, this process is also very likely to be accelerating at an exponential rate (doubling time of about 25 years).

Or worse!

What I think we are seeing in this data is that we have crossed a chaotically discontinuous ‘tipping point’. Prior to March 12, the thermohaline circulation was slowing as surface waters were gradually becoming warmer and more dilute, and thus less dense, decreasing the sinking rate of the cooling warm salty water that was driving the circulation. Around March 12, the surface waters actually became less dense than the deeper waters and thus stopped sinking at all to begin piling up in the polar regions where they would increase the rate of ice melting to be diluted still further.

With no sinking water to keep the the thermohaline circulation working, it has effectively been jammed and we are now in a totally new climate regime that is likely to get a lot hotter, a lot faster.

If this isn’t a climate emergency, I don’t know what is.

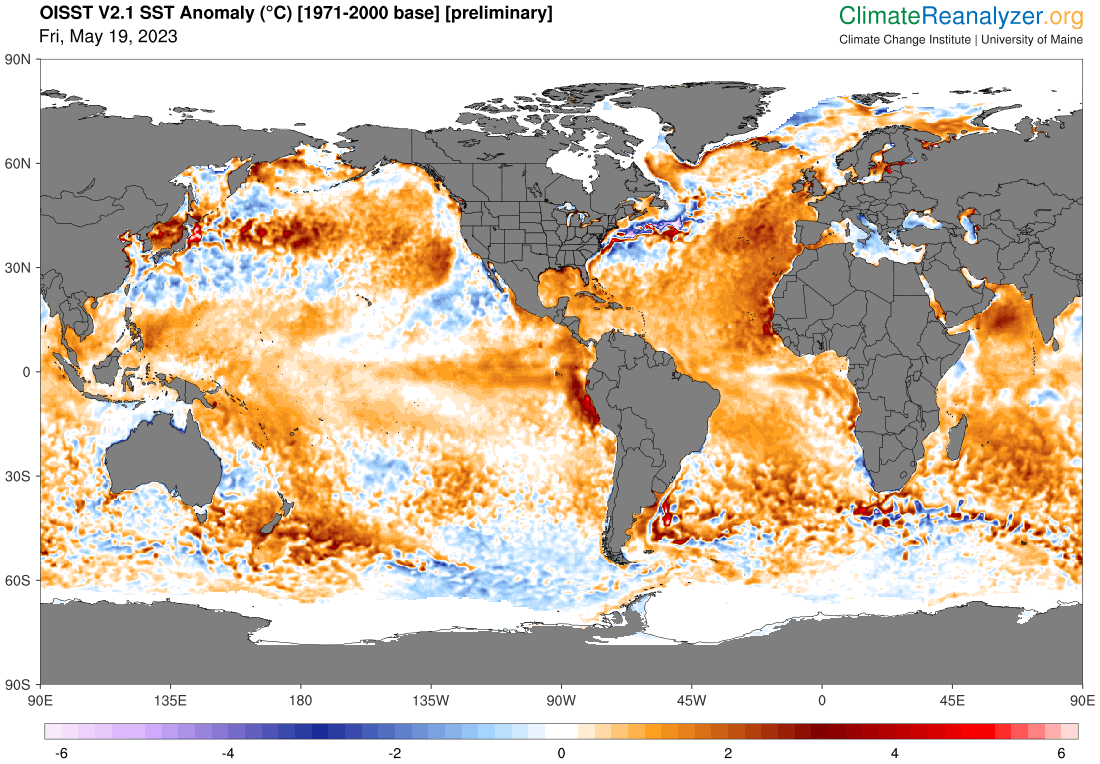
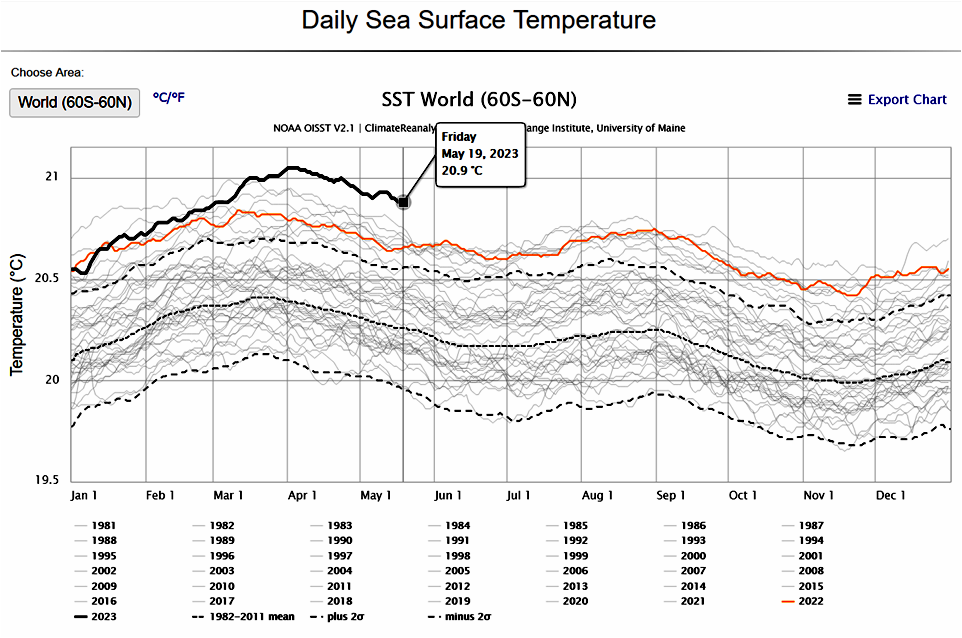
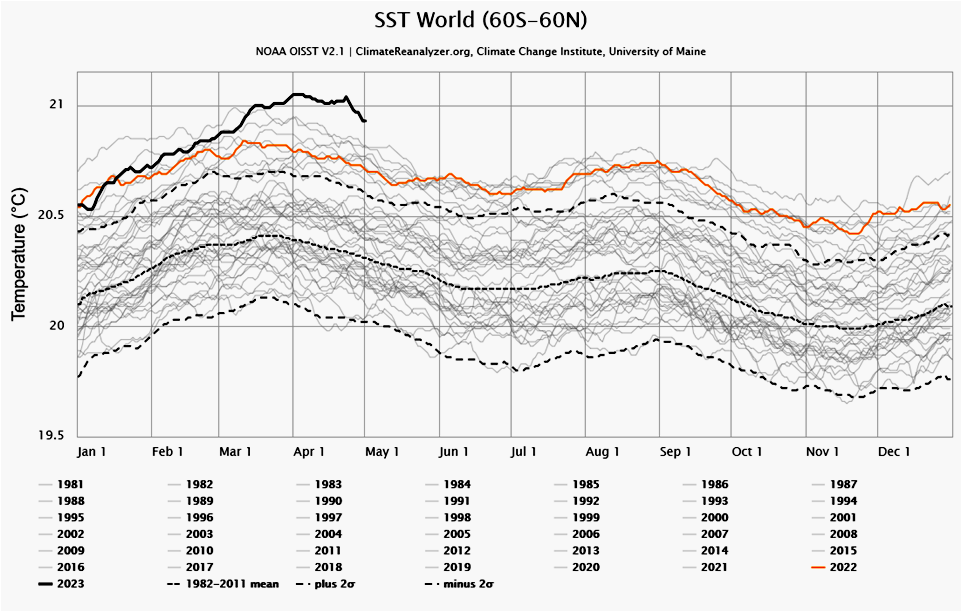
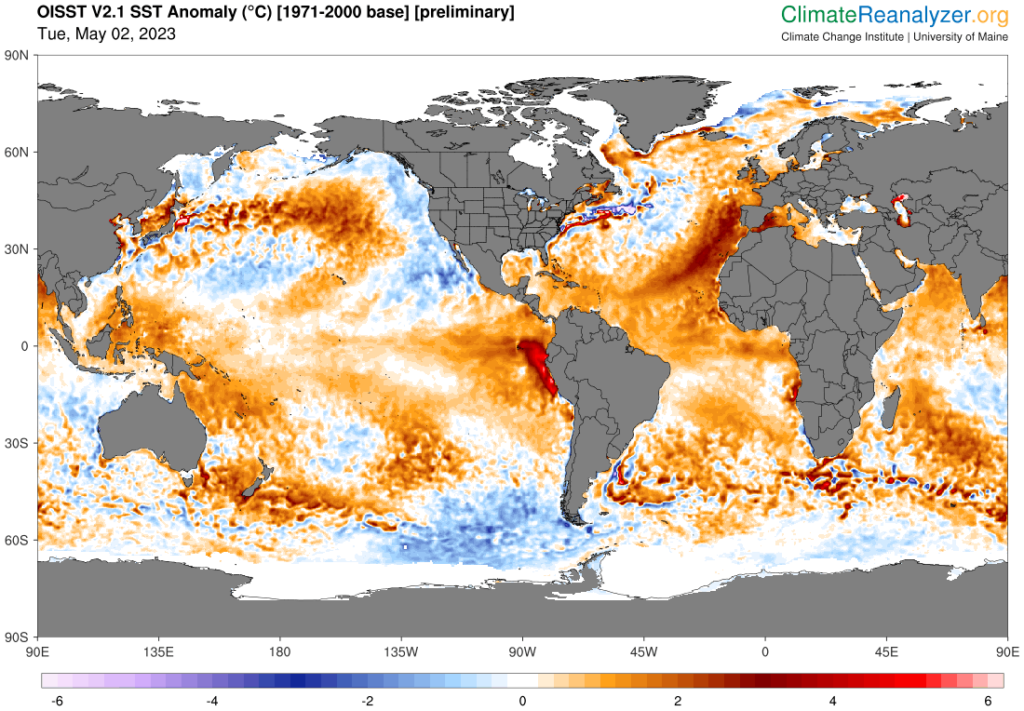
As at May 30, the heat anomaly is still growing. The average surface temperature of the World Ocean is a good 0.2 °C hotter than it has been on this day since the satellite records began in 1979; and it is only 0.1 °C cooler than the hottest temperature ever recorded in this era for any time of the year.
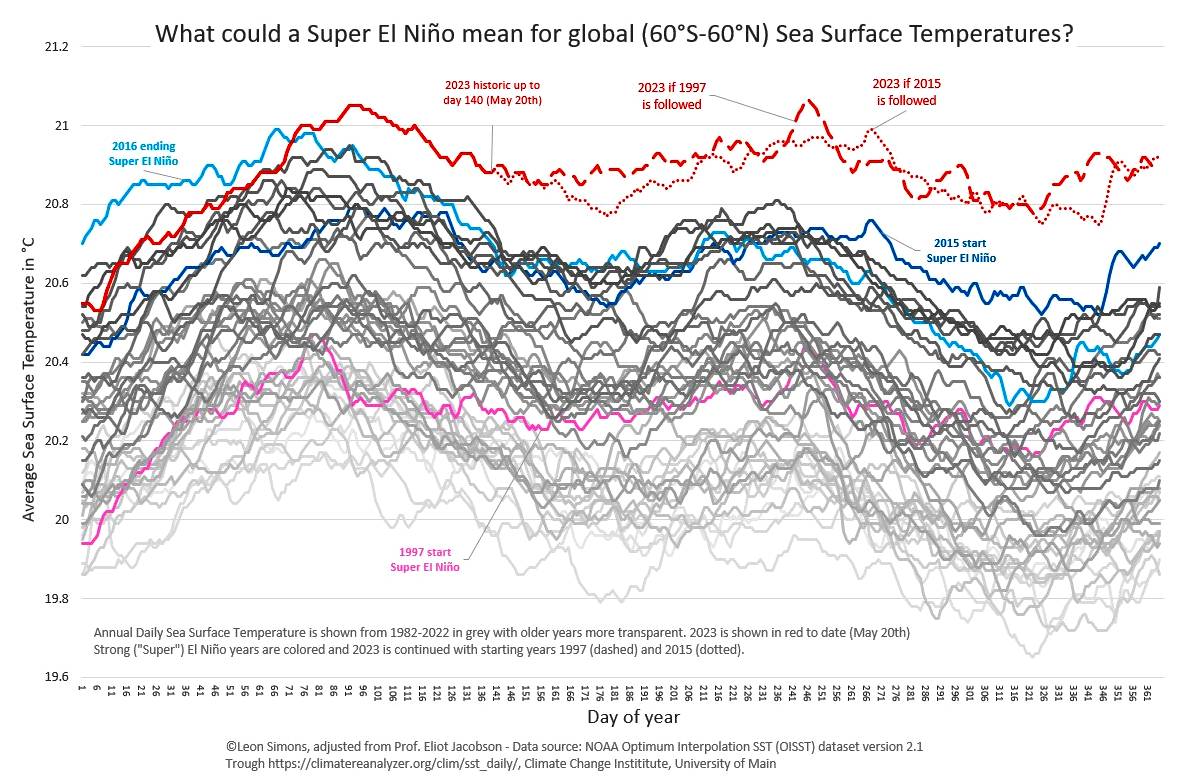
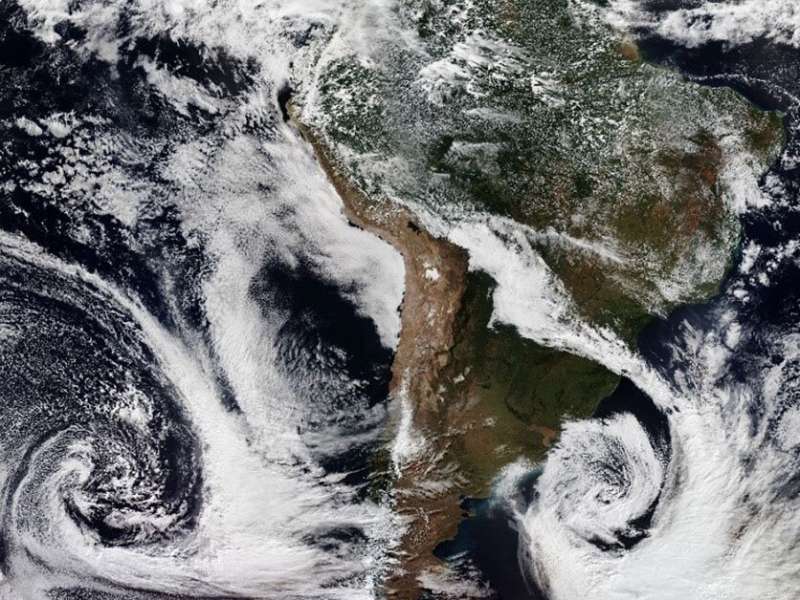
Featured Image

Figure from https://twitter.com/LeonSimons8/status/1663936433801887744/photo/1. “Will a Super El Niño materialize like in 1997 and 2015? What will that mean for global Sea Surface Temperatures? And for global and regional weather extremes?” This seems to be answered by https://twitter.com/LeonSimons8/status/1663195220207362048/photo/1

Views expressed in this post are those of its author(s), not necessarily all Vote Climate One members.

A warming ocean will take its revenge on us

Around 90% of the extra heat trapped by the greenhouse layer warms our Ocean to slow rising temperatures. We’ll pay the price.

The climate scientist, Bill McKibben reminded me of this fact in his regular newsletter, The Crucial Years, in his 18 May post, Maybe we should have called this planet ‘Ocean’. His post on ocean warming begins with an earlier version of the graphic here from ClimateReanalizer. These are updated daily, so the record here is only a day or two behind the current reality:

The page provides time series and map visualizations of daily mean Sea Surface Temperature (SST) from the NOAA Optimum Interpolation SST (OISST) dataset version 2.1. OISST is a 0.25°x0.25° gridded dataset that estimates temperatures based on a blend of satellite, ship, and buoy observations. The OISST data product includes SST anomalies based on 1971–2000 climatology from NOAA. The datset spans 1 January 1982 to present with a 1 to 2-day lag from the current day. OISST files are preliminary for about two weeks until a finalized product file is posted by NOAA. This status is identified on the maps with “[preliminary]” showing in the title, and applies to the time series as well. The time series chart displays area-weighted means of the selected domain. For example, if World 60S-60N is selected, then the SST values shown are area-wieghted means for all ocean gridcells between 60°S and 60°N across all longitudes.

Something very troubling is happening on and under the 70 percent of the planet’s surface covered by salt water. We pay far more attention to the air temperature, because we can feel it (and there’s lots to pay attention to, with record temps across Asia, Canada and the Pacific Northwest) but the truly scary numbers from this spring are showing up in the ocean.

If you look at the top chart above , you can see “anomaly” defined. [His chart was for 11 May. Mine, here, is the temperature on 19 May.]That’s the averaged surface temperature of the earth’s oceans, and beginning in mid-March it was suddenly very much hotter than we’ve measured before. In big datasets for big phenomena, change should be small—that’s how statistics work, and that’s why the rest of the graph looks like a plate of spaghetti. That big wide open gap up there between 2023 and the next hottest year (2016) is the kind of thing that freaks scientists out because they’re not quite sure what it means. Except trouble. [My emphasis]

… A little-noticed [but quite important] recent study headed by Katrina von Schuckmann found that “over the past 15 years, the Earth has accumulated almost as much heat as it did in the previous 45 years,” and that 89 percent of that heat has ended up in the seas. That would be terrifying on its own, but coming right now it’s even scarier. That’s because, after six years dipping in and out of La Nina cooling cycles, the earth seems about to enter a strong El Nino phase, with hot water in the Pacific. El Nino heat on top of already record warm oceans will equal—well, havoc, but of exactly what variety can’t be predicted.

Read the complete article….

McKibben’s second graphic (the up to date version is my “Featured Image”) shows a global plot of temperature anomalies (also compared to the same 1971-1980 baseline) for every ¼° – ¼° square of ocean surface. “Area weighting” is applied because ¼° of latitude (the width of the ‘square) becomes much narrower as either pole is approached, reducing the physical surface area encompassed by the lines on the globe.

Earth’s oceans cover around 70% of the globe’s surface. Despite the 2nd or 3rd week of record breaking heat, wildfires and drought in western North America extending from California through the western 2/5ths of North America into the Arctic Ocean and a second belt in northern Eurasia extending from Scandinavia and Finland to western Siberia, the ocean temperatures are relatively even more extreme. And, in fact, the crazy heat in the warming oceans may be the driving force behind the record land temperatures — and may well be triggering what is likely to be the most extreme El Niño event yet in the climate change record.

In any event, this data doesn’t just freak me out. It suggests that the door to Earth’s Hothouse Hell is beginning to open to suck us in.


Is this data reliable enough to support action?

Where the climate record is concerned, From the beginning of the satellite era, our oceanic temperature record is very good indeed, and not just because satellite remote sensing measures virtually every square degree of most of the globe every day, but the satellites’ measurements are calibrated every day against the ‘ground truth’ measurements from many hundreds of Argo floats surfacing each day from their 9-10 days probing the ocean depths. The graphic below shows the physical locations sampled by Argo floats over the previous month. Added to these are more detailed measurements collected by fleets of oceanographic ships and a few special moored buoys that continuously record measurements from the ocean surface to the abyssal ocean bottom.

Supercomputers amalgamate the raw input data and assemble the kinds of human readable outputs that you and I can understand at a glance. Thanks to the exponential growth of measuring technologies and data processing power the accuracy and detail of our scientific understanding of climate and weather extends far beyond anything we could know in past decades.


How is all the additional heat in the warming ocean likely to affect the planet we live on?

Melting ice

As the atmosphere and oceans absorb more solar energy, some of this excess energy will inevitably be absorbed melting ice in the cooler regions of the planet where ice has existed more-or-less in an equilibrium state, e.g., in the form of glaciers, ice sheets, and sea ice. The energy drives the equilibrium states towards more water and less ice.

One very obvious measure of ice melting is the rapidly shrinking area of the Earth’s surface covered by sea ice around the N and S Poles. Since the beginning of the satellite era this has been able to be measured accurately. The Australian Antarctic Program Partnership and the ARC Australian Centre for Excellence in Antarctic Science’s 2023 Science Briefing: On Thin Ice explains what is happening around our local polar ocean

The graphics below show the daily extents of sea ice over both polar oceans since the beginning of the satellite era in 1979 as plotted by the US National Snow and Ice Data Center‘s interactive Charctic application.

Record minimums or maximums are updated annually. Therefore, a newly-set record may not be reflected in the chart until after the annual update.
View additional years by clicking the dates in the legend.
Roll your cursor over the line to see daily sea ice extent values.
Zoom in to any area on the chart by clicking and dragging your mouse.
To see a corresponding daily sea ice concentration image, click on a line in the chart. Sea ice extent is derived from sea ice concentration. Images are not available for the average or standard deviation.
When reusing Charctic images or data, please credit “National Snow and Ice Data Center.”
Currently, some functions do not work in Internet Explorer. We recommend using a different browser.
For more information about the data, see About Charctic data.
If you have questions or problems, please contact NSIDC User Services at [email protected].

What is currently happening in the Antarctic Ocean is also freakish and worrisome!

Rising sea levels

Of course, all the melt water released by melting ice has to go somewhere — i.e., adding to the volume of the World Ocean. As this wasn’t enough, as water warms it also expands to raise the sea levels even more. The graph below from the EU’s Copernicus Climate Change Service, plots the rising tide of the swelling ocean since 1993 through June 2022. The US National Oceanic and Atmospheric Administration’s Climate.Gov site’s Climate Change: Global Sea Level also plots the rise, and considers its implications in more detail.

The Conversation’s May 17 article, Global warming to bring record hot year by 2028 – probably our first above 1.5°C limit, looks at these facts and warns us that the time to act is NOW! CSIRO’s State of the Climate/Oceans covers most of the trends I have discussed here and more…

Daily change in global mean sea level, as measured by satellite altimetry, from January 1993 to June 2022 (solid line), the associated uncertainty at 90% confidence level (shading) and the trend (dashed line). The data have been adjusted for glacial isostatic adjustment and have been corrected for the TOPEX-A instrumental drift during 1993–1998. Data source: CMEMS Ocean Monitoring Indicator based on the C3S sea level product. Credit: C3S/ECMWF/CMEMS. 
https://climate.copernicus.eu/climate-indicators/sea-level

Help! We’re sliding down the slope to Earth’s Hothouse Hell! Sound the sirens and mobilize for WW III against global warming and the existential climate crisis!


As is usual for the UN’s climate pronouncements driven by the UN’s IPCC findings that absolutely establish the dangers we face from global warming/heating, even this klaxon warning understates and downplays the magnitude of the crisis we face.

If we fail to mobilize genuinely effective action over the next decade to stop and reverse the warming crisis, our families will have their lives shortened due to increasing climate catastrophes and we will have condemned our entire species to death in Earth’s 6th global mass extinction within a century or two. We don’t have time to take more election cycles to elect new governments. Our existing governments must wake up, smell the smoke, and immediately begin acting to put out the fire before it destroys us all. If you are in government, read Guterres’ message in mind. YOU must act now!

Press Release

SG/SM/21799

16 May 2023

Planet Hurtling towards Hell of Global Heating, Secretary-General Warns Austrian World Summit, Urging Immediate Emissions Cuts, Fair Climate Funding

Following is the text of UN Secretary-General António Guterres’ video message to the seventh Austrian World Summit, in Vienna today:

I thank the Austrian Government and Arnold Schwarzenegger for this opportunity.  The climate crisis can feel overwhelming.  Disasters and dangers are already mounting, with the poor and marginalized suffering the most, as we hurtle towards the hell of 2.8°C of global heating by the end of the century.

But, amidst all this, I urge you to remember one vital fact:  limiting the rise in global temperature to 1.5°C remains possible.  That is the clear message from the Intergovernmental Panel on Climate Change (IPCC).  But, it requires a quantum leap in climate action around the world.

To achieve this, I have proposed an Acceleration Agenda.  This urges all Governments to hit fast-forward on their net-zero deadlines, in line with the principle of common but differentiated responsibilities and respective capabilities in the light of national circumstances.  It asks leaders of developed countries to commit to reaching net zero as close as possible to 2040 — as Austria has done.  And leaders in emerging economies to do so as close as possible to 2050.

The Acceleration Agenda also urges all countries to step up their climate action, now.  The road map is clear:  phasing out of coal by 2030 in OECD [Organisation for Economic Co-operation and Development] countries and 2040 in all others; net-zero electricity generation by 2035 in developed countries, and 2040 elsewhere; no more licensing or funding of new fossil-fuel projects; no more subsidizing fossil fuels; and no more fake offsets, which do nothing to cut greenhouse-gas emissions, but which are still being used to justify fossil-fuel expansion today.

We can only reach net zero if we make real and immediate emissions cuts.  If we embrace transparency and accountability.  Relying on carbon credits, shadow markets, or murky accounting means one thing:  failure.  That is why I have asked CEOs to present clear net-zero transition plans, in line with the credibility standard presented by my high-level expert group on net-zero pledges.

And the Acceleration Agenda urges business and Governments to work together to decarbonize vital sectors — from shipping, aviation and steel, to cement, aluminium and agriculture.  This should include interim targets for each sector to pave the way to net zero by 2050.

The Acceleration Agenda also calls for climate justice, including overhauling the priorities and business models of multilateral development banks, so that trillions of dollars in private finance flow to the green economy.

Developed countries must also make good on their financial commitments to developing countries.  And they must operationalize the loss and damage fund, and replenish the Green Climate Fund.  I commend Austria for increasing its pledge to the Green Climate Fund by 23 per cent and urge others to deliver their fair share.

On climate, we have all the tools we need to get the job done. But, if we waste time, we will be out of time.  Let’s accelerate action, now.  Thank you.

Featured Image

Note that about half the surface of Earth’s Ocean is a good 2 °C hotter than the baseline average temperature for this day of the year

Views expressed in this post are those of its author(s), not necessarily all Vote Climate One members.

Meteorologists report weather – they don’t make it!

Meteorologists are being threatened and abused for forecasting and reporting record high temperatures and weather extremes.

Last week Spain recorded the highest April temperature on record (38.8 °C) following on from last year, 2022, its hottest year since records began.

Nearly 75 percent of Spain is susceptible to desertification due to climate change. Water reservoirs are at half their capacity and farmers unions say 60 percent of agricultural land is “suffocating” from lack of rain. Spain has asked Brussels to help by activating the EU’s agriculture crisis reserve funds (when many other areas of Europe are also suffering from drought).

Long drowned villages emerging from bottoms of desiccating reservoirs: The ruins of the Sant Romà church, exposed due to historically low water levels in the Sau reservoir, Spain in April. Photographer: Angel Garcia/Bloomberg

AFP – Agence France Presse – 05/05/2023, Barron’s

Insults, Threats Target Spain Forecasters Over Climate ‘Conspiracy’

Spain’s government on Friday came to the defence of the AEMET weather agency, which has suffered threats and abuse from climate conspiracy theorists over its forecasts during a record drought.

“Murderers”, “Criminals”, “You’ll pay for this” and “We’re watching you” are just some of the anonymous messages sent to AEMET in recent weeks on social media, by email and even by phone.

The threats were responding to forecasts and reports published by AEMET, notably over last week’s early heatwave, when Spain registered its hottest-ever temperature for April, reaching 38.8 degrees Celsius (101.8 degrees Fahrenheit) in Cordoba.

Read the complete article…

Drought → crop failures → famine?

Where the European/Mediterranean region is concerned, Spain is not the only country facing water crises. Even before the end of winter, the Guardian’s article of 4 March, ‘Very precarious’: Europe faces growing water crisis as winter drought worsens, Austria, Germany, France, Italy and Switzerland were all suffering problems from shortages of rain and runoff from the small amount of accumulated winter snow.

Australia has already lost a lot of agricultural productivity because of three years of La Niña flooding. For several months we couldn’t even buy frozen french fries (shades of the Irish Potato Famine). This may well be followed by even more damaging droughts when the next major El Niño surpasses the last two to reach 1.5 °C above the pre-industrial baseline, as seems likely given past trends.

As a target for those with an often visceral distrust of the established science of human-caused global heating, the Bureau of Meteorology’s temperature record might be seen as ground zero. Photograph: Bill Bachman/Alamy / from the article.

Graham Readfearn – 7/05/2023, The Guardian

Climate scientists first laughed at a ‘bizarre’ campaign against the BoM – then came the harassment

Former Bureau of Meteorology staff say claims they deliberately manipulated data to make warming seem worse are being fed by a ‘fever swamp’ of climate denial.

For more than a decade, climate science deniers, rightwing politicians and sections of the Murdoch media have waged a campaign to undermine the legitimacy of the Bureau of Meteorology’s temperature records.

Those records say Australia has warmed by 1.4C since 1910, the year when the bureau’s main quality-controlled climate dataset starts.

Extremely hot days come along more often than they used to, and the warming trends are happening everywhere, at all times of the year.

As a target for those with an often visceral distrust of the established science of human-caused global heating, the bureau’s temperature record might be seen as ground zero.

“This has frankly been a concerted campaign,” says climate scientist Dr Ailie Gallant, of Monash University. “But this is not about genuine scepticism. It is harassment and blatant misinformation that has been perpetuated.”

Read the complete article….

Attacking messengers because you dislike or fear the messages only impedes circulating knowledge that might help to solve real-world problems and save your life or the lives of your family members. That global warming causes record temperatures and droughts is a fact that causes problems…. Denying the fact does not make the problems go away! It only keeps the problem from being solved until it is too late to do anything effective.

When there are too many crop failures over too wide an area for too long, famine is the consequence, and can lead to. Continuing famine leads to starvation and, eventually, mass deaths.


Featured Image:

Situation of Combined Drought Indicator in Europe – 2nd ten-day period of April 2023 from Copernicus’s EDO – European Drought Observatory

Views expressed in this post are those of its author(s), not necessarily all Vote Climate One members.

Bad news for whales and oceanic carbon capture

Warming oceans are bad news for twilight zone organisms carrying captured carbon into the abyss when they die (and whales eat).

An observation

A Hula Skirt Siphonophore (cnidarian) a ‘twilight zone’ inhabitant – via BBC News Climate and Society
Bristlemouth fish
Bristlemouth, the commonest kind of fish on Earth mops up smaller creatures in the twilight zones of Earth’s oceans. / NOAA / Ocean Explorer

Maddie Molloy – 03/05/2023, BBC News Climate and Society

Climate change: life in ocean ‘twilight zone’ at risk from warming

Climate change could dramatically reduce life in the deepest parts of our oceans that are reached by sunlight, scientists warn.

Global warming could curtail life in the so-called twilight zone by as much as 40% by the end of the century, according to new research.

The twilight zone lies between 200m (656ft) and 1,000m (3,281ft).

It teems with life but was home to fewer organisms during warmer periods of Earth’s history, researchers found.

Read the complete article….

How warming works in the twilight zone

Closeup of long chain of Salp zooids (tunicate / feeds on phytoplankton). Photo by Larry Madin, Woods Hole Oceanographic Institution
Confetti squid. Photo by Paul Caiger, Woods Hole Oceanographic Institution.
Bobtail squid (order Sepiolida) are a group of cephalopods closely related to cuttlefish. Bobtail squid tend to have a rounder mantle than cuttlefish and have no cuttlebone. Photo by Paul Caiger, Woods Hole Oceanographic Institution.

Ocean Twilight ZoneWoods Hole Oceanographic Institution, 04/05/2023

Why is it so important to understand life in the ocean twilight zone?

How much life is in the ocean twilight zone?

The twilight zone is home to more fish than the rest of the ocean combined. Most of these fish—and other organisms that live in the zone—are tiny, measuring just a few inches long or less. But some, like gelatinous siphonophores, can form chains that extend as much as 130 feet, making them among the biggest animals on Earth. Even the smallest twilight zone inhabitants can be powerful through sheer number, however. A tiny but fierce-looking fish called a bristlemouth is the most abundant vertebrate on the planet—for every one human, there are more than 100,000 bristlemouths. 

How does life in the twilight zone affect global climate?

By migrating to and from the surface, eating, being eaten, dying—and even by pooping—organisms in the twilight zone transport huge amounts of carbon from surface waters into the deep ocean. That process, called the biological pump, plays an important role in regulating Earth’s climate.

Read the complete article….

The science behind the observations

Katherin A. Chriton, et al. – 27/04/2023, Nature Communications

What the geological past can tell us about the future of the ocean’s twilight zone

Abstract: Paleontological reconstructions of plankton community structure during warm periods of the Cenozoic (last 66 million years) reveal that deep-dwelling ‘twilight zone’ (200–1000 m) plankton were less abundant and diverse, and lived much closer to the surface, than in colder, more recent climates. We suggest that this is a consequence of temperature’s role in controlling the rate that sinking organic matter is broken down and metabolized by bacteria, a process that occurs faster at warmer temperatures. In a warmer ocean, a smaller fraction of organic matter reaches the ocean interior, affecting food supply and dissolved oxygen availability at depth. Using an Earth system model that has been evaluated against paleo observations, we illustrate how anthropogenic warming may impact future carbon cycling and twilight zone ecology. Our findings suggest that significant changes are already underway, and without strong emissions mitigation, widespread ecological disruption in the twilight zone is likely by 2100, with effects spanning millennia thereafter. [my emphasis]

Read the complete article….

Why is all this important to know?

Ocean fertilization to stimulate algal growth over the surface of the abyssal ocean offers a means to capture CO₂. A food chain of pelagic consumers ranging from the twilight creatures harvesting the algae and their larger predators up to whales can then capture and package the carbon capturing algae into a range of parcels from fecal pellets to dead whales that will drop to the ocean floor.

The nature of biological systems is that they are self-reproducing and can grow exponentially under suitable conditions. ‘farming’ these consumers to optimize the carbon capture and transport it to the bottom is something that might realistically have the capacity to actually reduce atmospheric CO₂ on a fast enough timescale to slow, stop and reverse global warming.

However, the articles above show that a warming ocean substantially reduces the viability of the twilight organisms that provide the packaging service. Thus, if we don’t implement this biological sink before significantly more warming occurs, this opportunity to reverse the warming process may be lost.

Featured image: Antarctic krill Euphausia superba (copyright Uwe Kils, Institute of Marine and Coastal Sciences, RUTGERS University). Along with bristlemouth fish, krill are major components in the food chain of the twilight zone’s biological carbon pump potentially sequestering carbon in the abyssal depths of the world’s oceans. The world oceans’ surfaces, away from the shallows, are comparatively sterile because the water lacks micro nutrients (e.g., iron, manganese) required to support phytoplankton. Thus, vast areas of the oceans lack effective biological pumps to sequester carbon. Fertilizing these sterile areas of the oceans with trace nutrients and farming the twilight zone (i.e., seeding with appropriate species to provide the biological pumping mechanism) may establish a sufficiently extensive mechanism to sequester globally significant amounts of carbon in the abyssal depths.

.

Views expressed in this post are those of its author(s), not necessarily all Vote Climate One members.

Ominous climate crisis trends for 2023 onward

Berkeley Earth shows March 2023 was abruptly warmer than February and tied for the 2nd warmest March globally since records began in 1850.

Berkeley Earth’s global temperature readings are ominous news where the climate crisis is concerned.

Berkeley Earth is an independent climatology research organization established in 2010 to systematically address five major concerns that global warming skeptics had identified, and did so in a systematic and objective manner. The first four were potential biases from data selection, data adjustment, poor station quality, and the urban heat island effect. Their analysis showed that these issues did not unduly bias the record. The fifth concern related to the over-reliance on large and complex global climate models by the Intergovernmental Panel on Climate Change (IPCC) in the attribution of the recent temperature increase to anthropogenic forces. They obtained a long and accurate record, spanning 250 years and showed that it could be well-fit with a simple model that included a volcanic term and, as an anthropogenic proxy, CO2 concentration.

Berkely Earth has several major objectives for their continuing work:

  • Further scientific investigations on the nature of climate change.
  • Continued identification, investigation, and illustration of opportunities for applications of our global temperature dataset and air pollution data, and work with global industries and governments to inform and support immediate and long-term decision-making on global warming. 
  • Continue as the world leader in the collection, analysis, and presentation of world air quality information. 
  • Establish and strengthen partnerships with national and international media, NGOs, industry leaders, government decision-makers to explore and promote ways to communicate and utilize our data.  
  • Increase the collection, analysis, and presentation of ocean data.

The climate science community accepts Berkeley Earth’s independently constructed reports among the standards used for cross-checking the accuracy of other reports (i.e., as independent observations of what should be the same reality).

The global mean temperature in March 2023 was 1.52 ± 0.10 °C (2.74 ± 0.18 °F) above the 1850 to 1900 average, which is frequently used as a benchmark for the preindustrial period. The global mean temperature anomaly in March 2023 exhibited a sharp increase in temperature relative to February 2023, rising more than 0.2 °C (0.36 °F). This was driven by sharp warming on land, 0.4 °C (0.72 °F), and moderate warming in the oceans, 0.1 °C (0.18 °F). Such large month-to-month shifts are uncommon, but not unheard of, occurring approximately 5% of the time.

March 2023 Temperature Update

Robert Rohde – 12/04/2023, Berkeley Earth

The following is a summary of global temperature conditions in Berkeley Earth’s analysis of March 2023.

  • Globally, March 2023 was abruptly warmer than February and tied for the 2nd warmest March since records began in 1850.
  • March global average temperatures exceeded 1.5 °C (2.7 °F) above the 1850 to 1900 baseline, becoming the 10th time this has occurred for a monthly average.
  • On land, March 2023 was the 2nd warmest March since 1850.
  • Warm conditions occurred in much of Asia, parts of Europe and North Africa, the Arctic, southern South America, and several oceanic regions.
  • Unusually cool conditions were present in parts of the Western United States and Canada, as well as much of the Southern Pacific.
  • The Pacific exhibits neutral conditions with a transition to El Niño considered likely later this year.
  • 2023 is on pace to be the 2nd, 3rd, or 4th warmest year, but considerable uncertainty remains, including a substantial 38% likelihood that 2023 could become a new record warm year.
Read the complete article….

The global heat rise in March and April is more than reflected in the average sea-surface temperature (SST) anomaly over most of the Earth outside the polar regions not included in the following measurements depicted by the University of Maine’s ClimateReanalyzer.org, whose supercomputers reconstruct and record a wide range of climate observations from many thousands to millions of data points for the planet every day. Even as the SST is falling significantly at the end of April after reaching an all-time record, it is still way higher than any previous record for this time of the year.

Some idea of the quality and magnitude of the input data can be found by following the links below the graphics in this document.

Daily variation in the Global Sea Surface Temperature Anomaly from 1981 through May 1, 2023. Climate Reanalyzer / Climate Change Institute / University of Maine

Current sea surface temperatures also indicate the likelihood that the next El Niño is brewing that will drive global average (and many local) temperatures to new record highs.

Sea Surface Temperaure Anomalies for 2 April 2023. Climate Reanalyzer / Climate Change Institute / University of Maine. Note the anomalous patch of very hot water west of the equatorial coast of South America and the warm patch extending west of this along the Equator. This is a strong indicator for a developing El Niño condition.

We can conclude from these observations, that there is no evidence that the process of global warming has stopped or even slowed. If we don’t stop it soon, humans – and for that matter – all life on Earth will suffer from the failure. Political as well as personal action is required if we are to give our offspring a viable future.

Featured Image

Berkeley Earth’s plot of Global Warming by Month through the end of February 2023: “The most significant spatial features of year-to-date temperatures are the end of La Niña, warmth across much of the northern mid-latitudes, and several ocean hotspots. Year-to-date, 3.9% of the Earth’s surface has experienced average temperatures that are a local record high. In addition, 0.01% of the surface has been record cold year-to-date.” https://berkeleyearth.org/march-2023-temperature-update/.

Views expressed in this post are those of its author(s), not necessarily all Vote Climate One members.

Human survival depends on total mobilization to fight global warming

Australian security leaders including the ex Defence Force Chief, Chris Barrie, and Air Force Deputy Chief, John Blackburn warn that global mobilization is required to deal with the existential threat (i.e., human extinction) from global warming: “Global inaction has resulted in climate change becoming an immediate existential threat to humanity and, together with nuclear war, is the greatest threat to the security of Australia and its people: “Global inaction has resulted in climate change becoming an immediate existential threat to humanity and, together with nuclear war, is the greatest threat to the security of Australia and its people.”

I have said this myself many times, e.g., On the down-hill road to extinction and in other posts on Climate Sentinel News — but here it is being said by people who should matter to our Parliaments.

A submission to a defence review says Australia’s military could be a ‘significant contributor’ in mobilising against climate change. Photograph: Jonathan Geodhart/Australian Defence Force/AFP/Getty Images (from the article.

by Daniel Hurst, 8/12/2022 in The Guardian

Australia needs ‘wartime mobilisation’ response to climate crisis, security leaders say

Australian Security Leaders Climate Group says measures needed to contain climate change will be disruptive, but better than ‘existential threat’ of the alternative

Australia must adopt a “wartime mobilisation” response to the climate emergency, former security leaders have told a review of the country’s defence policy.

The Australian Security Leaders Climate Group is calling for “a fundamental reframing of Australia’s defence and security strategy” away from geopolitical rivalry.

The group – whose members include the former Australian defence force chief Chris Barrie and former air force deputy chief John Blackburn – argues the country must push for unprecedented global cooperation on the climate crisis.

Despite the US and Australia vowing on Wednesday to “drive stronger global action to address the climate crisis”, the security leaders insist the issue is still being treated as an afterthought rather than a top-order threat.

Read the complete article….

Voters need to ensure that our elected representatives take the climate emergency as seriously as our Defence chiefs do, and enact the necessary laws and provide the necessary leadership to ensure this effort is mobilized at state, national and international levels.

Featured Image from The Strategist (The Australian Strategic Policy Unit) article, Australia needs to build total defence in the face of national crises The following quote is also from that source:

In Australia, the prevailing view of mobilisation is that it is an activity associated with going to war. In the event of an armed conflict, the nation mobilises to support the Australian Defence Force. Against recent events, including the 2019–20 bushfires and Covid-19 pandemic, the ADF has mobilised to support the nation. As the range of potential hazards now encompasses high-end warfighting, grey-zone conflict, terrorism and organised crime, as well as domestic and offshore natural disasters, no single institution can sufficiently respond on its own.

Mobilisation should be redefined as occurring in response to all such events, drawing on all required and available elements from across the breadth of Australian society. But it must not be seen as just the response to a crisis; it should also include preparing for and, where possible, preventing such events, as well as supporting subsequent recovery efforts.

Views expressed in this post are those of its author(s), not necessarily all Vote Climate One members.

Urgent action needed now to stop warming!

Aside from some flooding Australia has had it fairly easy compared to increasing frequency, extent, and severity of climate catastrophes in other parts of the world.

Don’t let our cooler La Nina and Indian Ocean dipole conditions fool you. The rest of the world really suffering!

Bill McKibben, is an American environmentalist, author, and journalist who has written extensively on the impact of global warming and and leads the climate campaign group 350.org. Here he summarizes evidence from increasingly frequent, extensive, and ferocious climate catastrophes in the Northern Hemisphere that shows global warming is continuing to accelerate.

As many articles posted on Climate Sentinel News in the run-up to Australia’s May 21 federal election also show, nothing we have done to date has measurably slowed the acceleration of global warming that may well lead to runaway warming and global mass extinction of humans and most other complex life on Earth. To stop this process while we can, our nations need to actively mobilize now to stop all carbon emissions and begin rapidly ramping up research and pilot projects to recapture and safely sequester some of the excess carbon already in our atmosphere.

Removing our COALition Government and electing several more ‘teal’ community independents to Parliament in the election just passed has finally given us a Labor Government that might be able to prioritize real climate action. However, because Labor continues to have its share of special interest puppet masters in the fossil fuel industry, pressure still needs to be applied by voters and their teal representatives in Parliament to speed climate action.

As the featured article here shows, we are already seeing the kinds of climate catastrophes able to cause mass human die-off events directly from the climate extremes themselves or famines resulting from associated crop failures.

A buoy rests on the cracked mud of Lake Mead in Nevada, in normal times America’s biggest reservoir (from the article)

by Bill McKibben, 23/08/2022 in the Crucial Years

Water, Water Nowhere – Except the spots that are flooding

China is enduring a truly remarkable heatwave—by some accounts “the worst heatwave known in world climatic history.” (Its main competitor for the title may be last year’s insane ‘heat dome’ that ran Canadian temperatures up to 121 Fahrenheit). The heat just never lets up over some of the most densely populated land on planet earth: It hit 113 degrees Fahrenheit in Chongqing Thursday, the highest temperature ever recorded in the country outside of desert Xinjiang. It hit 110 in Sichuan, which is a province of…80 million people, or two Californias. When it gets that hot, water just evaporates—Sichuan is 80 percent dependent on hydropower, but the reservoirs behind the great dams like Three Gorges are falling nearly as fast as Lake Mead and Lake Powell. The province has cut power day after day, including to Tesla and Toyota factories, and to many of the firms that supply the planet’s auto parts; the EV revolution is being held up by the effects of the problem it is trying to solve.

Read the complete article….

Featured Image: Own resources.

Views expressed in this post are those of its author(s), not necessarily all Vote Climate One members.

July 2022 Climate – still on road to extinction

Australia has a new government. Every month we fail to stop global warming is a month closer to global mass extinction. Still no visible progress towards solution.

https://nsidc.org/arcticseaicenews/charctic-interactive-sea-ice-graph/

The graphic above downloaded today shows the current state of sea-ice surrounding the Antarctic continent. Despite what seems to be a cold winter in Victoria, its coverage indicated by the teal blue line in the chart is 530 km2 smaller than it has ever been before for this time of the year. There are many more indicators that the climate is still deteriorating towards making Earth uninhabitable for its present life forms (including humans!) at an accelerating rate.

The following news items underline the dangers this represents for humans.

Model-analyzed temperatures at 12Z Tuesday, July 19, 2022 (noon GMT) were transcending average values for the time of day and season by 12 to 24 degrees Celsius—or 22 to 33 degrees Fahrenheit—over large parts of northwestern Europe. (Image credit: tropicaltidbits.com) [from the article]

by Bob Hensen, 17/07/2022 in Eye on the Storm, Yale Climate Connections

Horrific heat descends upon Western Europe: 104°F in London

Dozens of all-time record highs melted on Monday and Tuesday under a searing, deadly European heat wave that has caused at least 1,169 heat-related deaths in Spain and Portugal. The heat wave has also brought the hottest day on record for many locations in France and the hottest temperatures — by far — ever observed in the United Kingdom.

The record-smashing heat in Europe’s normally mild, maritime northwest corner was eerily comparable to the astounding heat wave in the U.S. Pacific Northwest and far southwest Canada in June 2021. The latter was found to have been “virtually impossible” without human-produced climate change.

By 9 a.m. GMT on Tuesday, July 19, London’s Heathrow Airport had already surged past 90°F, and at 12:50 p.m., the airport’s official observing site for London recorded what, if confirmed, would be the hottest temperature in London history: 40.2 degrees Celsius, or 104.4 degrees Fahrenheit.

Read the complete article

Record high temperatures and extreme weather events are being recorded around the world. Photograph: Ian Logan/Getty Images [from the article]

by Robin McKie, 31/07/2022 in the Guardian

‘Soon it will be unrecognisable’: total climate meltdown cannot be stopped, says expert

Blistering heatwaves are just the start. We must accept how bad things are before we can head off global catastrophe, according to a leading UK scientistRobin McKie.

The publication of Bill McGuire’s latest book, Hothouse Earth, could not be more timely. Appearing in the shops this week, it will be perused by sweltering customers who have just endured record high temperatures across the UK and now face the prospect of weeks of drought to add to their discomfort.

And this is just the beginning, insists McGuire, who is emeritus professor of geophysical and climate hazards at University College London. As he makes clear in his uncompromising depiction of the coming climatic catastrophe, we have – for far too long – ignored explicit warnings that rising carbon emissions are dangerously heating the Earth. Now we are going to pay the price for our complacence in the form of storms, floods, droughts and heatwaves that will easily surpass current extremes.

Read the complete article

In the run-up to the May 21st Federal Election, I posted many more articles documenting the increasing risk of mass extinction that humans face if we do not stop and reverse the runaway acceleration that is flipping our global climate to the Hothouse Earth state.

In the Election Australians replaced the Liberal/National COALition with a more climate friendly Labor government supported by an extensive cross-bench of climate-friendly independents (‘teals‘) and Greens.

The Government has very little time (if any – see the article above) to act to stop carbon emissions and to do what we can to remove some of the past excesses from the atmosphere.

TIME IS OF THE ESSENCE!

Featured image:

Time series graphs showing the variation in the three most important greenhouse gases as observed and recorded by the US National Oceanic and Atmospheric Administration, Global Monitoring Laboratory at Mauna Loa Observatory, Hawaii.

The carbon dioxide data on Mauna Loa shown in the top row constitute the longest record of direct measurements of CO2 in the atmosphere. They were started by C. David Keeling of the Scripps Institution of Oceanography in March of 1958 at a facility of the National Oceanic and Atmospheric Administration [Keeling, 1976]. The first graph shows atmospheric CO2 concentrations over the last five complete years of the Mauna Loa CO2 record plus the current year. The second graph shows annual mean CO2 growth rates for Mauna Loa. In the graph, decadal averages of the growth rate are also plotted, as horizontal lines for 1960 through 1969, 1970 through 1979, and so on.

The middle row charts the growth of atmospheric methane: the first graph shows the full NOAA time-series starting in 1983, The red circles are globally averaged monthly mean values centered on the middle of each month. The black line and squares show the long-term trend (in principle, similar to a 12-month running mean) where the average seasonal cycle has been removed.The second graph summarizes annual increases in atmospheric CH4 based on globally averaged marine surface data.

The bottom row charts the growth of atmospheric N2O (Nitrous oxide) beginning in 2001, when NOAA began to have confidence in the data. Values for the last year are preliminary pending recalibrations of standard gases and other quality control steps. The second graph plots the annual increase in atmospheric N2O in a given year, i.e., the increase in its abundance (mole fraction) from January 1 in that year to January 1 of the next year, after the seasonal cycle has been removed (as shown by the black lines in the first figure). It represents the sum of all N2O added to, and removed from, the atmosphere during the year by human activities and natural processes.

As yet, there is NO evidence that any of these values are beginning to stop increasing, let alone decrease, as the result of any human actions.

Views expressed in this post are those of its author(s), not necessarily all Vote Climate One members.

S Hemisphere already seeing 2080 storms now

New studies show winter storms in the Southern Hemisphere are already reaching intensities predicted for 2080. Climate emergency is real!

Winter storms in the Southern Hemisphere. Credit: NASA Worldview (from the article)

By Weizmann Institute of Science, 26 May 2022 in Phys Org

New data reveals climate change might be more rapid than predicted

A new study, published today in Nature Climate Change, will certainly make the IPCC—and other environmental bodies—take notice. A team of scientists led by Dr. Rei Chemke of Weizmann’s Earth and Planetary Sciences Department revealed a considerable intensification of winter storms in the Southern Hemisphere. The study, conducted in collaboration with Dr. Yi Ming of Princeton University and Dr. Janni Yuval of MIT, is sure to make waves in the climate conversation. Until now, climate models have projected a human-caused intensification of winter storms only toward the end of this century. In the new study, Chemke and his team compared climate model simulations with current storm observations. Their discovery was bleak: It became clear that storm intensification over recent decades has already reached levels projected to occur in the year 2080.

Chemke, Ming and Yuval’s study has two immediate, considerable implications. First, it shows that not only climate projections for the coming decades are graver than previous assessments, but it also suggests that human activity might have a greater impact on the Southern Hemisphere than previously estimated. This means that rapid and decisive intervention is required in order to halt the climate damage in this region. Second, a correction of the bias in climate models is in order, so that these can provide a more accurate climate projection in the future.

Read the complete article….

Featured Image: NASA. Remote sensing from orbit has now been observing for decades how our planet is changing and providing massive amounts of data for increasingly accurate forecasts of climate change. Our futures depend on taking these predictions seriously…..

Views expressed in this post are those of its author(s), not necessarily all Vote Climate One members.

UN global assessment report on disaster risk reduction

New UN report forecasts an increasing frequency of colliding and concatenating climate catastrophes and disasters from global warming

A car is flipped over after a tornado tore through the area in Arabi, La., Tuesday, March 22, 2022 in a part of the city that had been heavily damaged by Hurricane Katrina 17 years earlier. A United Nations report release on Monday, April 25, 2022, says disasters are on the rise and are just going to get worse. A new UN report says the number of disasters, from climate change to COVID-19, are going to jump to about 560 a year by 2030. (AP Photo/Herald Herbert)

by Seth Borenstein, 26/04/2022 in AP News

Weary of many disasters? UN says worse to come

A disaster-weary globe will be hit harder in the coming years by even more catastrophes colliding in an interconnected world, a United Nations report issued Monday says.

If current trends continue the world will go from around 400 disasters per year in 2015 to an onslaught of about 560 catastrophes a year by 2030, the scientific report by the United Nations Office for Disaster Risk Reduction said. By comparison from 1970 to 2000, the world suffered just 90 to 100 medium to large scale disasters a year, the report said.

The number of extreme heat waves in 2030 will be three times what it was in 2001 and there will be 30% more droughts, the report predicted. It’s not just natural disasters amplified by climate change, it’s COVID-19, economic meltdowns and food shortages. Climate change has a huge footprint in the number of disasters, report authors said.

Read the complete article….

Editors Comment: We have important choices to make in the upcoming election: Vote for our business as usual government who still largely act as if there was no emergency (e.g., keep shoveling as much coal as they can onto the fires of global warming), won’t prepare for disasters, and won’t hold a hose when a disaster happens; or you can try to elect candidates who have provided evidence that they will put action on the climate emergency at the top of their Parliamentary agendas. If you make the latter choice, Vote Climate One gives you Climate Sentinel News to inform your decision and our Traffic Light Voting Guides for every Australian electorate to show you how each candidate in your electorate ranks on climate action.

Featured image: Fig. 2. Occurrence by disaster type: 2020 compared to 2000-2019 annual average. Climate Action and Disaster Risk Reduction. From GLOBAL ASSESSMENT REPORT ON RISK REDUCTION – Our World at Risk: Transforming Governance for a Resilient Future.

Views expressed in this post are those of its author(s), not necessarily all Vote Climate One members.