Australian MPs: Act now! Later may be too late!

Human activities are triggering self-reinforcing existential climate risks that are growing more lethal with time — our extinction is likely

Over the last 200 years prodigious amounts of carbon-based fossil fuels (coal, oil, methane) have been burned to produce waste gases (mostly CO₂) and useful energy to drive the Industrial Revolution, our affluence, our toys, our technologies, our wars, and everything that has followed. The fossil carbon humans have extracted from the Earth and burned in an instant of geological time took our planet millions of years to accumulate and store in the geosphere (i.e., rocks & soil). In the same geological instant, the waste gases released from the burning are fundamentally changing Earth’s atmosphere (the air we breathe, etc…). Because of the physical properties of CO₂ molecules and other atmospheric emissions, this has trapped enough additional solar heat in the atmosphere to significantly raise average temperatures around the world. In turn, the added heat is already causing unprecedented climatic disasters. These existential climate risks will only become more frequent and catastrophic as temperatures continue to rise. (See CO2: Past, Present, & Future – one of many dozens of articles covering the same facts, and Climate apocalypse).

However, natural regulatory processes in the climate system have kept the environment stable enough for more than 800,000 years up until the 20th Century – enough time for humans to evolve and develop the social systems, agriculture, technology, and cultural riches we benefit from today.

Image modified from the Scripps Institution of Oceanography
Atmospheric CO2 levels (blue line) and temperature (red line) from year 1,000 to 1978. Data for CO2 from Vostok ice core, Law Dome ice core, and Mauna Loa air samples. Data for temperature from Vostok ice core. CO2 measured here is in parts per million (ppm = by weight), which is similar to ppmv (by volume).

As shown in the graphs above, the shock to the composition of the atmosphere caused by these human generated changes is increasingly disrupting natural climate regulation. If we do not quickly stop and repair the damage we have done to the atmosphere, then over the next few decades increasingly extreme, frequent and extensive climate changes and catastrophes will be causing more death and destruction to our societies than we have the capacity to repair. In turn, this climate collapse will lead to agricultural, economic and social collapse followed by mass die-offs and probable human extinction within a century or two.

Business as usual cannot cope with a global systems breakdown. Nor can uncoordinated individual actions. However, at least for a few more years before systems breakdown has progressed too far, we should still be able to assemble the technology and knowledge to avoid this doom. Beginning with primitive Victorian era steam-punk technologies backed by a very limited scientific understanding of climate and geophysics, humans took over 150 years to burn enough fossil fuel to accidentally cause the present crisis. Today we have now developed a deep and detailed scientific understanding of how the world works and vastly more powerful technologies. With will, leadership, and cooperation at international, national, state, and local areas we should be able to locate, diagnose and repair aspects of the climate system we have broken to re-stabilize it in a state we can live with.

However, to do this we will have to revolutionise many of our governments. We need to change them from their usual businesses of representing and working for the special interests of their donors, patrons and puppet masters (many of them associated with fossil fuel industries), to a new business of truly representing the needs of the citizens they supposedly represent – – especially in the face of the growing climate crisis.

If you are an MP, you need to join this revolution!

The factual scientific evidence of the consequence we face if we fail to stop and reverse global warming is overwhelming. However, I recognize that a life in politics where almost everything can be ‘negotiated’ does not prepare most politicians to understand the difference between responding to non-negotiable facts of physical reality and the business-as-usual of getting elected/re-elected and trading influence.

In the remainder of this work I present some of the overwhelming evidence of the dangers we face from an increasingly destabilised climate system driven by unrestrained global warming, and why our governments must change and act if we are to have any hope of surviving the existential global crisis this is causing. Because this evidence is based on scientific laws developed over some 400 years of testing and practical use, it is totally independent of whatever people might want to ‘believe’ now about how the world works

Laws of physics, geology, chemistry and biology

The scientific laws of physics and chemistry describe how the universe we live in works, irrespective of anything we humans might want to believe. Because atoms and molecules work the way they do, burning carbon releases ‘greenhouse’ (i.e., heat trapping) gases into the atmosphere. Because the increased concentration of these gases in the atmosphere traps reduces the amount of solar energy leaving our planet, the world is growing warmer.

The US National Oceanic and Atmospheric Administration‘s (NOAA) Mauna Loa observatory’s records show the longest available continuous series of meticulous(!) measurements of important greenhouse gases. Variation in the two most important gases are shown below. The amount of these gases in the atmosphere increased every year since the recording began (except for methane which showed slight decreases in three out of 5 years beginning in 2000). More importantly, the rate of CO₂ increase has also increased in 5 of the 6 decades in the record (i.e., it’s getting worse even faster now than it was earlier!). These kinds of graphs are based on many discrete observations taken every day for many years at particular locations (in this case Mauna Loa, Hawaii) that are replicated by similar observations from other stable locations around the world (e.g., Cape Grim, Tasmania – see also CSIRO Atmospheric Composition and Chemistry).

NOAA Carbon Cycle Greenhouse Gases / Trends in CO₂ (carbon dioxide) / Trends in CH₄ (methane). The average amounts of gas are plotted (red dots) on a monthly basis. The average increase in the amounts of gas are plotted yearly.  Source gml.noaa.gov.

Greenhouse gases in the atmosphere act as a thermal blanket causing the Earth’s temperature to rise by reducing the amount of solar heat lost to space — same heat in, less heat out: inevitably everything covered by the blanket gets warmer. Just how much warmer is measured by the ‘temperature anomaly‘.

It should be no surprise that dumping millions of years worth of carbon accumulation into the atmosphere as greenhouse gases at an accelerating rate over 200 years or so has significantly affected global temperatures.
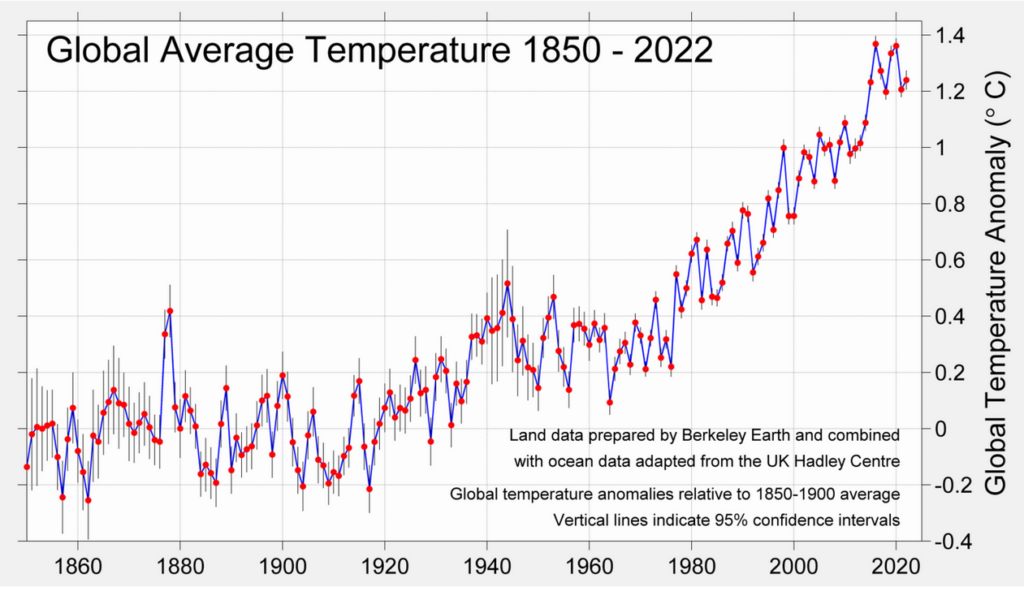
Berkeley Earth’s Global Temperature Report for 2022 – Posted on by Robert Rohde.
The global mean temperature in 2022 is estimated to have been 1.24 °C (2.24 °F) above the average temperature from 1850-1900, a period often used as a pre-industrial baseline for global temperature targets. This is ~0.03 °C (~0.05 °F) warmer than in 2021. As a result, 2021 is nominally the fifth warmest year to have been directly observed, though the years 2015, 2017, 2018, 2021, and 2022 all cluster closely together relative to their uncertainty estimates. In particular 2022 and 2015 are essentially tied, and 2022 could just as easily be regarded as the 6th warmest year. This global mean temperature in 2022 is equivalent to 0.91 °C (1.64 °F) above the 1951-1980 average, which is often used as a reference period for comparing global climate analyses. The last eight years stand out as the eight warmest years to have been directly observed. (Note: Berkeley Earth’s methodologies and their differences from other groups providing similar global temperature records are described here.)

Around ninety percent of the excess heat Earth absorbs is held in the oceans, and water in its three forms (gas, liquid and ice) is the main transporter for distributing that energy around the planet.
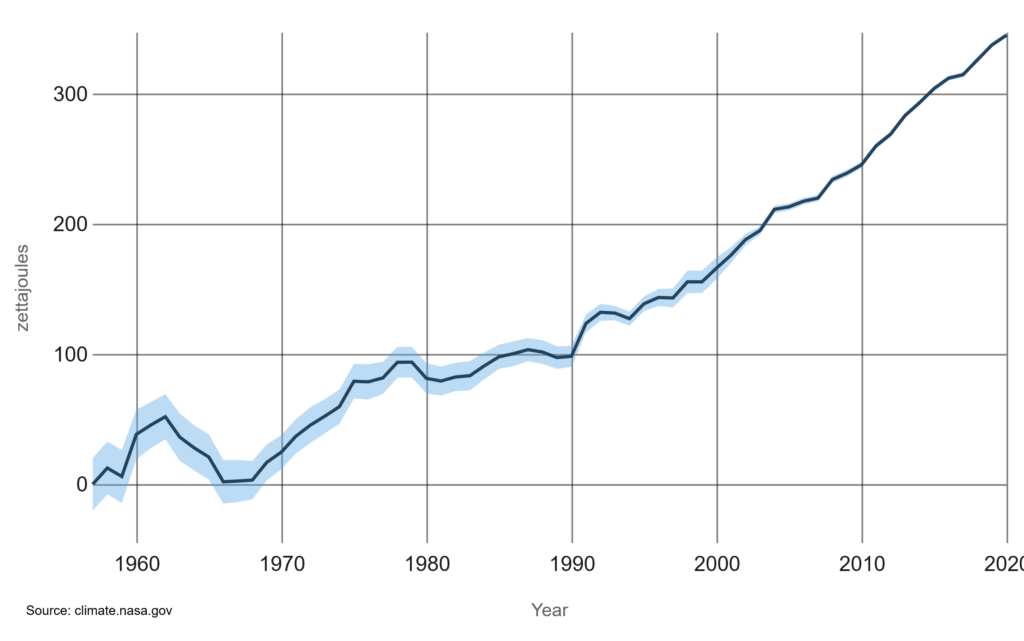
OCEAN HEAT CONTENT CHANGES SINCE 1955 (NOAA)
Data source: Observations from various ocean measurement devices, including conductivity-temperature-depth instruments (CTDs), Argo profiling floats, and eXpendable BathyThermographs (XBTs). Credit: NOAA/NCEI World Ocean Database. A more detailed graph including additional measurements from instrumented mooring arrays, and ice-tethered profilers (ITPs) covers the period 1992 – 2022. Credit NASA ECCO. Covering more than 70% of Earth’s surface, our global ocean has a very high heat capacity. It has absorbed 90% of the warming that has occurred in recent decades due to increasing greenhouse gases, and the top few meters of the ocean store as much heat as Earth’s entire atmosphere.
Note: If you want to grasp how many and what kinds of precision measurements – cross-checked across a variety of measurement platforms go into constructing these graphs, I suggest taking the time to go through one of ECCO’s presentations: ECCO: Integrating Ocean and Water.

Water (= H₂O) is a major component in the climate system and the main carrier of energy driving weather and climate change.

Each of water’s three physical states: water vapour (=gas), liquid water, and frozen water (=ice), together with transitions between the three states, all play important roles in the absorption, storage, transport, and release of heat around the planet. In its own right water vapour is also the most important and variable greenhouse gas.

Of all the natural materials forming the outer layers of the Earth, water has the second highest heat capacity of any known chemical compound. A lot of energy needs to be absorbed or released to warm or cool a quantity of water by even one degree — the amount of heat needed to raise the temperature of 1 gm water by 1 °C at standard pressure and temperature has its own name, the calorie. (An old unit of measure, but the easiest to follow here.) This same amount of heat is released when the 1 gm cools by 1°. To raise the temperature of 1.3 sextillion litres just by 1° of the world’s oceans takes the absorption of a humongous amount of heat!

Water (Hydrosphere) and Air (Atmosphere)

Water in the world Ocean

At temperatures above 4 °C, water expands as it warms. In other words, a parcel of water composed of a given number of molecules occupying space expands in volume as it warms from 4 °C to boiling. Thus, as the ocean warms, sea levels rise. Water running off the land from melting glaciers and ice sheets causes sea levels to rise further and faster.

Warmer waters lying over cooler waters of the same salt content tend not to mix. However, as warm salt water evaporates, salt is left behind, making the remaining surface water denser, until it becomes heavier than cooler water below, allowing the warm water to sink and mix with the cooler water. This helps to suck in ocean currents to replace parcels of the cooling saltier water as they become denser and sink into the depths.

Thus, ocean currents are important engines for transporting heat around the globe.

Water in the atmosphere

Boiling or evaporating 1 gm of liquid water to gas (i.e., invisible steam) at one atmosphere of pressure takes approximately 540 calories of energy (= heat of vaporisation/evaporation)! Similarly, when H₂O gas condenses to form visible steam (i.e., a mist of liquid water) the same energy of vaporisation is released as heat.

When liquid water freezes to form solid ice it releases ~80 calories/gm, while 80 calories of energy needs to be extracted from the surrounding environment to freeze 1 gm of liquid water to ice.

The gas laws discovered in the 1800s through practical experience with the thermodynamics of steam and internal combustion engines govern the relationships between temperature, volume, and pressure of gases. As heat energy warms a parcel of gas at a standard pressure, the absorbed energy causes the gas molecules comprising the parcel to move faster – resulting in increased volume (lowering the density of the parcel compared to surrounding parcels that have not changed in temperature). Or, vice versa increasing pressure will cause the gas parcel to heat up. Similarly, cooling gas will shrink in volume (i.e., become more dense) as its temperature decreases, or warming gas will increase its volume becoming less dense as it is heated. This is why parcels of warm air tend to rise in generally cooler air and vice versa.

Finally, another set of laws describes the solubility of water vapour in Earth’s atmosphere, and the solubility of the various gases forming the atmosphere in water. A parcel carrying the maximum concentration of a dissolved material is said to be ‘saturated’. Normally any excess over the point of saturation is precipitated out of the solution. Where precipitation of water vapour in the atmosphere is concerned, the precipitated water is called dew (if it collects on a surface), mist (if the droplets are small enough to remain floating in the atmosphere), rain (if droplets are large enough to fall to the ground) or snow (if it is cold enough for the precipitation of solid water). Hail is precipitated as liquid droplets that coalesce and freeze on the way to the ground. Basically, the capacity for the atmosphere to carry water as dissolved water vapour and the rate at which the vapour evaporates from the liquid increases substantially with temperature.

Note that the process of evaporation absorbs a lot of energy (i.e., the vapour stores the energy that drove the evaporation as latent heat) which is released as sensible heat when the dissolved vapour condenses and precipitates. Warm air can hold a lot of water vapour while cold air can only hold a little vapour. Thus a warm air mass is often able to suck moisture out of vegetation and soils, but as that mass rises in elevation and cools a temperature may be reached where the air is saturated (this is called the ‘dew point‘) and possibly massive amounts of water are precipitated as rain or snow together with the release of huge amounts of latent heat as sensible heat causing the air mass to rise still higher (e.g., into towering anvil topped cumulonimbus clouds). The rising air is liable to suck in high speed winds and possibly even form small and large hail, cyclones, and tornadoes. The higher the temperature of the air mass is when the dew point is reached, the more precipitation, heat and wind is generated.

As global warming increases baseline and average temperatures around the world, the amount of energy contained in parcels of water vapour increases, and thus increases the total amount of energy available to drive extreme weather events.

Water on the land and in the biosphere

Liquid water is a powerful solvent for all kinds of minerals and flows downhill wherever it can. Flowing water is relatively dense, and therefore an important agent for the transport of solid materials ranging from particles of sand to potentially huge boulders and even buildings. Consequently, standing and flowing waters are the major agents of dissolution, erosion and storm damage: especially when combined with storm-force winds.

All living things on Earth are partially comprised of water, with humans being about 60% water and even trees 50% water. The water in and around living things acts a) as a solvent and as a medium of transport for the dissolved gases required for photosynthesis (where this exists) and respiration; b) as a medium of transport for the ions, molecular nutrients and waste products of cellular metabolism and growth; c) as a structural element in the three-dimensional folding of proteins and other macromolecules; and d) as a structural element in the maintenance of hydraulic rigidity of the shapes of cells and vesicles, and even whole organisms. 

Every type of living thing requires the availability of a minimum amount of water of a minimum quality to survive. Conversely, too much water and/or water of the wrong quality (i.e., it may be transporting harmful substances as particles or in solution) or wrong temperature (i.e., the shapes and activities of proteins involved in metabolism unavoidably change with changing temperature) may also kill.

Air in the water

Atmospheric gases (e.g., nitrogen, oxygen, carbon dioxide) are more soluble in cold water than warm water. In other words, cold water can carry a lot more dissolved O₂ and CO₂ than warm water can.

CO₂ is relatively soluble in water because it readily forms carbonic acid. This is important for global warming because the oceans currently absorb about 30% of all global CO₂ emissions, thus slowing the rise of global temperatures due to the greenhouse effect. However, this is bad news for life on Planet Earth for three reasons: First, as the gas is increasingly absorbed into the water some of it turns into carbonic acid. This makes the water more acidic, dissolving calcium from shells and bones – contributing to the die off of plankton, corals, shellfish and bony fish. Secondly, given that CO₂ is the waste product of respiration it slows the respiration of all marine and aquatic organisms. Three, as water temperature rises CO₂ becomes substantially less soluble. This can be catastrophic for global warming because it acts like a time bomb. Rising temperatures drive significant amounts of CO₂ out of solution in the ocean, back into the atmosphere, where it acts as a positive feedback driving global temperatures still higher in a potentially vicious cycle.

O₂’s solubility in water is limited, but dissolved O₂ is critical to life for all complex organisms that respire water. This includes all aquatic or oceanic organisms: many bacteria, most protozoa, single-celled and multicellular algae (net O₂ producers by day, overnight they must extract O₂ at night for respiration) up to whole forests of giant kelp, giant squids, whale-sharks, and the largest whales. In the pre-industrial world O₂ levels in most waters were close to saturation. Any degree of warming beyond what species are adapted to live in reduces the amount of O₂ the water can carry. Species will begin dying when the O₂ levels fall below levels the different species have evolved to tolerate. For example, along the Southern California coast where I grew up, whole forests of giant kelp die off when the ocean temperature rises to around 23 °C. So do the myriad of other species living in those forests that may still be able to respire, because at some to many points in their lifecycles they required something the kelp provided. Other kelp forests around the world, and in Australia are also dying off, e.g., the once rich kelp forests of Tasmania – possibly even more comprehensively than they have in California (e.g., northern Tasmania).

And then there are the horrific die-off events in the rivers and lakes of Australia’s Murray-Darling region, where the combination of blistering heat combined with off-the-charts CO₂ levels is absolutely lethal to whole ecosystems. This year’s event even killed carp that can breathe air!

How will our Atmosphere, Hydro-/Cryo-sphere, Geosphere and Biosphere respond to global warming on the real Planet Earth?

Meteorology, climate science, earth systems science extend the basic laws of physics, chemistry and a little bit of biology into the real world. However, even a brief review of some of the basic laws of physics and chemistry above for water, oxygen, and CO₂ gives some hint of just how complex weather and climate change really are. Earth’s Climate System that generates weather and climate change in the world we live in is a complex dynamical system composed of probably hundreds of variables often interacting with one another in non-linear. Some of these interactions are poorly understood or even unrecognised even by the scientists studying them.

Even though the Earth System is absolutely and fundamentally governed by the physical laws of nature, trying to predict future weather and climate conditions is fraught with difficulties of two kinds. First, complex systems of many variables, where some of the variables have non-linear positive feedback relations with one another, often behave chaotically under some or even many conditions. (See also climate change feedback.) Second, is that some of the variables are probably still unknown to science or not well understood. Even the largest supercomputers in the world capable of performing more than 100 quadrillion calculations per second and working with millions of daily observations from around the world can only make usefully accurate weather predictions out to around 8 days before wandering off into random noise.

For these reasons, predicting the future trends of global warming with a high degree of accuracy and certainty is frankly impossible.  However, what is almost certain is that if we do not stop and reverse the process of global warming there will be major disruptions to all of these systems which will make much of the Earth uninhabitable for complex life.

How trustworthy are the sciences and the warnings?

The UN’s Intergovernmental Panel on Climate Change (IPCC) deals with the uncertainties by running large numbers of similar earth/climate system models (ensembles) with slightly varying inputs on supercomputers to forecast possible future trends and their likelihoods. These outputs are analysed statistically to determine frequent trends and the range of uncertainties around these trends. Thus, many believe that the models give us a relatively good idea of how changes in specific environmental variables are likely to change the climate.

Unfortunately, with regard to managing climate risks, the reality is that this approach is too conservative because:

  • It filters out some or all of the instances of chaotic extreme deviations from the likely results because these are usually considered to be consequences of “system breakdown” in what is assumed to be a bad model — even though system breaking ‘exponential blow-ups’ are to be expected in complex dynamical systems. In other words, the bad result where the model ‘breaks down’ may well be a realistically valid prediction of the model.
  • Most scientists agree that the RATE of climate change is increasing with time. However, the delays in knowledge flow between observation of reality and assessment and presentation of results mean that there is a lag built into the IPCC reports.  That is, the delays inherent in analysing and writing up the results, delays in conducting peer review and publishing the original research, conceiving and constructing and running the mathematical models based on those results to forecast the future, analysing and writing up the results of the modelling, delays in publishing these results; and then comes the added time cost to incorporate the published results in an IPCC Report. This IPCC process alone takes a minimum of 2-3 additional years of three drafts, two peer reviews, and a final sign-off by the political appointees of the 170 countries comprising the UN’s World Meteorological Organization. Thus, the years-old input data providing a baseline for the models’ predictions necessarily do not include the array of record-breaking temperature, greenhouse gas, and weather readings associated with the increasingly extreme weather events of the last few years.
  • Finally most IPCC scientists are associated with academic and research institutions funded by governments, where academic progress and promotions depend on not being too novel or controversial (i.e., exhibiting ‘scientific reticence‘). This leads to scientific self-censorship — downplaying alarming findings, reinforced by the need that IPCC Reports require political approvals by government appointees to be published.

The following graphic is the IPCC’s own depiction of their authoring and review process.

The graphic and a comprehensive description of IPCC’s writing and review processes are given in their document, Preparing Reports. In turn, even more detail on how each kind of document is prepared, reviewed and signed off is provided in the IPCC [Documentation] Procedures, according to the the Principles Governing IPCC Work that lay down the role, organisation and procedures of the IPCC. These guiding Principles establish comprehensiveness, objectivity, openness and transparency for all IPCC Work
.

Note, this and other issues with the IPCC’s predictions are examined in detail in my presentation: Some fundamental issues relating to the science underlying climate policy: The IPCC and COP26 couldn’t help but get it wrong.

Thus, when the formal IPCC reports publish their predictions for the future consequences: it follows that this is a gold-standard, scientifically correct but somewhat rose-tinted statement of the best possible outcomes we can hope for from the present state of the escalating climate emergency. The actual future is most likely to be worse, or even more worse. 

Given all of these factors, it is virtually impossible that the IPCC reports are in any way overstating the magnitude and dangers of the climate crisis.  Those who claim the IPCC reports are ‘alarmist’ are seriously misinformed or else aim to be deliberately misleading.

How do we know all of this?

There is a vast array of direct observational evidence from the real world (e.g., the graphs of increasing greenhouse gas concentrations and rising global temperatures presented above) showing that our global climate is already deteriorating at historically and even geologically unprecedented rates. A few recent observations sample this kind of evidence.

Identifying, analysing, and managing climate risks

Most climate scientists have backgrounds in mathematics, physics or geology where they are used to working with well behaved regular systems — not complex dynamical systems with potentially chaotic and unknown variables where the models are inherently fallible in their predictions of the future. Although the mathematical theory of chaos emerged from early attempts to model climate, few have any formal grounding in complex systems or chaos theory. Consequently, they tend to believe their models can predict the future with some degree of statistical accuracy, rather than accepting that models are good for explaining what can happen but not what will or won’t happen.

Scientists (including a few climate scientists) who continue to deny that current climate change is mainly due to human activity are often used to dealing with changes over long periods of time, where natural and well understood processes are more or less adequate to explain how climate has changed in the past.  Many of today’s deniers formed their opinions years ago (e.g. 1980s) when even climate specialists actively debated the extent and causes of climate change.  In people prone to denial, ‘confirmation bias’ then begins to reinforce conclusions, where data fitting their belief is eagerly accepted, but seemingly contradictory data is critically scrutinised and rejected. 

Over time, with the overwhelming additional data supporting unnaturally accelerated climate temperatures on land, air and sea, almost all genuine climate scientists have come to conclude that human activities are in fact changing the climate.  The holdouts are usually in those other disciplines that have a default assumption that natural processes always explain changes in climate.

And then, there are those who have totally unscientific reasons for denying that humans cause climate change.Following on my career as an evolutionary biologist (PhD Harvard 1973) with strong backgrounds in geology, physics, systems sciences (systems ecology, genetic systems, cybernetics), I was employed for 17 years as a knowledge management systems analyst and designer with what became Tenix and then Tenix Defence through the life-cycle of “Australia’s most successful naval surface combatant project – by far” – the ANZAC ship project. I worked very closely with the company’s engineering systems analysts and risk managers (often the same people did both). The ANZAC Project was so successful because the prime contract was performance-based rather than specifications based. We were contracted to deliver for a fixed price certain capabilities and reliabilities in service rather than meticulously detailed products.

Large defence systems – especially like warships and aircraft with their multitudes of subsystems, assemblies and piece parts, are complex dynamical systems that are inherently but unpredictably fallible due to unanticipated dynamics, human errors, or unpredictable failures of critical parts. It was the job of contract analysts, systems engineers, design engineers and knowledge managers (me), to work out a ship design and construction process that could be trusted to meet the customers’ requirements within the negotiated fixed price.

Failure Modes Effects and Criticality Analysis (FMECA)

The critical analytical tool in Tenix’s success, apparently unknown to climate science, is application of the Military Standard, Failure Modes Effects and Criticality Analysis (FMECA) within a risk analytical and management framework. Briefly, this involves (1) tabulating all conceivable failures and the potential consequence of the particular failure mode (i.e., its criticality) for every component of the system that might have a detrimental effect on the system’s safety or functionality, (2) preparing at least a matrix for every failure mode showing the approximate likelihood of failure, and (optionally) the likely consequences/costs to the system should the failure occur, and the costs to repair or mitigate the mode.

Applying FMECA to global warming

Should we ignore a risk because its consequences are so severe we fear accepting that it is real?

The following graphic plots an analytical matrix for the risk of human extinction from a failure to stop global warming at a safe global temperature for human survival. A serious analysis of this risk (that is unthinkable to many) demands examining the physical realities associated with each dimension of the matrix and looking for solutions to reduce consequences and likelihood of the risk happening, and to provide the maximum time possible to manage it; or alternatively, to entirely avoid the activities causing the risk. Unfortunately, given that the risk from global warming is associated with the project to power industrial, technological, and population growth by burning fossil fuels that began 150 years ago. Thus we have no choices but to live or die with the consequences arising from this project.
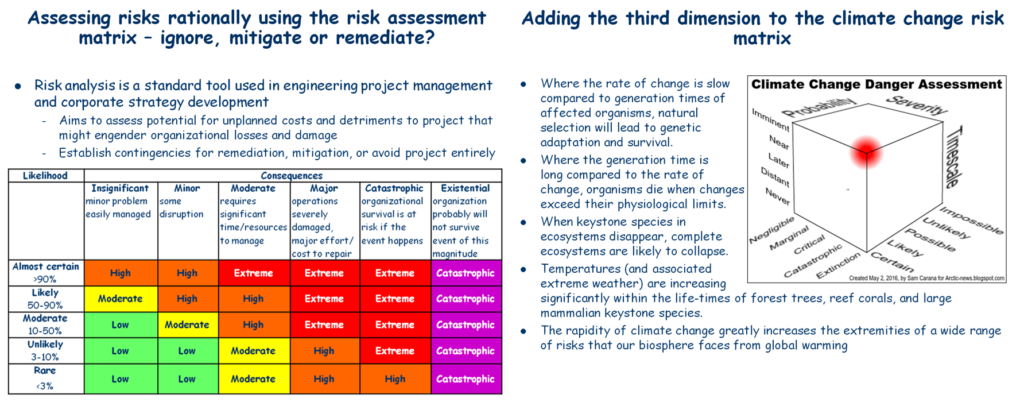
Slides 10 and 76 from Hall (2016). The angst of global warming – our species’ existential risk

Our planning to manage the risk must consider the third dimension — TIME. How much time do we have to manage the risk if we are to avoid its consequences? The possible consequences of the risk are existential – i.e., extinction of human society as we know it or even the entire species. The probability is likely to be certain if we do not stop and reverse global warming. The timescale is imminent, i.e., within the expected lifespan of today’s children.

Should we heed the science and the warnings?

The Intergovernmental Panel on Climate Change was established by the United Nations to research and provide the “best” scientific advice available to governments of the world regarding the science, trends, and likely progress of climate change. The Panel’s staff is selected and overseen by all the member states of the World Meteorological Organization. The peer review is exhaustive and intensive – probably more so than for any other scientific endeavour ever.

For reasons I have detailed it would be virtually impossible for any formal publication of the IPCC to overstate the dangers represented by climate change. Where the IPCC says that even the current trends will be catastrophic if realised, I would say that they are ‘existential’: A word the IPCC rarely uses and never defines.

Most dictionaries (e.g., see OneLook Dictionary Search) only define the word in terms of ‘existentialism’ – a branch of philosophy. In discussion of the climate crisis, in the framework of global catastrophic risk, “an existential danger threatens the very existence of something” (ref. Macmillan Dictionary).

The Wikipedia article on Global Catastrophic Risk defines “existential” in these terms:

Existential risks are defined as “risks that threaten the destruction of humanity’s long-term potential.” The instantiation of an existential risk (an existential catastrophe) would either cause outright human extinction or irreversibly lock in a drastically inferior state of affairs. Existential risks are a subclass of global catastrophic risks, where the damage is not only global but also terminal and permanent, preventing recovery and thereby affecting both current and all future generations.Note: This discussion of definitions may seem to be highly pedantic. It isn’t. It is deadly serious. Humanity faces a serious risk of triggering a global mass extinction event akin to the End Permian event that was “Earth’s most severe known extinction event,[11][12] with the extinction of 57% of biological families, 83% of genera, 81% of marine species[13][14][15] and 70% of terrestrial vertebrate species.[16] It is the largest known mass extinction of insects.[17]If you are declaring a state of emergency, it does not help to describe the emergency in soothing terms.
Views expressed in this post are those of its author(s), not necessarily all Vote Climate One members.

More on our warming World Ocean’s revenge…

Following on from my May 22 post, the Australian Bureau of Meteorology is raising warning flags that the impending El Niño will be the worst yet.

There is actually a lot more on the front burner than El Niño. There are signs we may have just crossed a catastrophic ocean tipping point over the last three and a half months. The following thread of tweets and news items summarizes a very scary thread of observational data.

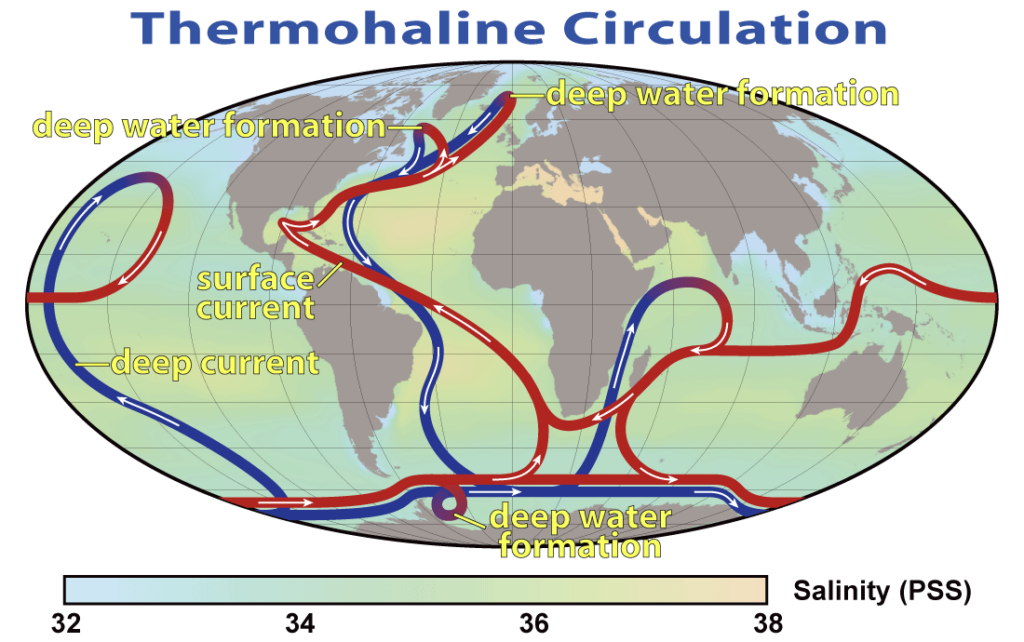
We may have broken Earth’s Thermohaline Circulation.

The data based on millions of satellite observations and hundreds of thousands of Argo Float profiles of ocean temperature, salinity and density suggests that the driver of major ocean currents distributing excess heat around the world has stopped working because it is choked with relatively hot and relatively fresh water.

In 2020 Argo collected 12,000 data profiles each month (400 a day) or around 436,500 profiles a year. Each profile provides for each increment of depth a a record of the variation in ocean temperatures, salinity, and pressure from 2,000 m deep to the surface, together with the precise global positioning coordinates where the probe surfaced.

In the past water flowing into the polar regions was quite salty because a lot of moisture evaporated from the surface in tropical and sub-tropical regions, leaving the salt behind to make the water more dense. However, because the water was hot the density was somewhat lowered due to thermal expansion it stayed on the surface because it floated over the surface of cooler but fresher water. As the salty water flowed into polar regions it cooled enough that even though it was being diluted by precipitation and runoff from melting snow and ice on the land, the cooling and increasingly diluted water become dense enough sink under the warm salty waters drawn towards the poles by the sinking polar waters. This circulation also carried oxygen into the depths and nutrients from the depths towards the surface in areas where deep water wells up to replace the surface water flowing towards the poles in tropical and temperate areas.

Wikipedia: Thermohaline circulation (THC) is a part of the large-scale ocean circulation that is driven by global density gradients created by surface heat and freshwater fluxes.

However, as global average temperatures rise and more heat is trapped in the ocean evaporation everywhere puts more moisture into the air that falls as rain in tropical and subtropical areas, diluting the warmer ocean surface waters. In polar and sub-polar areas the increased moisture greatly increasing the runoff from the land from rain and melting snow and ice, that further dilutes the increasingly diluted ocean surface water flowing into polar regions from tropical and subtropical areas.

The result is that the thermohaline conveyors driving the major ocean currents are probably being choked and possibly being completely stopped by masses of water that are too hot and dilute to sink. Even worse, the warm dilute water washing against the ice sheets and glaciers reaching the ocean melts ice at an increasing rate making the surface waters even fresher.

On 26 May, 2023 we are seeing an all-time low extent of sea ice since the satellite record began in 1979. http://kjpluck.github.io/seaice/

Denmark’s Polar Portal (below) shows the melting of the multi-year Arctic sea ice from its winter peak in June 2004 until now. [Click the picture to load the live site, scroll up to to see the “Sea Ice Thickness and Volume” title. Note the grey slider bar below the map. Click the “Animate Monthly” to load the animation — which will take some time to download the data. You may use the slider to scroll through the series of monthly maps, or you can control buttons below the slider to start and stop the animation or step back or forward one month at a time. The red color represents multi-year ice around 4 meters thick, lavender to blue ice is single year ice less than about 1.5 m thick.]

Note, there is an interesting but deadly physical twist here: As water temperature drops below 4 °C cold/freezing fresh water floats on top of warmer relatively salty water, and freezes-over in the winter at higher temperatures than saltier water. Paradoxically, floating ice and snow accumulating on the surface actually insulates the lower layer of warm salty water from further cooling, where the winter surface temperature may be 20-50 °C below freezing. However, the fronts of large glaciers flowing into the ocean may be grounded hundreds of meters below sea level or floating on even deeper warm water(!). This means they will still be melting rapidly from the bottom up even in the dead of winter when fresh water is freezing. The ice melt dilutes the polar oceans even more – so say nothing of raising sea levels that will, in turn, lead to the floating of glacier fronts, exposing even more areas to melting.

What is happening as I write this warning?

If you follow the threads and commentary attached to these tweets here, the links show what was happening a week ago.

The following Guardian articles highlight the existential risk we are facing.

Melting ice around Antarctica could cause a 40% slowdown of a global deep ocean current by 2050 if current greenhouse gas emissions continue, according to researchers. Photograph: Anadolu Agency/Getty Images / from the article

Graham Redfearn – 30/03/2023 in The Guardian

Melting Antarctic ice predicted to cause rapid slowdown of deep ocean current by 2050

New research by Australian scientists suggests 40% slowdown in just three decades could alter world’s climate for centuries.

[Actually, the data presented here suggests that as of the last three months or so this stoppage has already begun!]

Melting ice around Antarctica will cause a rapid slowdown of a major global deep ocean current by 2050 that could alter the world’s climate for centuries and accelerate sea level rise, according to scientists behind new research.

The research suggests if greenhouse gas emissions continue at today’s levels, the current in the deepest parts of the ocean could slow down by 40% in only three decades.

This, the scientists said, could generate a cascade of impacts that could push up sea levels, alter weather patterns and starve marine life of a vital source of nutrients.

Read the complete article….
Antarctica’s Larsen B ice shelf. There has never been less ice around the continent than there was last week. Photograph: staphy/Getty Images/iStockphoto / from the article

Graham Redfearn – 05/03/2023 in The Guardian

‘Everyone should be concerned’: Antarctic sea ice reaches lowest levels ever recorded

With the continent holding enough ice to raise sea levels by many metres if it was to melt, polar scientists are scrambling for answers.

For 44 years, satellites have helped scientists track how much ice is floating on the ocean around Antarctica’s 18,000km coastline.

The continent’s fringing waters witness a massive shift each year, with sea ice peaking at about 18m sq km each September before dropping to just above 2m sq km by February.

But across those four decades of satellite observations, there has never been less ice around the continent than there was last week.

“We are seeing less ice everywhere. It’s a circumpolar event.”

In the southern hemisphere summer of 2022, the amount of sea ice dropped to 1.92m sq km on 25 February – an all-time low based on satellite observations that started in 1979.

Read the complete article….
Melting ice in Antarctica has affected a key global ocean current, research suggests. Photograph: Anadolu Agency/Getty Images / from the article

Donna Lu – 26/05/2023 in The Guardian

Slowing ocean current caused by melting Antarctic ice could have drastic climate impact, study says

The Southern Ocean overturning circulation has ebbed 30% since the 90s, CSIRO scientist claims, leading to higher sea levels and changing weather.

A major global deep ocean current has slowed down by approximately 30% since the 1990s as a result of melting Antarctic ice, which could have critical consequences for Earth’s climate patterns and sea levels, new research suggests.

Known as the Southern Ocean overturning circulation, the global circulation system plays a key role in influencing the Earth’s climate, including rainfall and warming patterns. It also determines how much heat and carbon dioxide the oceans store.

Scientists warn that its slowdown could have drastic impacts, including increasing sea levels, altering weather patterns and depriving marine ecosystems of vital nutrients.

Read the complete article….

Markus Noll – 23/05/2023 in EarthArXiv

Exponential life-threatening rise of the global temperature

Global temperatures are rising. This paper demonstrates for the first time that the global temperature increase has not been linear but is exponential with a doubling time of about 25 years. Both the amount of carbon dioxide produced by the combustion of fossil fuels and the amount of carbon dioxide in the atmosphere have also risen exponentially, with a similar doubling time. The exponential trajectories of rising global temperature, carbon dioxide emission, and atmospheric carbon dioxide concentration support the idea that all three are entirely man-made. This analysis shows that during the past 70 years, the increasing use of fossil fuels results more from human activities than population growth, and that reducing the use of fossil fuels by 7.6% each year, the “7.6%-scenario”, can prevent annual global temperatures from surpassing pre-industrial temperatures by 1.6°C, a critical threshold to sustaining life on Earth.

Read the complete article….

Driven by exponentially increasing global temperatures, this process is also very likely to be accelerating at an exponential rate (doubling time of about 25 years).

Or worse!

What I think we are seeing in this data is that we have crossed a chaotically discontinuous ‘tipping point’. Prior to March 12, the thermohaline circulation was slowing as surface waters were gradually becoming warmer and more dilute, and thus less dense, decreasing the sinking rate of the cooling warm salty water that was driving the circulation. Around March 12, the surface waters actually became less dense than the deeper waters and thus stopped sinking at all to begin piling up in the polar regions where they would increase the rate of ice melting to be diluted still further.

With no sinking water to keep the the thermohaline circulation working, it has effectively been jammed and we are now in a totally new climate regime that is likely to get a lot hotter, a lot faster.

If this isn’t a climate emergency, I don’t know what is.

As at May 30, the heat anomaly is still growing. The average surface temperature of the World Ocean is a good 0.2 °C hotter than it has been on this day since the satellite records began in 1979; and it is only 0.1 °C cooler than the hottest temperature ever recorded in this era for any time of the year.

Featured Image

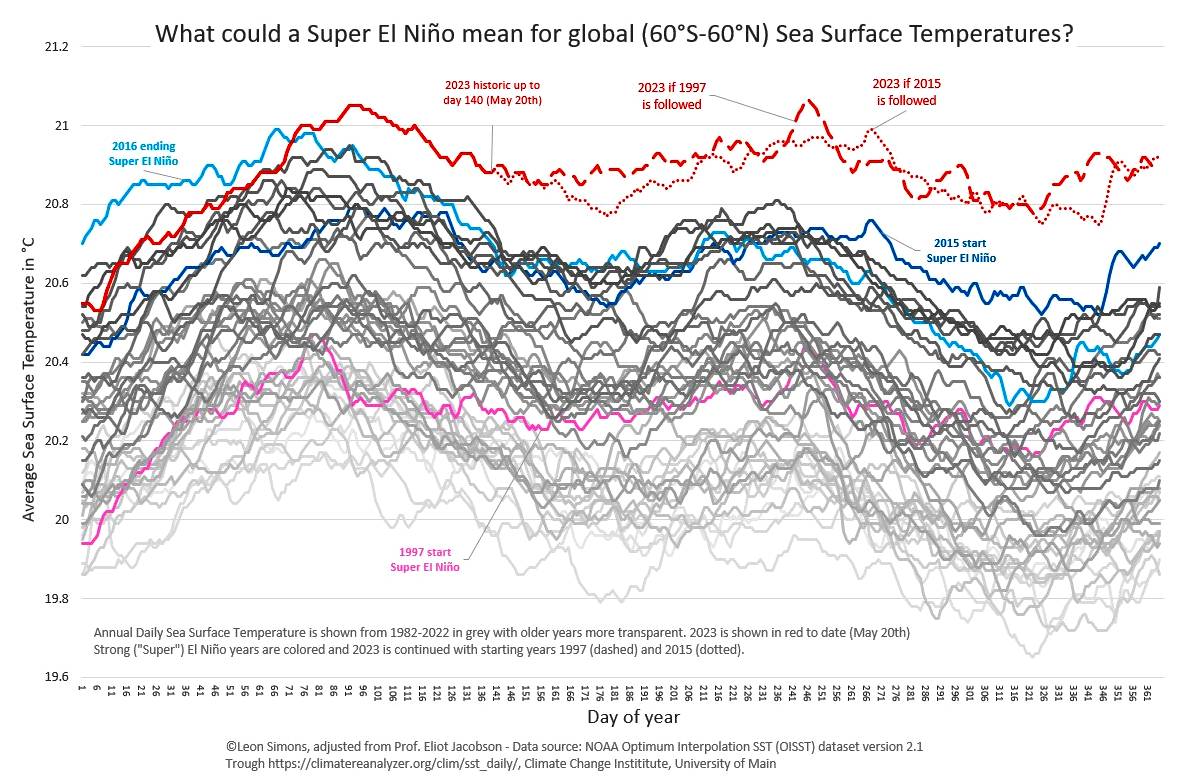
Figure from https://twitter.com/LeonSimons8/status/1663936433801887744/photo/1. “Will a Super El Niño materialize like in 1997 and 2015? What will that mean for global Sea Surface Temperatures? And for global and regional weather extremes?” This seems to be answered by https://twitter.com/LeonSimons8/status/1663195220207362048/photo/1

Views expressed in this post are those of its author(s), not necessarily all Vote Climate One members.

A warming ocean will take its revenge on us

Around 90% of the extra heat trapped by the greenhouse layer warms our Ocean to slow rising temperatures. We’ll pay the price.

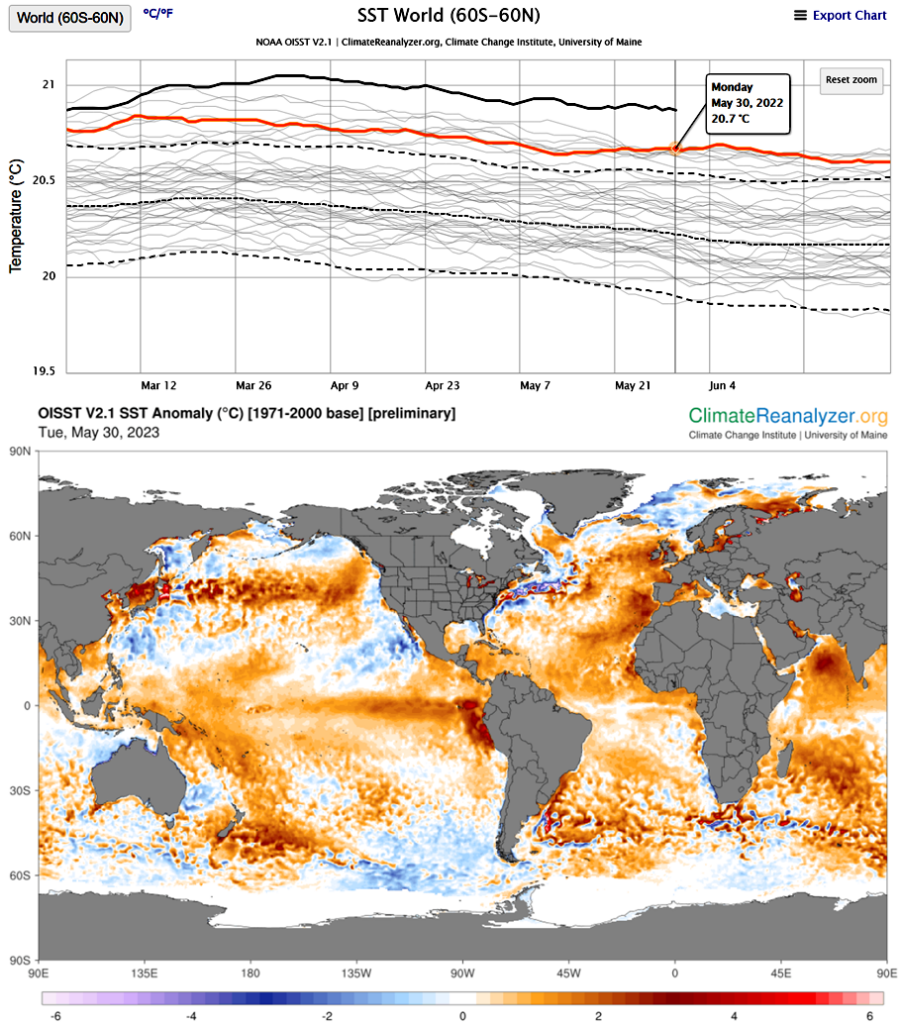
The climate scientist, Bill McKibben reminded me of this fact in his regular newsletter, The Crucial Years, in his 18 May post, Maybe we should have called this planet ‘Ocean’. His post on ocean warming begins with an earlier version of the graphic here from ClimateReanalizer. These are updated daily, so the record here is only a day or two behind the current reality:

The page provides time series and map visualizations of daily mean Sea Surface Temperature (SST) from the NOAA Optimum Interpolation SST (OISST) dataset version 2.1. OISST is a 0.25°x0.25° gridded dataset that estimates temperatures based on a blend of satellite, ship, and buoy observations. The OISST data product includes SST anomalies based on 1971–2000 climatology from NOAA. The datset spans 1 January 1982 to present with a 1 to 2-day lag from the current day. OISST files are preliminary for about two weeks until a finalized product file is posted by NOAA. This status is identified on the maps with “[preliminary]” showing in the title, and applies to the time series as well. The time series chart displays area-weighted means of the selected domain. For example, if World 60S-60N is selected, then the SST values shown are area-wieghted means for all ocean gridcells between 60°S and 60°N across all longitudes.

Something very troubling is happening on and under the 70 percent of the planet’s surface covered by salt water. We pay far more attention to the air temperature, because we can feel it (and there’s lots to pay attention to, with record temps across Asia, Canada and the Pacific Northwest) but the truly scary numbers from this spring are showing up in the ocean.

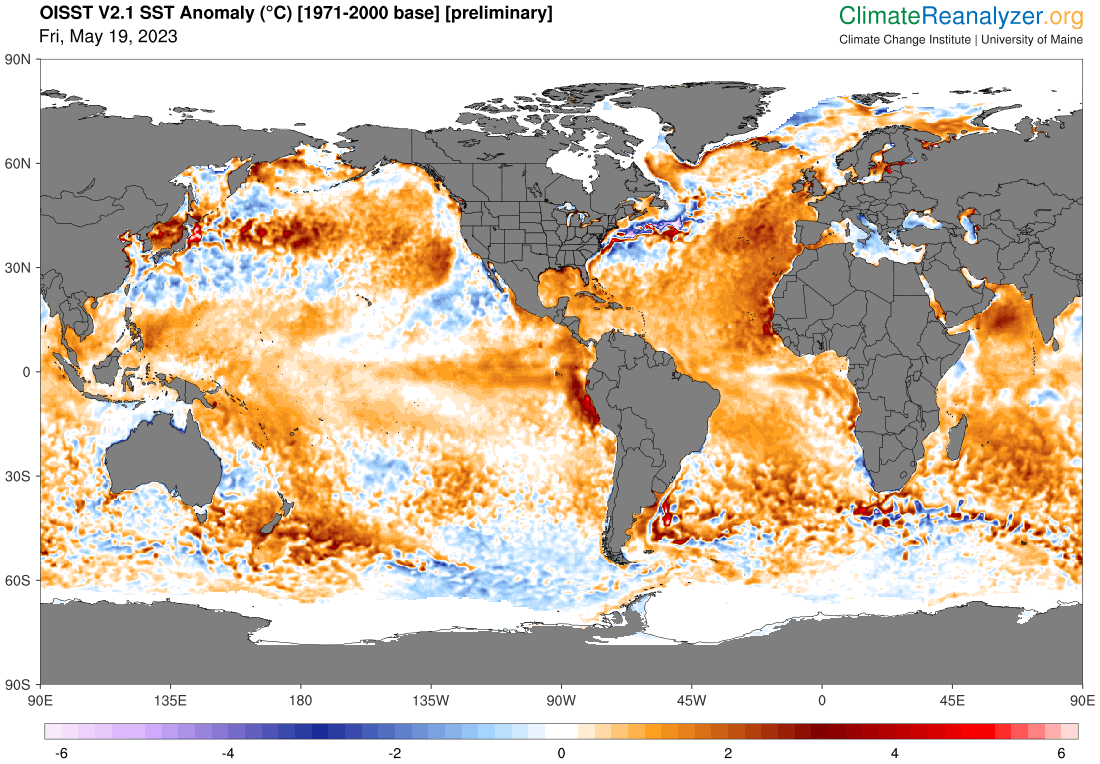
If you look at the top chart above , you can see “anomaly” defined. [His chart was for 11 May. Mine, here, is the temperature on 19 May.]That’s the averaged surface temperature of the earth’s oceans, and beginning in mid-March it was suddenly very much hotter than we’ve measured before. In big datasets for big phenomena, change should be small—that’s how statistics work, and that’s why the rest of the graph looks like a plate of spaghetti. That big wide open gap up there between 2023 and the next hottest year (2016) is the kind of thing that freaks scientists out because they’re not quite sure what it means. Except trouble. [My emphasis]

… A little-noticed [but quite important] recent study headed by Katrina von Schuckmann found that “over the past 15 years, the Earth has accumulated almost as much heat as it did in the previous 45 years,” and that 89 percent of that heat has ended up in the seas. That would be terrifying on its own, but coming right now it’s even scarier. That’s because, after six years dipping in and out of La Nina cooling cycles, the earth seems about to enter a strong El Nino phase, with hot water in the Pacific. El Nino heat on top of already record warm oceans will equal—well, havoc, but of exactly what variety can’t be predicted.

Read the complete article….

McKibben’s second graphic (the up to date version is my “Featured Image”) shows a global plot of temperature anomalies (also compared to the same 1971-1980 baseline) for every ¼° – ¼° square of ocean surface. “Area weighting” is applied because ¼° of latitude (the width of the ‘square) becomes much narrower as either pole is approached, reducing the physical surface area encompassed by the lines on the globe.

Earth’s oceans cover around 70% of the globe’s surface. Despite the 2nd or 3rd week of record breaking heat, wildfires and drought in western North America extending from California through the western 2/5ths of North America into the Arctic Ocean and a second belt in northern Eurasia extending from Scandinavia and Finland to western Siberia, the ocean temperatures are relatively even more extreme. And, in fact, the crazy heat in the warming oceans may be the driving force behind the record land temperatures — and may well be triggering what is likely to be the most extreme El Niño event yet in the climate change record.

In any event, this data doesn’t just freak me out. It suggests that the door to Earth’s Hothouse Hell is beginning to open to suck us in.


Is this data reliable enough to support action?

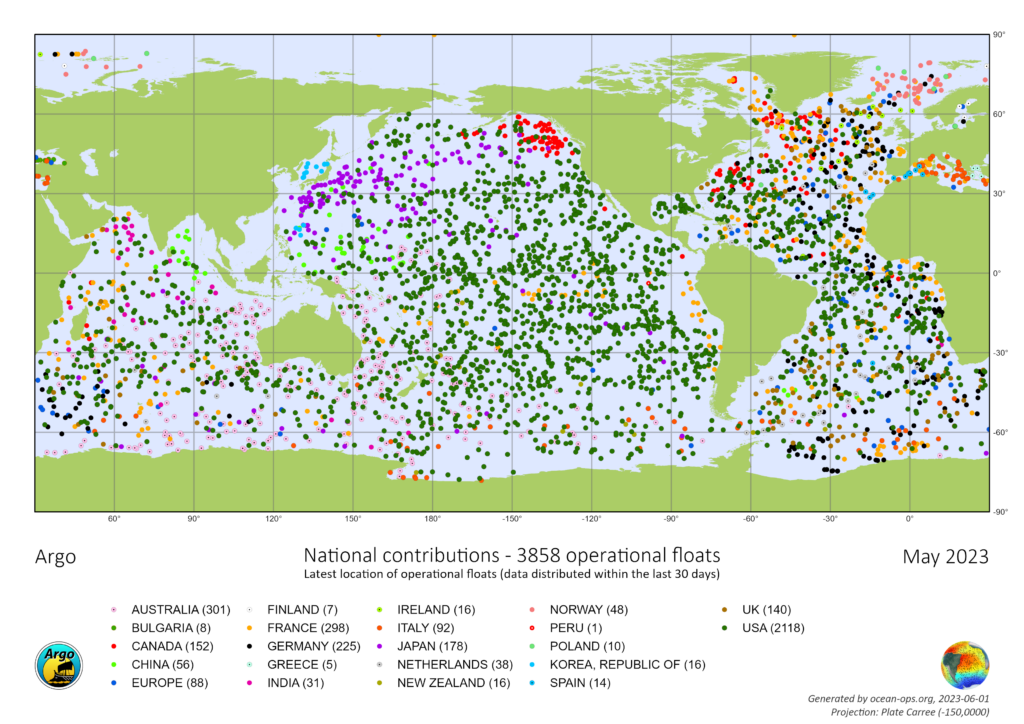
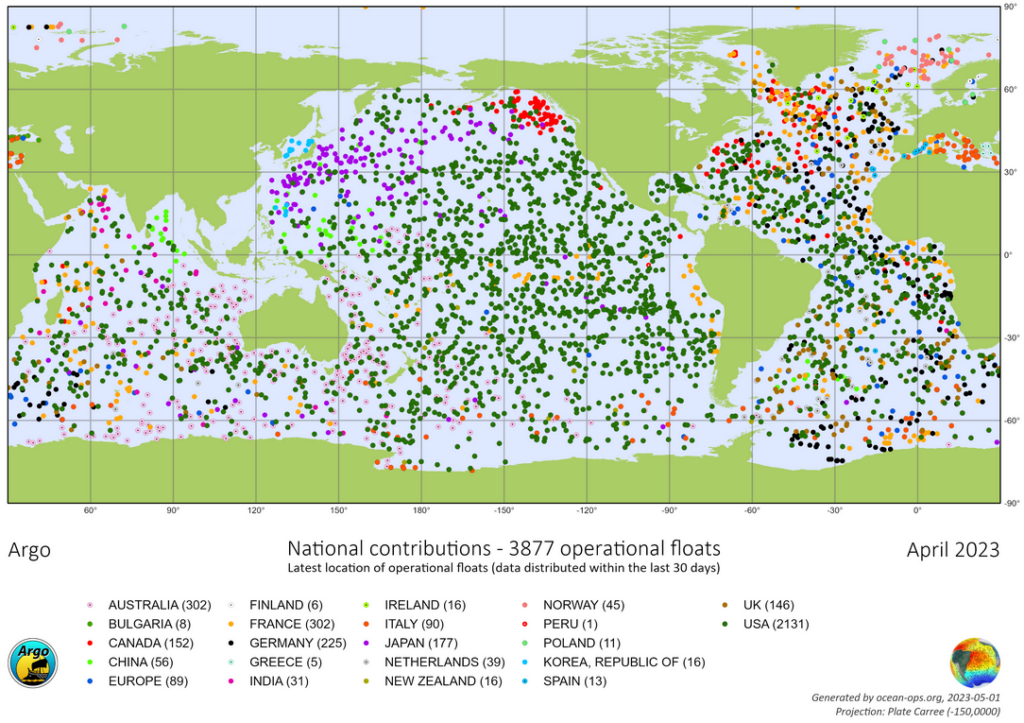
Where the climate record is concerned, From the beginning of the satellite era, our oceanic temperature record is very good indeed, and not just because satellite remote sensing measures virtually every square degree of most of the globe every day, but the satellites’ measurements are calibrated every day against the ‘ground truth’ measurements from many hundreds of Argo floats surfacing each day from their 9-10 days probing the ocean depths. The graphic below shows the physical locations sampled by Argo floats over the previous month. Added to these are more detailed measurements collected by fleets of oceanographic ships and a few special moored buoys that continuously record measurements from the ocean surface to the abyssal ocean bottom.

Supercomputers amalgamate the raw input data and assemble the kinds of human readable outputs that you and I can understand at a glance. Thanks to the exponential growth of measuring technologies and data processing power the accuracy and detail of our scientific understanding of climate and weather extends far beyond anything we could know in past decades.


How is all the additional heat in the warming ocean likely to affect the planet we live on?

Melting ice

As the atmosphere and oceans absorb more solar energy, some of this excess energy will inevitably be absorbed melting ice in the cooler regions of the planet where ice has existed more-or-less in an equilibrium state, e.g., in the form of glaciers, ice sheets, and sea ice. The energy drives the equilibrium states towards more water and less ice.

One very obvious measure of ice melting is the rapidly shrinking area of the Earth’s surface covered by sea ice around the N and S Poles. Since the beginning of the satellite era this has been able to be measured accurately. The Australian Antarctic Program Partnership and the ARC Australian Centre for Excellence in Antarctic Science’s 2023 Science Briefing: On Thin Ice explains what is happening around our local polar ocean

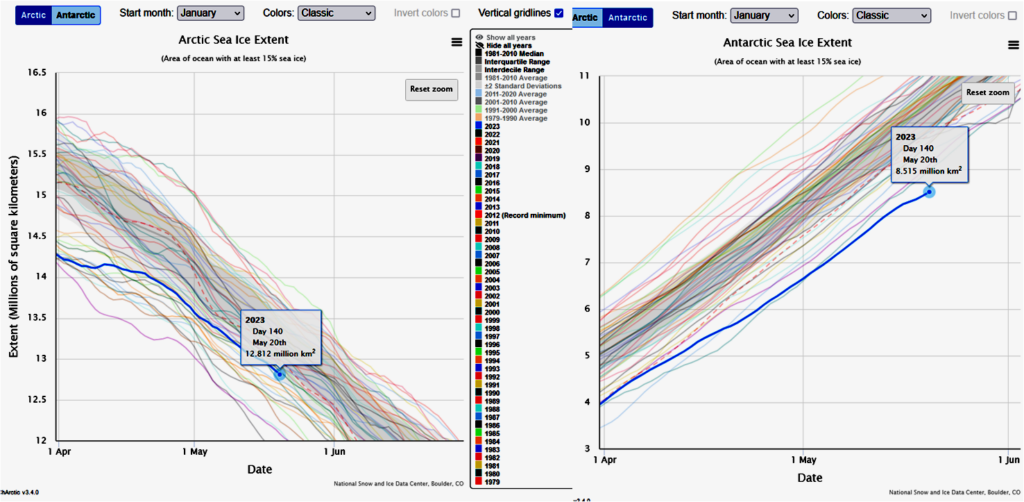
The graphics below show the daily extents of sea ice over both polar oceans since the beginning of the satellite era in 1979 as plotted by the US National Snow and Ice Data Center‘s interactive Charctic application.

Record minimums or maximums are updated annually. Therefore, a newly-set record may not be reflected in the chart until after the annual update.
View additional years by clicking the dates in the legend.
Roll your cursor over the line to see daily sea ice extent values.
Zoom in to any area on the chart by clicking and dragging your mouse.
To see a corresponding daily sea ice concentration image, click on a line in the chart. Sea ice extent is derived from sea ice concentration. Images are not available for the average or standard deviation.
When reusing Charctic images or data, please credit “National Snow and Ice Data Center.”
Currently, some functions do not work in Internet Explorer. We recommend using a different browser.
For more information about the data, see About Charctic data.
If you have questions or problems, please contact NSIDC User Services at [email protected].

What is currently happening in the Antarctic Ocean is also freakish and worrisome!

Rising sea levels

Of course, all the melt water released by melting ice has to go somewhere — i.e., adding to the volume of the World Ocean. As this wasn’t enough, as water warms it also expands to raise the sea levels even more. The graph below from the EU’s Copernicus Climate Change Service, plots the rising tide of the swelling ocean since 1993 through June 2022. The US National Oceanic and Atmospheric Administration’s Climate.Gov site’s Climate Change: Global Sea Level also plots the rise, and considers its implications in more detail.

The Conversation’s May 17 article, Global warming to bring record hot year by 2028 – probably our first above 1.5°C limit, looks at these facts and warns us that the time to act is NOW! CSIRO’s State of the Climate/Oceans covers most of the trends I have discussed here and more…

Daily change in global mean sea level, as measured by satellite altimetry, from January 1993 to June 2022 (solid line), the associated uncertainty at 90% confidence level (shading) and the trend (dashed line). The data have been adjusted for glacial isostatic adjustment and have been corrected for the TOPEX-A instrumental drift during 1993–1998. Data source: CMEMS Ocean Monitoring Indicator based on the C3S sea level product. Credit: C3S/ECMWF/CMEMS. 
https://climate.copernicus.eu/climate-indicators/sea-level

Help! We’re sliding down the slope to Earth’s Hothouse Hell! Sound the sirens and mobilize for WW III against global warming and the existential climate crisis!


As is usual for the UN’s climate pronouncements driven by the UN’s IPCC findings that absolutely establish the dangers we face from global warming/heating, even this klaxon warning understates and downplays the magnitude of the crisis we face.

If we fail to mobilize genuinely effective action over the next decade to stop and reverse the warming crisis, our families will have their lives shortened due to increasing climate catastrophes and we will have condemned our entire species to death in Earth’s 6th global mass extinction within a century or two. We don’t have time to take more election cycles to elect new governments. Our existing governments must wake up, smell the smoke, and immediately begin acting to put out the fire before it destroys us all. If you are in government, read Guterres’ message in mind. YOU must act now!

Press Release

SG/SM/21799

16 May 2023

Planet Hurtling towards Hell of Global Heating, Secretary-General Warns Austrian World Summit, Urging Immediate Emissions Cuts, Fair Climate Funding

Following is the text of UN Secretary-General António Guterres’ video message to the seventh Austrian World Summit, in Vienna today:

I thank the Austrian Government and Arnold Schwarzenegger for this opportunity.  The climate crisis can feel overwhelming.  Disasters and dangers are already mounting, with the poor and marginalized suffering the most, as we hurtle towards the hell of 2.8°C of global heating by the end of the century.

But, amidst all this, I urge you to remember one vital fact:  limiting the rise in global temperature to 1.5°C remains possible.  That is the clear message from the Intergovernmental Panel on Climate Change (IPCC).  But, it requires a quantum leap in climate action around the world.

To achieve this, I have proposed an Acceleration Agenda.  This urges all Governments to hit fast-forward on their net-zero deadlines, in line with the principle of common but differentiated responsibilities and respective capabilities in the light of national circumstances.  It asks leaders of developed countries to commit to reaching net zero as close as possible to 2040 — as Austria has done.  And leaders in emerging economies to do so as close as possible to 2050.

The Acceleration Agenda also urges all countries to step up their climate action, now.  The road map is clear:  phasing out of coal by 2030 in OECD [Organisation for Economic Co-operation and Development] countries and 2040 in all others; net-zero electricity generation by 2035 in developed countries, and 2040 elsewhere; no more licensing or funding of new fossil-fuel projects; no more subsidizing fossil fuels; and no more fake offsets, which do nothing to cut greenhouse-gas emissions, but which are still being used to justify fossil-fuel expansion today.

We can only reach net zero if we make real and immediate emissions cuts.  If we embrace transparency and accountability.  Relying on carbon credits, shadow markets, or murky accounting means one thing:  failure.  That is why I have asked CEOs to present clear net-zero transition plans, in line with the credibility standard presented by my high-level expert group on net-zero pledges.

And the Acceleration Agenda urges business and Governments to work together to decarbonize vital sectors — from shipping, aviation and steel, to cement, aluminium and agriculture.  This should include interim targets for each sector to pave the way to net zero by 2050.

The Acceleration Agenda also calls for climate justice, including overhauling the priorities and business models of multilateral development banks, so that trillions of dollars in private finance flow to the green economy.

Developed countries must also make good on their financial commitments to developing countries.  And they must operationalize the loss and damage fund, and replenish the Green Climate Fund.  I commend Austria for increasing its pledge to the Green Climate Fund by 23 per cent and urge others to deliver their fair share.

On climate, we have all the tools we need to get the job done. But, if we waste time, we will be out of time.  Let’s accelerate action, now.  Thank you.

Featured Image

Note that about half the surface of Earth’s Ocean is a good 2 °C hotter than the baseline average temperature for this day of the year

Views expressed in this post are those of its author(s), not necessarily all Vote Climate One members.

Utter insanity: they’ll outlaw gravity next

As if a planetary system is going to pay an iota of attention to what Iowa thinks. New law says state regulations must ignore climate change!

The only people who will suffer will be those harmed by and dying from increasingly extreme weather events as a consequence of global warming from the fossil fuel industry’s continued contributions to Earth’s greenhouse layer.

Blind stupidity driven by boundless greed! You have to read the article to understand just how stupid and greedy some American legislators can be…

Views expressed in this post are those of its author(s), not necessarily all Vote Climate One members.

Puppet politics: Majority governments work for themselves

Labor puppets will work to benefit fossil fuel industries’ continued hyper-profitable exploitation come hothouse hell or high water flooding! How do we know this?

In the feature article here, Fake Reform: Jim Chalmers’ itsy-bitsy tax “hit” is a gift for foreign fossil fuel giants, Michael West Media compares the Australian experience with fossil fuel exploitation with the way Norway has managed their resources.

Gas giants are grinning too. Image: Jim Chalmers, AAP / from the article

Michael West – 07/05/2023, Michael West Media

Fake Reform: Jim Chalmers’ itsy-bitsy tax “hit” is a gift for foreign fossil fuel giants

Jim Chalmers’ long-awaited tweaks to the PRRT are the itsy-bitsyest “reforms” about, the equivalent of recycling old Christmas presents with a fancy new bow. Michael West reports on how the Treasurer is merely returning a couple of billion in gas sector subsidies, and only for a while.

“Chalmers slaps $2.4bn tax hit on oil and gas,” cried Murdoch’s The Australian. “$2.4bn gas tax hit on energy giants,” declared the AFR. Santos chief Kevin Gallagher was nowhere to be heard with his “Soviet-style” scaremongering. Is Australia still going the way of Venezuela and Nigeria, Kevin? 

Not on your Nelly. The foreign gas giants are profiteering from Australia’s resources like there is no tomorrow, and paying pocket fluff in tax to boot. Treasurer Jim Chalmers’ long-awaited tweaks to the PRRT are itsy-bitsy, the equivalent of recycling old Christmas presents with a bright new bow, really just “up-fronting” a piddling amount of gas revenue for the next few years, a clawing back of subsidies for a while. 

You know it’s a fake “hit” when the fossil media talks it up as a “hit” but the gas lobbyists from APPEA say it gets “the balance right”. Reality is there is no balance, just ongoing pillage.

Clearly our Government is receiving or expecting to receive some kind of quid pro quo that they think will help them stay in power. Staying in power is clearly more important to the party that has the majority in government than doing whatever is necessary to stop and reverse the carbon emissions currently forcing us all down the road to hothouse hell and global mass extinction.

How else could the robber barons of the FF industries count on our Government helping them to rip off such extraordinary profits from their pillaging of so many Australian non-renewable resources?

In Michael West’s article also see the linked video, “Another year of record fossil fuel subsidies. What’s the scam?“, and the more detailed article, “A tale of two fossil superpowers: what Australia can learn from Norway“.

Following this theme a little further, see the news from Alberta, Canada, that is currently burning to a crisp. This gives some of the evidence demonstrating how FF puppetry works through its ‘influence’ on the media:

The stark reality is that the successful puppetry of the fossil fuel industry to protect and possibly even enhance next year’s earnings is driving us ever faster down the global warming road that leads to human oblivion in the 6th global mass extinction. Even if the heating doesn’t kill us directly, the die-offs of increasing numbers of keystone species, will cause whole ecosystems (including human agricultural systems) to collapse, taking our species along as well.

The weather causing the fires in Alberta today is a sign of the times:

Note: The normal progression of waves in the Jet Stream is from west to east. In this time series, the Jet Stream is so disordered that the eddy is actually moving the heat dome from east to west!

What we are seeing here is the operation of a positive feedback look driven by increasing global temperatures. As the Arctic grows warmer, temperature differences driving the jet streams diminish. This change allows the streams separating frigid polar air from much temperate zone air to slow and meander both far north and south of their normal paths. As demonstrated above, this is how the monster heat dome causing the Alberta fires formed. Amongst other things, slow overall warming accompanied by periodic heatwaves like this over most of the world’s boreal forests has allowed bark beetles, normally killed off every year by winter freezing, to proliferate to the point that they are killing vast numbers of trees. This increases the forests’ vulnerabilities to fires and the ferocity of the fires themselves. Not only does this turn the carbon content of the trees into greenhouse gases, but the fires are often hot enough to ignite the peaty soil to release that carbon as greenhouse gases as well.

The feedback loop is further extended as underlying permafrost exposed by burning off of the insulating layers of vegetation and peat begins to release the vast accumulations of greenhouse gases held as icy gas hydrates.

In sum, fossil fuel interests have convinced (1) our government to protect and even extend fossil fuel’s profits from producing and burning Earth’s carbon stores into energy and greenhouse gases, and (2) our press from advertising the facts of this pillage to the people whose futures will be destroyed by the consequent global warming.

Governments controlled by political parties in majority are easy targets for special interests, especially when the parties operate on the basis that the only issue that matters is to retain control of the government. They will represent the special interests of any person/group/industry they think can help them keep that control before the interests of the people in their electorates or people in general.

To mobilize and coordinate the necessary forces to turn off the downhill road to Earth’s Hothouse Hell, our governments need to work for us humans, not vested interests:

  1. we need to convince our elected and candidate representatives that we will absolutely not vote for them if they put a vested interest before our interests;
  2. that we need to elect enough independents from our own communities who will represent us to ensure that no major political party can form a majority government in its own right.

Item 2 ensures that community interests can veto legislation favoring special interests put up by the party in power.


Featured Image:

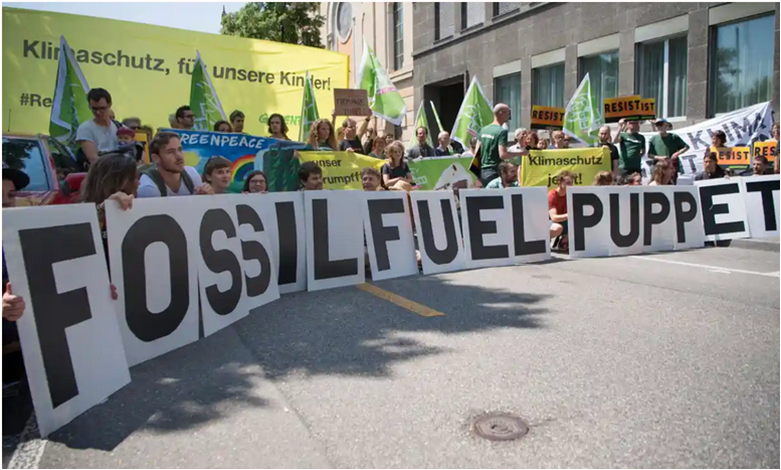
A protest against the US government’s decision to exit the Paris climate deal in 2017. ‘Ignorance-building strategies’ by fossil fuel companies have bred climate change scepticism among conservatives in the US and Australia. Photograph: Anthony Anex/EPA | from the Guardian article by Graham Readfearn (08/05/2018), “It’s all about vested interests’: untangling conspiracy, conservatism and climate scepticism“)

Views expressed in this post are those of its author(s), not necessarily all Vote Climate One members.

Meteorologists report weather – they don’t make it!

Meteorologists are being threatened and abused for forecasting and reporting record high temperatures and weather extremes.

Last week Spain recorded the highest April temperature on record (38.8 °C) following on from last year, 2022, its hottest year since records began.

Nearly 75 percent of Spain is susceptible to desertification due to climate change. Water reservoirs are at half their capacity and farmers unions say 60 percent of agricultural land is “suffocating” from lack of rain. Spain has asked Brussels to help by activating the EU’s agriculture crisis reserve funds (when many other areas of Europe are also suffering from drought).

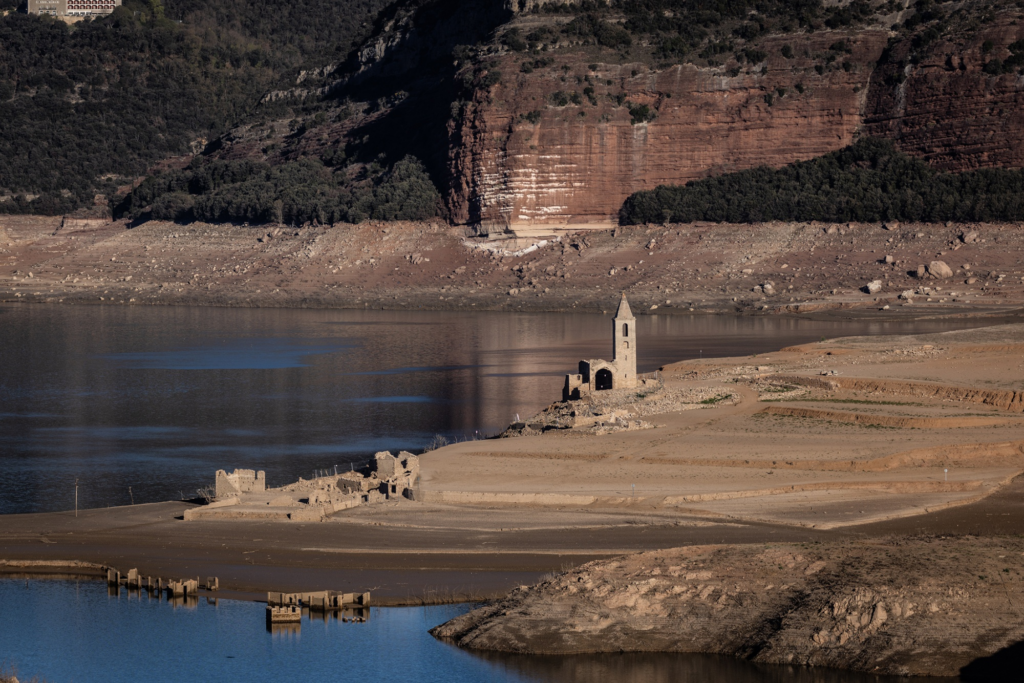
Long drowned villages emerging from bottoms of desiccating reservoirs: The ruins of the Sant Romà church, exposed due to historically low water levels in the Sau reservoir, Spain in April. Photographer: Angel Garcia/Bloomberg

AFP – Agence France Presse – 05/05/2023, Barron’s

Insults, Threats Target Spain Forecasters Over Climate ‘Conspiracy’

Spain’s government on Friday came to the defence of the AEMET weather agency, which has suffered threats and abuse from climate conspiracy theorists over its forecasts during a record drought.

“Murderers”, “Criminals”, “You’ll pay for this” and “We’re watching you” are just some of the anonymous messages sent to AEMET in recent weeks on social media, by email and even by phone.

The threats were responding to forecasts and reports published by AEMET, notably over last week’s early heatwave, when Spain registered its hottest-ever temperature for April, reaching 38.8 degrees Celsius (101.8 degrees Fahrenheit) in Cordoba.

Read the complete article…

Drought → crop failures → famine?

Where the European/Mediterranean region is concerned, Spain is not the only country facing water crises. Even before the end of winter, the Guardian’s article of 4 March, ‘Very precarious’: Europe faces growing water crisis as winter drought worsens, Austria, Germany, France, Italy and Switzerland were all suffering problems from shortages of rain and runoff from the small amount of accumulated winter snow.

Australia has already lost a lot of agricultural productivity because of three years of La Niña flooding. For several months we couldn’t even buy frozen french fries (shades of the Irish Potato Famine). This may well be followed by even more damaging droughts when the next major El Niño surpasses the last two to reach 1.5 °C above the pre-industrial baseline, as seems likely given past trends.

As a target for those with an often visceral distrust of the established science of human-caused global heating, the Bureau of Meteorology’s temperature record might be seen as ground zero. Photograph: Bill Bachman/Alamy / from the article.

Graham Readfearn – 7/05/2023, The Guardian

Climate scientists first laughed at a ‘bizarre’ campaign against the BoM – then came the harassment

Former Bureau of Meteorology staff say claims they deliberately manipulated data to make warming seem worse are being fed by a ‘fever swamp’ of climate denial.

For more than a decade, climate science deniers, rightwing politicians and sections of the Murdoch media have waged a campaign to undermine the legitimacy of the Bureau of Meteorology’s temperature records.

Those records say Australia has warmed by 1.4C since 1910, the year when the bureau’s main quality-controlled climate dataset starts.

Extremely hot days come along more often than they used to, and the warming trends are happening everywhere, at all times of the year.

As a target for those with an often visceral distrust of the established science of human-caused global heating, the bureau’s temperature record might be seen as ground zero.

“This has frankly been a concerted campaign,” says climate scientist Dr Ailie Gallant, of Monash University. “But this is not about genuine scepticism. It is harassment and blatant misinformation that has been perpetuated.”

Read the complete article….

Attacking messengers because you dislike or fear the messages only impedes circulating knowledge that might help to solve real-world problems and save your life or the lives of your family members. That global warming causes record temperatures and droughts is a fact that causes problems…. Denying the fact does not make the problems go away! It only keeps the problem from being solved until it is too late to do anything effective.

When there are too many crop failures over too wide an area for too long, famine is the consequence, and can lead to. Continuing famine leads to starvation and, eventually, mass deaths.


Featured Image:

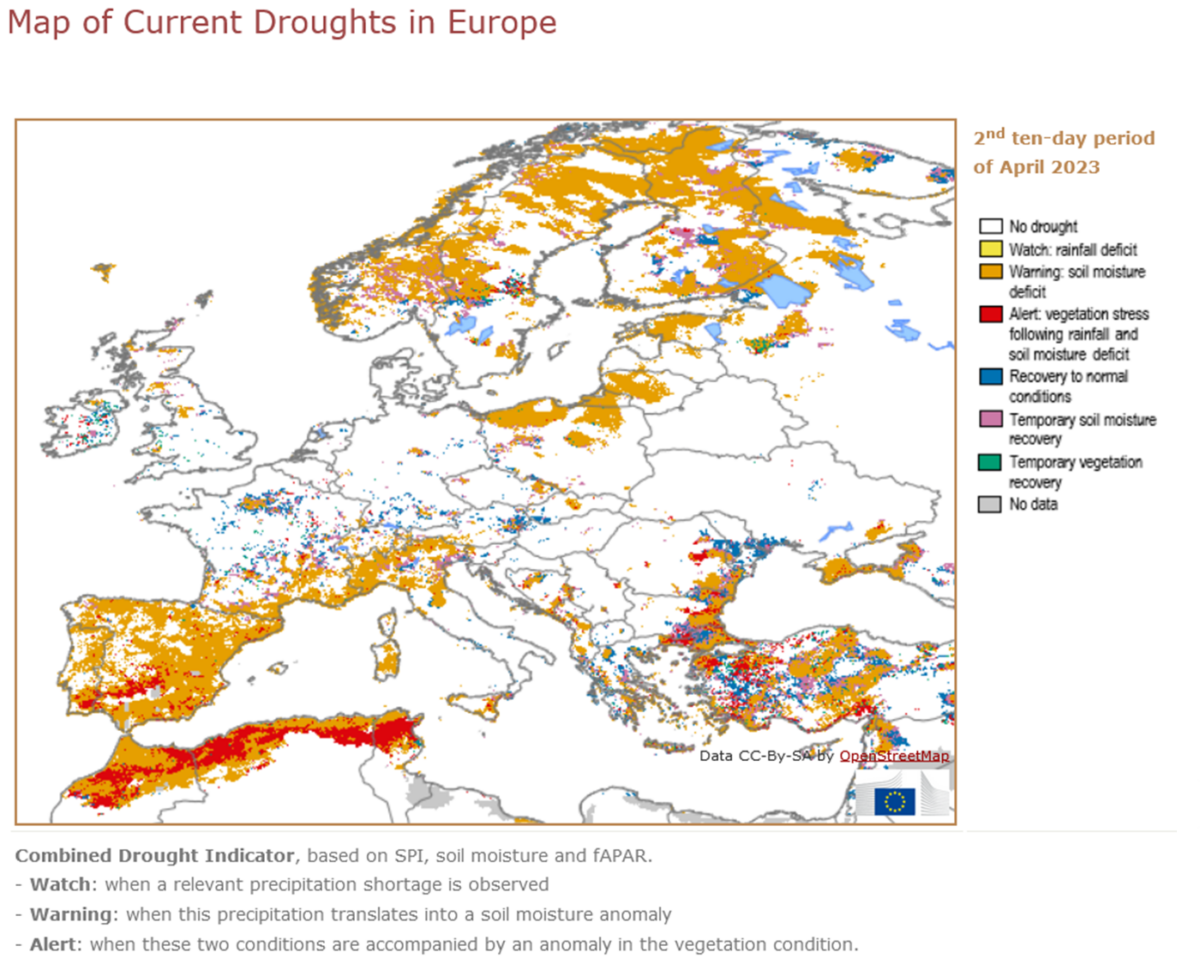
Situation of Combined Drought Indicator in Europe – 2nd ten-day period of April 2023 from Copernicus’s EDO – European Drought Observatory

Views expressed in this post are those of its author(s), not necessarily all Vote Climate One members.

Updating IPCC AR6: still bound for catastrophe

International group of climatologists launch a set of annually updated climate indicators to track human induced global warming through time.

This decade is absolutely critical for climate action if we are to avoid climate catastrophe. However, up to now we have lacked a standardized set of measures of the level of human-induced warming for tracking our progress over times as short as a year.

So far, the gold standard against which progress can be measured has been the IPCC’s cycle of Assessment Reports (e.g., the latest being AR6, completed this year). These have been published on cycle times of 6 to 7 years.

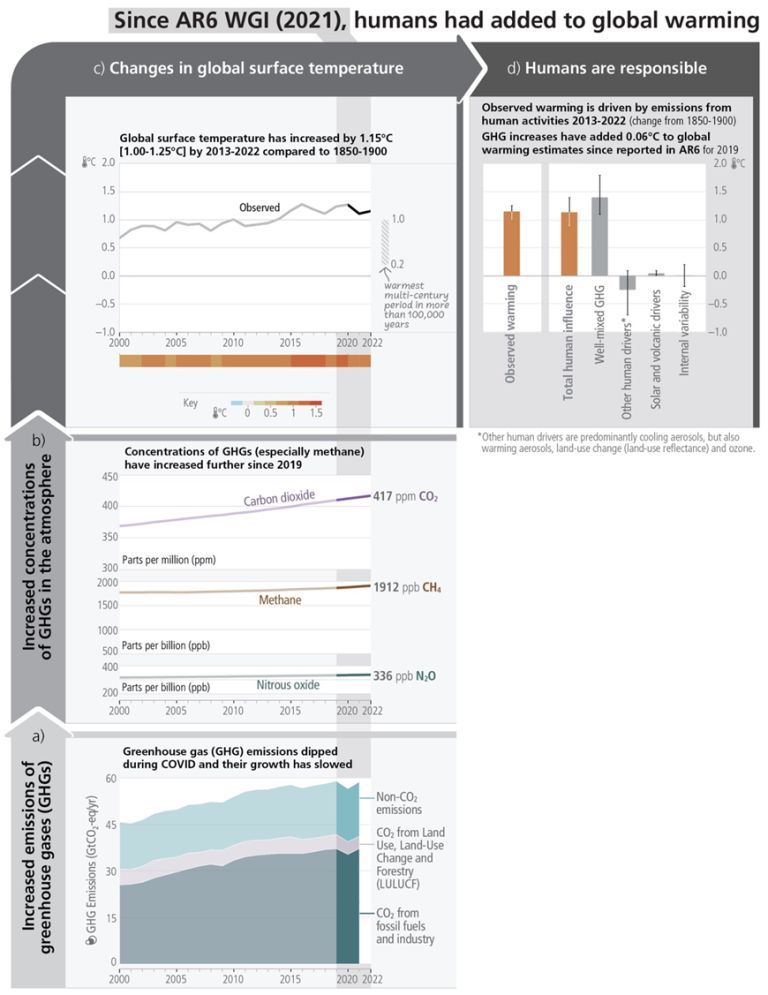
A team of 50 authors from major climate science institutes and universities around the world under lead author, Piers Maxwell Forster of the Priestly Centre University of Leeds, have set out to publish annually updated reliable global climate indicators in the public domain. This is based on the assessment methods used in the IPCC Sixth Assessment Report (AR6) Working Group One (WGI) report, to update the monitoring datasets and to produce updated estimates for key climate indicators. These include emissions, greenhouse gas concentrations, radiative forcing, surface temperature changes, the Earth’s energy imbalance, warming attributed to human activities, the remaining carbon budget and estimates of global temperature extremes. As these measurements are traceable and consistent with IPCC report methods, they can be trusted by all parties involved in UNFCCC negotiations and help convey wider understanding of the latest knowledge of the climate system and its direction of travel.

The preprint of their first update, Indicators of Global Climate Change 2022: Annual update of large-scale indicators of the state of the climate system and the human influence, was submitted for review (open for discussion on 05/05/2023) to the Copernicus journal Earth Systems Science Data.

Although still unreviewed, this work certainly provides the most up to date data on our progress towards reversing global warming while that might still be possible.

The news is bad. Although there are a few improvements in isolation, nothing we have done through the end of 2022 has been enough to perceptibly the rate of global warming.

Piers Maxwell Forster, et al. – 02/05/2023, Earth System Science Data

Indicators of Global Climate Change 2022: Annual update of largescale indicators of the state of the climate system and the human influence

Abstract. Intergovernmental Panel on Climate Change (IPCC) assessments are the trusted source of scientific evidence for climate negotiations taking place under the United Nations Framework Convention on Climate Change (UNFCCC), including the first global stocktake under the Paris Agreement that will conclude at COP28 in December 2023. Evidence-based decision making needs to be informed by up-to-date and timely information on key indicators of the state of the climate system and of the human influence on the global climate system. However, successive IPCC reports are published at intervals of 5–10 years, creating potential for an information gap between report cycles.

We base this update on the assessment methods used in the IPCC Sixth Assessment Report (AR6) Working Group One (WGI) report, updating the monitoring datasets and to produce updated estimates for key climate indicators including emissions, greenhouse gas concentrations, radiative forcing, surface temperature changes, the Earth’s energy imbalance, warming attributed to human activities, the remaining carbon budget and estimates of global temperature extremes. The purpose of this effort, grounded in an open data, open science approach, is to make annually updated reliable global climate indicators available in the public domain (https://doi.org/10.5281/zenodo.7883758, Smith et al., 2023). As they are traceable and consistent with IPCC report methods, they can be trusted by all parties involved in UNFCCC negotiations and help convey wider understanding of the latest knowledge of the climate system and its direction of travel.

The indicators show that human induced warming reached 1.14 [0.9 to 1.4] °C over the 2013–2022 period and 1.26 [1.0 to 1.6] °C in 2022. Human induced warming is increasing at an unprecedented rate of over 0.2 °C per decade. This high rate of warming is caused by a combination of greenhouse gas emissions being at an all-time high of 57 ± 5.6 GtCO2e over the last decade, as well as reductions in the strength of aerosol cooling. Despite this, there are signs that emission levels are starting to stabilise, and we can hope that a continued series of these annual updates might track a real-world change of direction for the climate over this critical decade.

Read the complete article….

Some of the observations:

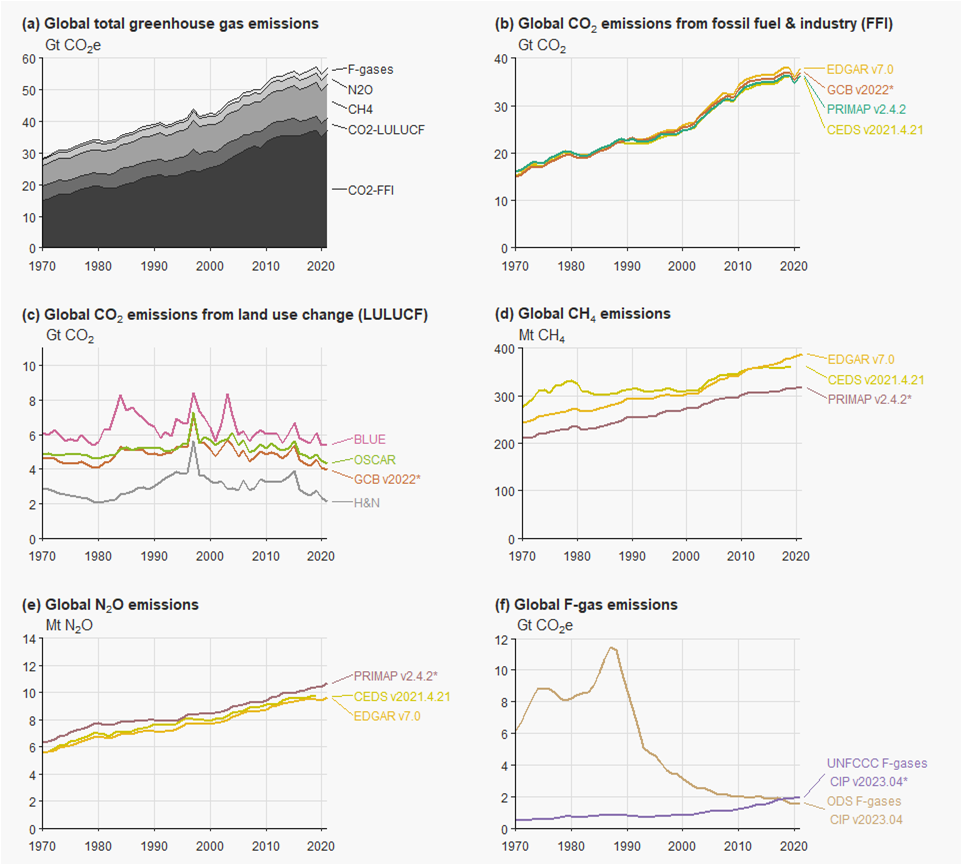
The first set of observations shows that most human carbon emissions have not slowed, although, although the slowing economy over COVID have somewhat slowed overall growth (although this appears to have resumed in 2022). The only area where have actually significantly slowed emissions is for regulated fluorinated gases (F-gas).

Figure 1: Annual global anthropogenic greenhouse gas emissions by source, 1970-2021. Refer to Sect. 2.1 for a list of datasets. Starred datasets (*) indicate the sources used to compile global total greenhouse gas emissions in panel a. CO2 equivalent emissions in panels a and f are calculated using GWPs with a 100-year time horizon from the AR6 WGI Chapter 7 (Forster et al., 2021). F-gas emissions in panel a comprise only UNFCCC F-gas emissions (see Sect. 2.1 for a list of species). Not shown in panels d and e are biomass combustion emissions from GFED (Van Der Werf 2017), which are included in the aggregate estimate in panel a.

The next set of figures shows how effective the various gases in greenhouse layer in the atmosphere are at capturing solar radiation (i.e., “effective radiation forcing”). In 2a right facing bars represent a net positive forcing of higher temperatures, while the left facing bars represent the reflection of extra energy away from Earth. 2b shows a fairly abrupt increase in the forcing between 1960 and 1970, presumably due to the increasing annual rates of greenhouse gas emissions. Note: if the Earth is to have any chance to begin cooling the anthropogenic forcing (grey) needs to trend down, not to continue rising higher as it does here!

Figure 2: Effective radiative forcing from 1750-2022. (a) 1750-2022 change in ERF, showing best estimates (bars) and 5-95% uncertainty ranges (lines) from major anthropogenic components to ERF, total anthropogenic ERF, and solar 610 forcing.
Figure 2: Effective radiative forcing from 1750-2022.  (b) Time evolution of ERF from 1750 to 2022. Best estimates from major anthropogenic categories are shown along with solar and volcanic forcing (thin coloured lines), total (thin black line) and anthropogenic total (thick black line). 5-95% uncertainty in the anthropogenic forcing is shown in shaded grey. Note solar forcing in 2022 is a single-year estimate.

Because Earth currently suffers an imbalance between the solar energy it receives and what it radiates away to outer space as heat energy, the difference between energy received and energy radiated is stored as heat by raising the temperature of various components of planet’s mass (i.e., as the heat inventory). Figure 3a shows that the vast bulk is being stored at different water levels in the ocean, with virtually all of the remained represented by melted ice and the surface layer of soil. Again, if we are to even begin to reduce the rate of global warming, the graph of energy change must be changed to a down slope rather than the continuously rising one show here.

Figure 3b compares the IPCC’s estimates with the somewhat higher estimates presented in this paper.

Conclusion

There is absolutely no good news in the vast array of evidence assembled into these few graphs (assuming the work stands up to peer review, which it almost certainly will). Nothing humans have done to date has had a visible impact on the ominous trends into the climate crisis of the 6th global mass extinction in a ‘Hothouse Earth’ that will simply be too hot for many keystone species to survive physiologically. Beginning with Steffen et al’s, “Trajectories of the Earth System in the Anthropocene” and “Tripping down the road to Earth’s Hothouse Hell and Global Mass Extinction“, a series of articles in Climate Sentinel News explains that falling into the hothouse hell will be as easy as falling off a cliff.

As noted herein above, if we are to get off that road to Hell before it is too steep for that to be possible, we basically have to turn the graphs shown above upside down, so the trends are back towards where they were in the first half of the last century. We won’t be able to do this as long as our governments continue protecting and subsidizing the fossil fuel industries that are still making things worse from one year to the next. Basically our governments will have to work together and mobilize a global war against the climate emergency. Individually, as is the case in global war, we’ll probably have to accept rationing of critical or polluting resources and some curtailment of our usual freedoms to make things worse….

It will be hard, but consider this: It took us more about 100 years from beginning in 1927 with 2 bn people and steampunk technology to accidentally warm the planet to its present state. Starting now, with 2023’s highly advanced and incredibly more powerful technologies and scientific knowledge, we should be able cool the planet back to a sustainable temperature.

The first step has to be fixing our political systems so they work for all humans rather than working to make a few vested special interests become insanely wealthy and powerful individuals at the expense of the planetary biosphere.


Featured Image:

Summary from the Copernicus ESDD article bringing reported values from IPCC AR6 report up to date at the end of 2022. The causal chain from emissions to resulting warming of the climate system. Emissions of GHG have 1190 increased rapidly over recent decades (panel a). These emissions have led to increases in the atmospheric concentrations of several GHGs including the three major well-mixed GHGs (panel b). The global surface temperature (shown as annual anomalies from an 1850–1900 baseline) has increased by around 1.15°C since 1850–1900 (panel c). The human-induced warming estimate is a close match to the observed warming (panel d). Whiskers show 5% to 95% ranges. Figure is modified from AR6 SYR (Figure 2.1, Lee et al., 2023).

Views expressed in this post are those of its author(s), not necessarily all Vote Climate One members.

Bad news for whales and oceanic carbon capture

Warming oceans are bad news for twilight zone organisms carrying captured carbon into the abyss when they die (and whales eat).

An observation

A Hula Skirt Siphonophore (cnidarian) a ‘twilight zone’ inhabitant – via BBC News Climate and Society
Bristlemouth fish
Bristlemouth, the commonest kind of fish on Earth mops up smaller creatures in the twilight zones of Earth’s oceans. / NOAA / Ocean Explorer

Maddie Molloy – 03/05/2023, BBC News Climate and Society

Climate change: life in ocean ‘twilight zone’ at risk from warming

Climate change could dramatically reduce life in the deepest parts of our oceans that are reached by sunlight, scientists warn.

Global warming could curtail life in the so-called twilight zone by as much as 40% by the end of the century, according to new research.

The twilight zone lies between 200m (656ft) and 1,000m (3,281ft).

It teems with life but was home to fewer organisms during warmer periods of Earth’s history, researchers found.

Read the complete article….

How warming works in the twilight zone

Closeup of long chain of Salp zooids (tunicate / feeds on phytoplankton). Photo by Larry Madin, Woods Hole Oceanographic Institution
Confetti squid. Photo by Paul Caiger, Woods Hole Oceanographic Institution.
Bobtail squid (order Sepiolida) are a group of cephalopods closely related to cuttlefish. Bobtail squid tend to have a rounder mantle than cuttlefish and have no cuttlebone. Photo by Paul Caiger, Woods Hole Oceanographic Institution.

Ocean Twilight ZoneWoods Hole Oceanographic Institution, 04/05/2023

Why is it so important to understand life in the ocean twilight zone?

How much life is in the ocean twilight zone?

The twilight zone is home to more fish than the rest of the ocean combined. Most of these fish—and other organisms that live in the zone—are tiny, measuring just a few inches long or less. But some, like gelatinous siphonophores, can form chains that extend as much as 130 feet, making them among the biggest animals on Earth. Even the smallest twilight zone inhabitants can be powerful through sheer number, however. A tiny but fierce-looking fish called a bristlemouth is the most abundant vertebrate on the planet—for every one human, there are more than 100,000 bristlemouths. 

How does life in the twilight zone affect global climate?

By migrating to and from the surface, eating, being eaten, dying—and even by pooping—organisms in the twilight zone transport huge amounts of carbon from surface waters into the deep ocean. That process, called the biological pump, plays an important role in regulating Earth’s climate.

Read the complete article….

The science behind the observations

Katherin A. Chriton, et al. – 27/04/2023, Nature Communications

What the geological past can tell us about the future of the ocean’s twilight zone

Abstract: Paleontological reconstructions of plankton community structure during warm periods of the Cenozoic (last 66 million years) reveal that deep-dwelling ‘twilight zone’ (200–1000 m) plankton were less abundant and diverse, and lived much closer to the surface, than in colder, more recent climates. We suggest that this is a consequence of temperature’s role in controlling the rate that sinking organic matter is broken down and metabolized by bacteria, a process that occurs faster at warmer temperatures. In a warmer ocean, a smaller fraction of organic matter reaches the ocean interior, affecting food supply and dissolved oxygen availability at depth. Using an Earth system model that has been evaluated against paleo observations, we illustrate how anthropogenic warming may impact future carbon cycling and twilight zone ecology. Our findings suggest that significant changes are already underway, and without strong emissions mitigation, widespread ecological disruption in the twilight zone is likely by 2100, with effects spanning millennia thereafter. [my emphasis]

Read the complete article….

Why is all this important to know?

Ocean fertilization to stimulate algal growth over the surface of the abyssal ocean offers a means to capture CO₂. A food chain of pelagic consumers ranging from the twilight creatures harvesting the algae and their larger predators up to whales can then capture and package the carbon capturing algae into a range of parcels from fecal pellets to dead whales that will drop to the ocean floor.

The nature of biological systems is that they are self-reproducing and can grow exponentially under suitable conditions. ‘farming’ these consumers to optimize the carbon capture and transport it to the bottom is something that might realistically have the capacity to actually reduce atmospheric CO₂ on a fast enough timescale to slow, stop and reverse global warming.

However, the articles above show that a warming ocean substantially reduces the viability of the twilight organisms that provide the packaging service. Thus, if we don’t implement this biological sink before significantly more warming occurs, this opportunity to reverse the warming process may be lost.

Featured image: Antarctic krill Euphausia superba (copyright Uwe Kils, Institute of Marine and Coastal Sciences, RUTGERS University). Along with bristlemouth fish, krill are major components in the food chain of the twilight zone’s biological carbon pump potentially sequestering carbon in the abyssal depths of the world’s oceans. The world oceans’ surfaces, away from the shallows, are comparatively sterile because the water lacks micro nutrients (e.g., iron, manganese) required to support phytoplankton. Thus, vast areas of the oceans lack effective biological pumps to sequester carbon. Fertilizing these sterile areas of the oceans with trace nutrients and farming the twilight zone (i.e., seeding with appropriate species to provide the biological pumping mechanism) may establish a sufficiently extensive mechanism to sequester globally significant amounts of carbon in the abyssal depths.

.

Views expressed in this post are those of its author(s), not necessarily all Vote Climate One members.

Political revolution has begun in Australia!

The climate emergency needs a revolution: from governments supporting dogmas and special interests to supporting citizens.

Vote Climate One is working to inform Australians of the scientific facts relating to the ever growing climate emergency and what can be done politically to ensure that our governments actively join the battle to solve the emergency. We hope this will help drive a political revolution enabling this to happen.

Due to humans’ alteration of Earth’s atmosphere, the physical world we live in is generating a climate emergency

Scientific evidence shows this is the case

Black Summer fire illustrates need for political revolution in Australia
This image of a burning home in Lake Conjola in New South Wales, Australia, was taken in the middle of the day on New Year’s Eve. Credit…Matthew Abbott for The New York Times. Our Black Summer Bushfires should be more than enough to convince every Australian that we are facing a very real and very dangerous climate emergency.

Where scientifically validated facts are concerned, two weeks ago on the 20th of March the United Nations’ Intergovernmental Panel on Climate Change (IPCC) controlled by 195 nations of the world forming the World Meteorological Organization (WMO) published their dire forecast for our future climate. This report’s Summary for Policy Makers was signed off by the delegated representatives of every one of the WMO member nations. This summary report crossing many different scientific disciplines concludes some 6 years of some of the most stringently peer-reviewed scientific research ever published. In other words, the forecast is based on a vast array of solid and tested evidence, not just anecdotes and beliefs.

For a more detailed presentation of the IPCC’s research and writing process see Politics vs physical dangers and real death and Some fundamental issues relating to the science underlying climate policy: The IPCC and COP26 couldn’t help but get it wrong. The second article explains why the IPCC cannot avoid downplaying the extent and magnitude of the consequences from continuing global warming.

In other words, where the IPCC says our future is dire if we don’t stop global warming, the actual reality is likely to be even worse, i.e., involving social collapse and even possible/likely human extinction within a century or two. Hence, our warning on Vote Climate One’s cover page:

The reality we face

Humans triggered the climate emergency over a little more than 100 years. In this geological instant of time we burned prodigious quantities of safely sequestered fossil carbon accumulated over millions of years to produce and release the greenhouse gas CO₂ and, even more potent greenhouse gases into the atmosphere. This was done more-or-less accidentally with the invention of primitive, Victorian era-based steam- technologies. However, even the low tech used and applied by billions of people significantly changed the composition of an entire planet’s worth of atmosphere so it traps more solar energy to significantly warm the whole planet. Today, we are continuing to dump still more greenhouse gases into the atmosphere, heating the planet even more.

Given that humans only took a century to accidentally create the climate emergency using steampunk technology, surely, by working together and using our most up to date science and technologies, we should be able to solve the emergency. Unfortunately dogma and selfish greed promoted by special interests controlling the planet’s resources are working against stopping greenhouse gas emitting activities. This, unavoidably, becomes fraught with politics: internationally, nationally, state, and even at local council levels. Political revolutions will be required at all levels to favor climate action.

Before we can work together to solve the climate emergency in the physical world, we must revolutionize our current political world working to protect special interests by keeping us divided

Puppet governments

Where politics is concerned, for several decades at least, Australian Governments (federal, state, and even many local councils) have governed primarily to serve entrenched party-political dogmas and vested special interests. Parliamentary parties have worked to impose their dogmas on the nation’s citizens rather than listening to them. Special interests influencing the governments include multinational companies in the resource and fossil fuel industries, super-wealthy individuals, land-developers and religious groupings. Parties (and party discipline) tends to support the interests who support their campaigns and provide them with favorable media. Our Climate Sentinel News article provides a case study of Liberal government in NSW: Is Premier Perrottet a far-right puppet, or the puppet master?

Unfortunately, the uncoordinated actions of people alone, no matter how well motivated, cannot possibly organize, marshal, and control all the resources and technologies needed for effective action on the climate emergency. This requires the tools of and coordination by government. Effective action to stop global warming requires stopping industrial carbon emissions. This just isn’t going to happen as long as puppet governments guided by fossil fuel industries continue subsidizing their puppet masters and jailing protesters campaigning to stop emissions. Several Climate Sentinel News posts document such cases under the search term “puppet master“.

Revolutionary political change is the solution

Vote Climate One concludes that the critical first steps in mobilizing effective climate action must be to: (1) inform citizens of the genuine reality of the climate crisis (i.e., via Climate Sentinel News); and (2) provide knowledge and tools to influence or replace parliamentary puppets of the special interests with MPs who will place citizens’ interests first (i.e., “Traffic Light Voting” and “Voting Guides“).

In other words, we aim to facilitate fundamental political revolutions in Australian parliaments: From ‘democracies’ guided by the greed of large special interests for profits and power; To a genuine democracies representing their citizens and being concerned with their health and well being.

In Australia’s political environment we think the best governments will be Labor in a minority (with labor more progressive than the usual opposition parties) where Greens and a diversity of greenish community independents hold the balance of power to prevent Labor from catering to vested interests.

This revolution has begun! Current state of the political revolution in Australia

Australian Parliament

In last year’s Federal election, the COALition majority government was decimated: replaced by a Labor government with a razor thin margin and a large cross bench with 14 green-light candidates.

House of Representatives Elections

COALition

Aust. Labor Party

Centre Alliance

Katter’s Australian

Australian Greens

Ind (Teal)

Ind (other)

2022

58

77

1

1

4

9

2

2019

77

68

1

1

1

3

1

-18

+11

(Sharkie)

(Katter)

+3

+6

(Gee + Dai Le)

(Majority ≥ 75): Labor 77 + Aston = 78; Red lights 61 – Aston = 60; Green lights = 15

Green lights include (Greens: 1 carryover and 3 new ones – replacing Libs in metro Brisbane) plus a swag of greenish community independents from 4 other states; Labor controls the lower house in majority but with a narrow margin. Several seats could easily go to independents in by elections.

In the 1 April (April Fool’s day!) by-election in Aston (Ferntree Gully – Rowville in eastern Melbourne), in a 6.44% swing, Labor gained another ex-safe Liberal seat. This is the first time since 1920(!) that any party in power has won a seat in a Federal by-election anywhere in Australia. Only 3 out of 32 booths in the once safely Liberal Aston had a majority of Liberal votes.

Liberals are left holding only 2 of 23 seats in Inner Metro Melbourne (Deakin and Menzies), 3 of 7 Outer Metro (Casey, LaTrobe and Flinders), and 0 of 3 Regional Metro areas (Bendigo, Ballarat, and Geelong).


Senate Elections

COALition

Aust. Labor Party

Greens

Pauline Hanson’s

Jacqui Lambie

United Australia

David Pocock

Lidia Thorpe

2022 Election

15

15

6

1

1

1

1

Total Senate 2022

31

26

11

2

2

1

1

1

Majority > 38: Labor 26; Red lights 36; Green lights 13(Labor + green lights) = 39

Where Labor has only 26 seats compared to 36 seats for the red lights, the green lights clearly hold the balance of power in the Senate. David Pocock (community independent) and Lidia Thorpe (elected as a Green) must be included along with the Greens party to give Labor a majority. David Pocock’s vote is critical in decisions where the red lights are unanimously against.

In our analysis of the results, Vote Climate One’s Traffic Light Election Guide was accessed hundreds of thousands of times during the pre poll and election day voting period – which might have helped some candidates over the line to either second place (allowing preferences to be distributed to them) to pass the 50% two party preferred winning position. In the ACT Vote Climate One funded distribution of paper versions of the Guide in a few of the suburbs — where Pocock did statistically better than in suburbs we didn’t cover. This may have been a significant component in the winning margin.

Since the Federal Election we have had state elections in Victoria and NSW.

Victorian State Parliament

The Victorian Parliament has more resistant to revolutionary change because of the many barriers to Greens, minor parties and independents crafted into the electoral laws designed to favor the major parties. Victoria allows ‘group voting tickets’ for election to the Legislative Council and secretive backroom ‘preference trading’ among the mobs. Combined with this, Victoria’s heavyweight restrictions on campaign contributions and funding gravely hamper independents and minor parties’ abilities to campaign compared to major parties’ major funding.

Legislative Assembly

The Assembly (lower house) ended up with Labor holding 56 seats, Liberals with 19, Nationals 9 (red lights = 38), and Greens 4; where a majority is < 45. None of the 120 independents or candidates from 16 minor parties won a single seat. Labor’s 11 seat majority in the lower house combined with party discipline does little to hinder autocratic government from the Labor side.

On the other hand voting for the Legislative Council turned out well for green-light candidates. MLCs serve for 4 year terms, with all seats contested in each state election.

Legislative Council

For Legislative Council Elections in Victoria, the state is divided into 8 geographically defined electoral regions, with 5 members representing each region, for a total of 40 members. Elections are determined by ‘optional preferential voting‘. Voters have a ‘single transferable vote‘, which may be used either

  • ‘above the line’, to vote one party’s group voting ticket listing all candidates for the region in the party’s preferred order, or
  • ‘below the line’, where you must number at least 5 candidates in your preferred order, and may number all candidates for the region in your preferred order. If you number less than 5 or give more than one candidate the same number this invalidates your ballot.

The use of group voting tickets enables upper house elections allows voters’ intentions to be rorted in many ways as described by Glen Druery, the ‘Preference Whisperer’. However, despite all of this, after the 2022 election, green-light MLC’s on the cross-bench with 7 votes hold the balance of power.

Victorian Legislative Council Elections

Labor

COALition

Greens

Animal Justice

Derryn Hinch’s

Fiona Patten’s

Labor DLP

Legalize Cannabis

Liberal Democrats

Pauline Hanson’s

Shooters, Fishers, F

Sustainable Aust.

Transport Matters

2022

15

14

4

1

0

0

1

2

1

1

1

0

0

2018

18

13

1

1

3

1

0

0

2

0

1

1

1

change

-3

+1

+3

-3

-1

+1

+2

-1

+1

-1

-1

Labor 15, Greens 4, Cannabis 2, Animal Justice 1 (22); vs red-lights:  Libs 8, Nat 6, Lab DLP 1, Lib Dem 1, Pauline Hanson’s One Nation 1, Shooters & Fishers 1 (18). With 21 needed for a majority in the upper house, Greens are clearly in the balance of power.

Way ahead for Victorian voters

Given that Labor is already relatively progressive on climate action, a green light majority on the cross bench may be in a position to block favorable treatment of Labor’s fossil fuel special interests, and to encourage strong action to shut down fossil fuel emissions. Victorians need to keep a close watch on their representatives and make sure via letter bombing, phone calls, and personal visits to electorate offices that they stay on the job to stop global warming!

New South Wales State Parliament

The NSW State election was held a week ago (1 April), but like Victoria the NSW’s election laws work against minor parties and independents. However, Vote Climate One may have had a bit more influence here. Liberal/Nationals were soundly defeated and Labor is in, but with a definite minority government. Labor is two short of a majority pending possible recounts. (The Liberals held the seat of Ryde by only 50 votes when the last of the postal votes were counted on 8 May).

NSW State Legislative Assembly Election

On the Labor/green-light side, Labor 45; Greens 3 (Ballina – thanks to the repeated extreme flooding events, plus Sydney electorates of Balmain & Newtown); and 3 green-light independents – one of them backed by Climate200, for a total of 51; where 47 votes are required to pass legislation.

There are also 2 orange-light incumbent independents with significant green credentials.

Note, for the count here I have reclassified Michael Regan (Wakehurst), listed orange light before the election. Due to time constraints our analysis missed his strong record of climate actions as Mayor of Northern Beaches Council and the fact that he was supported by Federal teal MPs, Zali Steggall (Warringah) and Sophie Scamps (Mackellar).

On the Lib/Nat red-light side there are 25 Libs; 11 Nationals and 4 independents (1 ex Lib and 3 ex shooters/fishers/farmers) for a total of 40.

This leaves NSW with a Labor minority government with Greens + green-light independents with a strong hold in the balance of power.

NSW State Legislative Council Election

The NSW Legislative Council has 42 members, elected by proportional representation in which the whole state is a single electorate. Members serve eight-year terms, which are staggered, with half the Council (21) being elected every four years. 22 votes are required for a majority.

From ABC News’s Legislative Council Preview – NSW Election 2023:

All registered parties are listed ‘above the line’ on the ballot paper. All candidates running in the election for a party (as listed above the line) are listed for that party in preference order below the line. Unaffiliated independent candidates are only listed below the line.

A single ‘1’ above the line is formal and counts for the chosen party but has no preferences for other parties. If they wish, a voter may show a second, third and so on preference for other parties above the line. These preferences are implied to be preferences for candidate of each group as printed on the ballot paper.

If a voter wants to re-order a party’s candidates, pick candidates from different parties, or vote for candidates in any group without a voting square above the line, they must vote ‘below the line’ by numbering boxes for candidates. Electors must complete 15 preferences below the line for a formal vote. DO NOT number a sequences that crosses the ballot paper line.

NSW Legislative Council Election

Coalition

Labor

Greens

Pauline Hanson’s

Shooters, Fishers, +

Animal Justice

Cannabis

Lib Democrats

2023 election

7

8

2

1

1

0

1

1

Total Council 2023

15

15

4

3

2

1

1

1

In the Legislative Council 22 votes form a majority, and there are now 15 Labor, 6 green lights (4 Greens, 1 AJP, 1 Cannabis), totaling 21 votes, versus 21 red light votes (Coalition 15, Pauline Hansons’s 3, SFF 2, Lib Dems 1).

Note: According to the ABC on 9/04/2023, as this is being written:

  • There are still some uncertainties in the count. Four seats are still not finalized, but are likely to be filled by a seventh Liberal member and one each representing Legalise Cannabis, the Liberal Democrats and the Shooters, Fishers and Farmers. These are included in the above table.
  • “The Legislative Council consists of 42 members. Traditionally one of the government’s members is elected President. The President only has a casting vote meaning votes are determined by the 41 members on the floor with a government needing 21 members to pass legislation. After appointing the President, Labor will have only 14 members, which means the new government will need votes from seven of the 12 crossbench members to pass legislation.”

Based on trends in the present count, only 6 on the cross bench will be green lights. In other words, Vested interests working through normally cooperative red lights in the upper house, may still have some ability to block important legislation on climate action.

Way ahead for NSW voters

Noting that the Liberal Democrats and Shooters, Fishers are farther to the right and dogmatic on energy policy and climate action than the Liberal Party, we must hope that the Liberals in the upper house will follow the lead of green lights in the lower house on climate legislation.

Voters concerned to see serious action on climate need to stay alert to what their representatives in both houses are saying and doing. Make sure they know via letter bombing, phone calls, and personal visits to electorate offices that they must stay on the job to stop global warming!

What will Vote Climate One do to help?

Insofar as our limited resources allow, we will endeavor to keep Australian voters up to date with the latest news on the still growing climate emergency (i.e., why we need action) and what our governments are doing to solve it. Towards this end, we will be establishing an email service you can subscribe to, and publish contact details for all federal and state parliamentarians so you can send them hearts and flowers or brick bats depending on how well they are addressing needs for climate action.

Is this all worth the effort?

We have to turn away from the the Apocalypse on the road to hothouse hell, and we won’t do this by continuing with business as usual!

It seems to have taken the clear thinking of Greta Thunberg, then a 16 year-old school girl, who concluded school was pointless as long as humans continued their blind ‘business as usual’ rush towards extinction.

greta-act-as-if-the-house-was-on-fire
Listen to Greta’s speech live at the World Economic forum in Davos 2019. Except for her reliance on the IPCC’s overoptimistic emissions budget, everything she says is spot on what even she, as a child, can understand the alternatives and what has to happen.

In other words, wake up! smell the smoke! see the grimly frightful reality, and fight the fire that is burning up our only planet so we can give our offspring a hopeful future. This is truly the only issue that matters. Even the IPCC’s hyperconservative Sixth Assessment Report that makes it clear we are headed for an existential climate catastrophe if we don’t stop the warming process.

In Greta’s words, “even a small child can understand [this]”.

People hope for their children’s futures. She doesn’t want your hopium. She wants you to rationally panic enough to wake up, pay attention to reality, and fight the fire…. so all of our offspring can have some hope for their future.

In our present situation where most governments still support and even fund fossil fuel production and use, the most effective actions we can take as individuals is to revolutionize our governments to prioritize action on climate change above all other things. Nothing else matters if we have no future….

If we can get climate savvy governments in power soon enough, we may be able to mobilize enough action to survive our accidental disruption of Earth’s Climate System so our kids and grandkids inherit a world they can live in…

This is who we are working for! Think of your families’ futures.
Views expressed in this post are those of its author(s), not necessarily all Vote Climate One members.

NSW: If you haven’t voted, please THINK first

Unwelcome reality is that we face an extremely dangerous climate emergency. Politicians must shift from business as usual to emergency mode.

Anyone who pays attention to weather and climate will know that lethally dangerous extreme weather events such as floods, droughts, wildfires have been growing increasingly more extreme, widespread, and frequent. These will keep getting more and more lethal as long as our planet keeps getting warmer. This is an emergency!

The scientific evidence as summarized in the 8000 page report of the Intergovernmental Panel on Climate Change (a United Nations organization comprised of the representatives of the 180 nations involved in the World Meteorological Organization) is so overwhelmingly comprehensive and complete that is no longer contestable. The Australian Climate Council explains it. Our own Climate Sentinel News blog surveys the vast array of evidence and considers its implications and government’s reactions in more depth. Three major articles focus on NSW (click the image to open the article):

David Spratt, of the Breakthrough National Centre for Climate Restoration is one of many sources documenting the causes and naturse of the dangers we face. Spratt posted 7 articles detailing major tipping points towards catastrophes likely to be crossed as the world continues to warm. His latest article, Reclaiming ‘Climate Emergency’ considers the kinds of political shifts required to move from business as usual’s ignoring crisis situations to actively managing them. Spratt summarizes the shifts in the table replicated from the article replicated here:

Before you fill in your ballot papers, please think about which candidates/parties on the ballots have the willingness, ability, or capacity to deal with the genuine emergencies we face. Will wishful thinking, party dogma or denial or reality be enough? I.e., usiness as usual – the normal mode for the major political parties, and some of the minor parties or independents. If you can vote in your electorate for someone who seems ready, willing and able to deal with climate emergency issues, please do so.

Vote Climate One can make it quick and easy for you to choose.

Use our VOTING GUIDES: NSW State Election 2023 to learn more about what the the parties and independent candidates in your electorate offer. How we thoroughly assessed parties and independents is described in Climate Lens Traffic Light Assessment.

Those we found to be generally tied to vested interests and/or unrealistic party or personal dogmas; or deniers of the climate crisis are flagged with red lights without any detailed justification. We use the orange light for those individuals and parties we thought might help or at least not impede required climate action, but could not fine enough evidence they would actually drive climate action.

Green lights were granted only where we found enough good evidence that a candidate or party could be trusted to put action on the climate emergency high on their priorities in Parliament. In these cases we also provide voters with links to some of the information justifying our ranking.

All this is distilled in our easy and quick to use voting guide for each electorate showing our ranking of all the candidates you can vote for. Grandad Rob, with a little help from a couple of youngsters in his tribe, demonstrates:

With a lot of work, our species and families may just might be able to survive the 21st Century.

Featured image:

From Lismore City News: 16/03/2022 – Flooding on February 28 was the worst Lismore had ever experienced, reachning 14.4m and leaving devastation in its wake.

For that matter following the horrific bushfires of the Black Summer of 2020-2021 and extensive droughts catastrophic floods began soon after with a rare sequence of La Niñas when vitually all areas of NSW experienced major flooding at least once, if not several time since.

Views expressed in this post are those of its author(s), not necessarily all Vote Climate One members.